
See Experiences
Visit Ceros Inspire for great examples of data visual content.


+
Schedule a demo.
Want to learn more about how to create engaging data visual content with Ceros + ChartBlocks? Fill out the form below and we'll be in touch to schedule a demo.
How does Ceros work?


Gain insight, take action.
Find out how your audience really engages with your content. Not only do we provide you with detailed data on some of the performance metrics you're already familiar with, but we also measure every single interaction you build into your content.
Seamlessly integrate with Ceros
Easily embed ChartBlocks charts into Ceros experiences for richer, interactive data content. Charts dynamically update across the web when datasets change, keeping your content accurate and fresh.
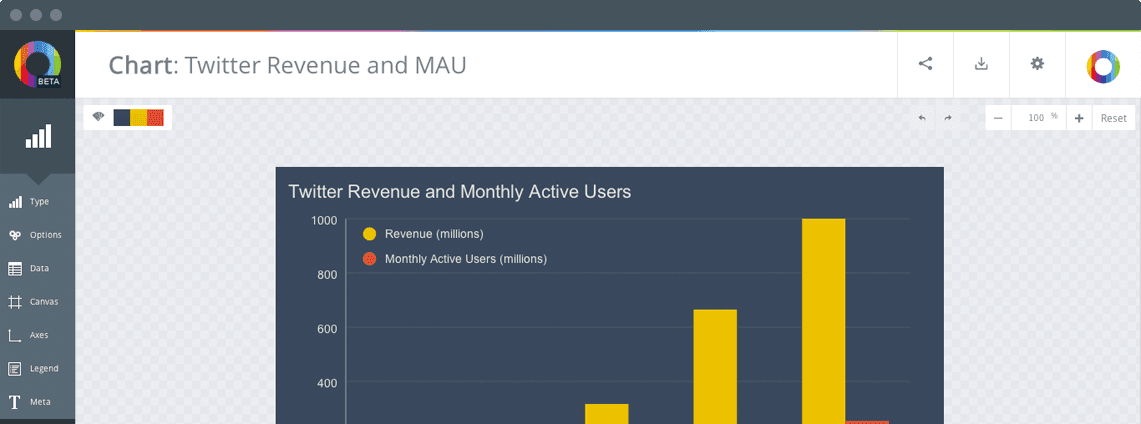
Create better data visual content
ChartBlocks helps you tell your stories with data more efficiently. Build and publish charts in minutes with a simple wizard. Import data from almost any source in just a few clicks. Download, share, or embed your chart to easily distribute your data visualizations.
Read the press release
Create beautiful, responsive charts that dynamically update across the web, without writing a single line of code.


Learn More
Ceros experiences can live anywhere and it only takes seconds to go live. A single click and Ceros will publish, host, and provide you with a URL and embed code.
Go live in
an instant.

Drop assets onto the freeform canvas and lay them out however you want. Easily add animation and interaction with the Ceros Studio.
Bring your ideas to life in the Ceros Studio
Find out how your audience really engages with your content. Not only do we provide you with detailed data on some of the performance metrics you're already familiar with, but we also measure every single interaction you build into your content.
Gain insight,
take action.