Diversified Thinking Through the Cycle
DIVERSIFIED RETURN FUND
RWC Emerging and Frontier Markets
Introduction
The team continues to monitor Covid-19 as it is having a material impact on the economies and companies in which we invest. Below, we outline some of our preliminary conclusions:
Macroeconomic environment
Despite recent events and the effects of Covid-19, China’s economy is still in a period of transition. Investment was the predominant driver of GDP growth since the country joined the World Trade Organisation (WTO) in 2001. The greatest credit expansion in history financed significant investment in infrastructure which lifted 750 million people out of poverty. Investment contribution to GDP growth peaked in 2012 at 48%. Consumption has now become the key driver of economic growth since then and now contributes roughly 55% of GDP.
Over the long term, China’s economic growth will continue to be driven by domestic consumption. In 2019, China passed $10,000 GDP per capita and looks set to maintain its growth trajectory. Consumption of services is increasing as are the levels of premiumisation within different product categories. In this respect, it is likely that China follows the path carved out by other North Asian markets such as South Korea, Taiwan and Japan.
John Malloy and James Johnstone co-manage the RWC emerging and frontier markets team. The team is composed of a further 17 analysts, economists and strategists based in Miami, London and Singapore, many of whom have worked together for over twenty years. The team joined RWC Partners in 2015 and now manages c. $9bn for its clients. Emerging and frontier markets represent the fastest growing countries in the world. The RWC team believes the continued growth in these markets represents opportunities across a range of industries.The highly experienced and dedicated team takes an index-agnostic, opportunistic approach which allows it to explore investment opportunities that are often off the beaten track.


‘Despite recent events and the effects
of Covid-19, China’s economy is still
in a period of transition’

This forms the foundation for our decision-making process and
guides how much and what kinds of risk to take in the portfolio.
The credit-cycle framework often leads to contrarian thinking and investment exposures. It is an investment tool designed to identify risks either increasing or dissipating in areas of the financial system and positioning accordingly.
1. The Credit-Cycle Framework
The team

Download the report
Phases of credit cycle
Figure 1: Reported Covid-19 cases
China’s nominal GDP as a percentage of United States’
66%

Unless otherwise stated, all opinions within this document are those of the RWC Diversified Return Investment Team, as at 27th March 2020
A liquid, low-cost, transparent way for investors to gain true diversification from traditional equity and bond holdings
The fund prioritises portfolio construction and seeks to harness alternative-return streams. This combination means extending beyond basic asset allocation techniques in order to provide genuine diversification. Different strategies are deployed according to the position in the cycle, ensuring they are in sync. Achieving balance in the fund through thoughtful portfolio construction helps ensure that contrarian thinking mitigates losses.
This combination of contrarian positioning because of the credit-cycle framework, sophisticated portfolio construction, and alternative return streams helped produced the fund’s outcomes. Not only did the fund perform well during the market sell-off but the returns also have been positively skewed. Meanwhile, the pattern for equities and even bonds have been fat-tailed and negatively skewed. Traditional correlations, upon which basic asset allocators rely, have broken down, meaning their means of diversification have let them down when they need them most.
2. Portfolio Construction and Alternative Return Streams
Past performance is not a guide to the future. The price of investments and the income from them may fall as well as rise and investors may not get back the full amount invested. “Strategy” is defined as the investment guidelines utilized by Clark Fenton in managing the Agilis Master ICAV adjusted by the estimated ongoing charge of the Protea Fund- Agilis UCITS Class A (0.85%) for the period 01 June 2017 – 25 June 2018, the gross return in USD of the Protea Fund-Agilis UCITS adjusted by the estimated ongoing charge of the Protea Fund-Agilis UCITS Fund Class A (0.85%) between 25 June 2018 and 10 October 2018 and the net return of the Protea Fund-Agilis UCITS Fund Class A USD from 10 October 2018 through 25 October 2019 and the net return of the RWC Diversified Return Fund Class B USD after 25 October 2019. The Agilis Master ICAV was launched on 1 June 2017 and was managed with similar investment guidelines, using the same investment process as the Protea Fund- Agilis UCITS. The performance history of the Agilis Master ICAV is estimated using the ongoing charge of the Protea Fund- Agilis UCITS Class (0.85%) ongoing charge. The actual performance of the Agilis Master ICAV may have differed significantly from the results shown based. The results show are for illustrative purposed only. They are based on the historical returns of the investments of the fund but adjusted to reflect the ongoing charge of the Protea Fund-Agilis UCITS fund. The results do not represent, and are not necessarily indicative of, the results that may be achieved in the future. There can be no assurance that an investor’s performance would have been the same. 1,2 Index performance data is measured in USD and sourced from Bloomberg. All statistics are measured using weekly performance data.

The following section describes the phases of the credit cycle the fund has encountered thus far, highlighting how it was positioned and performed in each.
In Q4 2018 the fund transitioned to a more defensive stance, judging that the Overextended phase had begun. This conclusion was based on the continued increase in leverage, particularly in corporate credit, while earnings and cash flows were declining. Furthermore, financial conditions were tightening as central banks attempted to normalise monetary policy. The fund moderated its net exposure to risky assets, especially equities, increased convexity positions, and prioritised liquidity. The strong absolute and relative performance in Q4 2018 was function of this defensive transition.
In 2019, the fund maintained its defensive outlook and exposure as earnings and credit quality continued to decline while leverage did not. This posture proved contrarian as market participants were fixated on easier financial conditions, even suggesting that monetary largesse might have done away with credit, business and investment cycles for good. The fund sustained moderate losses as a result of this contrarian stance. The losses were mitigated by the fund’s portfolio construction and use of limited-loss strategies to achieve convexity.
By definition, preparing for a downturn must happen in advance. The fund was well positioned for the onset of the Deleveraging phase, which began mid-February 2020. With moderate net exposure, convexity strategies and ample liquidity, the fund has performed well. The fund’s short exposures have been significant contributors to performance. Basic asset allocation would not have accomplished the same results as traditional fixed-income to equity correlations have been unstable.
Full-cycle perspective and contrarian thinking mean we are preparing for the next phase of the credit cycle: Balance-sheet Repair. This will entail investing from the long side, taking risk as many are capitulating to the bear market. The nature of our investments will change from convex to more carry orientated strategies, and net exposure to risky assets will increase significantly. To signal the shift from Deleveraging to Balance-sheet Repair, we will be looking for a diminution of debt levels and a trough in earnings. At the same time, valuations will be low and risk premia high. Normally, the expected rate of defaults exceeds the likely reality at this point because negative sentiment overshoots the actual repair of financial health. As an aside, the nature of this cycle’s balance-sheet repair may entail inflationary pressures, which will necessitate a different approach. As such, a contrarian perspective will be critical.
Overextended
Deleveraging
Balance-sheet Repair
1. The Credit-Cycle Framework
2. Portfolio Construction and Alternative Return Streams
From Q3 2017 through Q3 2018, the fund was managed for the latter stages for the Re-leveraging phase of the credit cycle. While debt levels in the financial system had grown significantly, so had earnings and cash flows to service the debt. Consequently, the leverage build-up was not yet flashing warning signs, notwithstanding more stretched valuation levels and greater investor complacency. The fund was positioned with moderate net exposure, few hedges and participated in risk assets’ rally.
Releveraging
Q3 2017 - Q3 2018
Q4 2018
From Q3 2017 through Q3 2018, the fund was managed for the latter stages for the Re-leveraging phase of the credit cycle. While debt levels in the financial system had grown significantly, so had earnings and cash flows to service the debt. Consequently, the leverage build-up was not yet flashing warning signs, notwithstanding more stretched valuation levels and greater investor complacency. The fund was positioned with moderate net exposure, few hedges and participated in risk assets’ rally.
Releveraging

In Q4 2018 the fund transitioned to a more defensive stance, judging that the Overextended phase had begun. This conclusion was based on the continued increase in leverage, particularly in corporate credit, while earnings and cash flows were declining. Furthermore, financial conditions were tightening as central banks attempted to normalise monetary policy. The fund moderated its net exposure to risky assets, especially equities, increased convexity positions, and prioritised liquidity. The strong
absolute and relative performance in Q4 2018 was function of this defensive transition. In 2019, the fund maintained its defensive outlook and exposure as earnings and credit quality continued to decline while leverage did not. This posture proved contrarian as market participants were fixated on easier financial conditions, even suggesting that monetary largesse might have done away with credit, business and investment cycles for good. The fund sustained moderate losses as a result of this contrarian stance. The losses were mitigated by the fund’s portfolio construction and use of limited-loss strategies to achieve convexity.
Overextended
Q4 2018
Q3 2017 - Q3 2018
Feb 2020
By definition, preparing for a downturn must happen in advance. The fund was well positioned for the onset of the Deleveraging phase, which began mid-February 2020. With moderate net exposure, convexity strategies and ample liquidity, the fund has performed well. The fund’s short exposures have been significant contributors to performance. Basic asset allocation would not have accomplished the same results as traditional fixed-income to equity correlations have been unstable.
Deleveraging
Feb 2020
Mar 2020 onwards
Q4 2018
Full-cycle perspective and contrarian thinking mean we are preparing for the next phase of the credit cycle: Balance-sheet Repair. This will entail investing from the long side, taking risk as many are capitulating to the bear market. The nature of our investments will change from convex to more carry orientated strategies, and net exposure to risky assets will increase significantly.
To signal the shift from Deleveraging to Balance-sheet Repair, we will be looking for a diminution of debt levels and a trough in earnings. At the same time, valuations will be low and risk premia high. Normally, the expected rate of defaults exceeds the likely reality at this point because negative sentiment overshoots the actual repair of financial health. As an aside, the nature of this cycle’s balance-sheet repair may entail inflationary pressures, which will necessitate a different approach. As such, a contrarian perspective will be critical.
Balance-sheet Repair
Mar 2020 onwards
Q4 2018
CLICK FOR DISCLAIMER
For more RWC content >
Q1 2020
RWC Emerging
and Frontier
Markets
Figure 2: China PMIs
Figure 3: Returning workers in China after Chinese New Year
Figure 4: China Required Reserve Ratio


Tensions relating to trade started to emerge in 2018 between the United States and China as President Donald Trump took a more combative stance to foreign policy. The conflict between the two nations began with disputes concerning trade imbalances. However, discussions broadened considerably encompassing disagreements on technology, military competition, currency dynamics and ideology. The conflict has intensified over time, arguably since China joined the WTO in 2001. President Xi Jinping has been unequivocal about China’s ambitions as a global superpower which aggravated the United States. Thus, these trade negotiations are complex, politically motivated and dependent on a multitude of variables.
The United States and China signed the first phase of the trade deal in December 2019. The deal outlined various initiatives such as putting tariff increases on hold. While many unknowns still remain, especially with regard to intellectual property and logistics details surrounding increased imports of US goods, we expect a return to these discussions after the initial effects of Covid-19 have subsided globally. The next phase of the trade war will likely focus on technology. Finding common ground will be a difficult task.
Nevertheless, governments and industries are starting to adapt. China is developing its own technology supply chain which brings significant opportunities for domestic semiconductor and software companies. The country continues to open up from a financial services and capital markets perspective which should allow for improved disclosure, transparency and general corporate governance.
Trade negotiations


China is already the world’s largest economy in PPP terms while nominal GDP is c.66% of the United States’. According to IMF data, the country will likely overtake the United States in 2030, all else being equal. However, China is under-represented from a capital markets perspective. China’s total stock market capitalisation is 46.5% of GDP and the country’s weight in the MSCI World Index is negligible.
The country’s efforts to open up its domestic financial markets through MSCI/FTSE inclusion suggests that domestic equity markets will be better represented and more accessible to investors going forward. Moreover, the level of institutional investment is increasing considerably in markets that have historically been retail dominated, such as China A Shares.
The China investment opportunity


Uncovering the universe

The team’s current universe is around 4,000 companies across exchanges in Shanghai, Shenzhen, Hong Kong and the United States. Liquidity is abundant in most companies. Accessibility is improving in Shanghai and Shenzhen since the introduction of Stock Connect in 2014.
In our analysis of stock returns over the past decade, China’s index returns have not been particularly rewarding. The MSCI China Index has returned 16.4% since 2010. In contrast, there have been growth stocks which have outperformed State-Owned-Enterprises dramatically, such as Tencent which has returned over 10,000% since listing in 2007. Return distributions have been far from normal even considering survivorship bias. If the past is any guide to the future, the best growth opportunities should outperform over the long term. In our view, there are several reasons for this outperformance which we outline below:
Our investment process relies on a combination of macroeconomic,
thematic and bottom-up fundamental analysis in addition to
a comprehensive ESG process. Within our holdings, we prefer industry
leaders with competitive advantages. Economies of scale, research
and development capability, operational excellence and management quality are just some of the factors that we analyse when uncovering investment opportunities. Well over half of our positions are in companies which are industry leaders in their respective markets.

Investment opportunities

Challenges with Chinese stocks
The team combines several inputs to build conviction in Chinese stocks in order to increase our success rate. We outline these below:
Company Research | Industry Insights | Expert Networks | Internet Feed Investor Psychology | ESG
The challenges are obvious when it comes to Chinese stocks. Data
availability and financial reporting standards still lag in developed markets
and some emerging markets. The management of some State-Owned Enterprises lack the incentive to run companies in the best interests of minority shareholders and there are many company-specific corporate governance issues.
Conversely, China has a growing internet industry. New data sets and information are now widely available online. These alternative sources of data, if interpreted properly, can help investors make better investment decisions. Despite recent improvements, China is still a retail investor driven market, particularly in the domestic A-share market. Stock prices can sometimes decouple from company fundamentals. Volatility is high in the short term with news driving the majority of share price moves. However, investor psychology has certain biases that can work in the favour of active managers.
Herd mentality is more severe in the A share market than in more institutionally driven markets, but this creates opportunities for those investors with intricate knowledge of the underlying business fundamentals.
Figure 5: Contribution to China’s GDP
Figure 6: China’s educated workforce
Figure 7: Korea, Japan, Taiwan and China GDP per capita comparison
Figure 8: China Household Savings Rate
Figure 9: Consumption of goods
and services
Figure 10: Consumption expenditure
is diversifying
Figure 11: Evolution of trade war
Figure 12: Relocation of China’s
supply chain
Figure 13: Acceleration of China’s semiconductor investment
Figure 14: China nominal GDP
Figure 15: China PPP GDP
Figure 16: GDP, market cap share and weighting of major economies
Figure 17: MSCI inclusion of North Asian markets
Figure 18: Distribution of stock returns 2010 – 2019
Figure 19: Net income growth of Chinese corporates over 5 to 10 years
Despite the current environment of low interest rates and deflationary pressure, there are still growth opportunities on offer. We have identified many investment opportunities from a multitude of different themes including:
Technology
Disruption
dISPOSABLE INCOME GROWTH
New Media, Leisure & Gaming
Health & Fitness
New Auto Technology
5G

Importantly, the team is in constant dialogue with the management of portfolio holdings and continues to monitor sectoral, thematic and macroeconomic developments related to Covid-19. Earnings estimates and price targets are under constant review.
In the context of Covid-19, despite being the initial epicentre of the virus, China has managed to deal with the outbreak decisively and effectively. While other countries continue to implement restrictions and lockdowns in response to the global pandemic, China seems to be on the road to recovery. The PBOC has injected more liquidity and economic activity, capacity utilisation and population mobility are all improving paving the way for the global economy to follow once cases and deaths flatline.

The disease has spread globally and there are currently over
3.3 million reported cases and roughly 234,000 reported deaths connected to the virus (case reported as at 30th April 2020).
Covid-19 (SARS-CoV-2) is from the SARS family and was detected in three patients with pneumonia connected to a cluster of acute respiratory cases in Wuhan in December 2019.
The incubation period can last between 2-14 days and symptoms can be mixed in patients which has caused difficulties in diagnosis and containment.
The disease’s mortality rate varies depending on age, underlying health conditions and medical resources. However, there are many uncertainties due to our lack of knowledge of the virus.
Strict quarantine measures and social
distancing have proven effective in
reducing infection.
The epidemic curve has flattened in some North Asian countries which have been extremely vigilant in implementing strict containment measures.
The recovery will differ by industry. E-commerce, online education, entertainment and manufacturing are least impacted. Travel and restaurant industries will likely see a prolonged negative impact.
No preventive vaccine or medication has been developed as yet, although some scientists suggest that the coming warmer months will hopefully reduce the speed of the spread.
Governments and authorities are in the process
of rolling out unprecedented levels of monetary
and fiscal stimulus.
While this stimulus will provide some relief, there will likely be significant pressure on nearly all economies and corporates over the coming months which means balance sheet stability is of paramount importance
China had a V-shaped economic recovery after successful implementation
of quarantine measures. It took roughly 50 days to recover activity
to 90% of its normalised level, after daily new cases peaked.
The rest of the world may follow a similar path at a slower
pace, considering the Chinese government has more
administrative power.
Using SARS as a precedent, people tend to have higher health awareness after the virus recedes. Healthcare and sportswear companies may see strong demand growth in the following years.

There was less sophistication in the stock market due to the abundance of retail investors. Stocks were inefficiently priced,
and the valuation reward was substantial once the market became more institutionalised.
As the economy matures, corporates are maturing too as GDP growth slows, and market movements are driven more by business fundamentals rather than macroeconomics. Industry leaders continue to consolidate their positions resulting in higher market share and valuation premiums.
China is a vast economy, which means the opportunity set for companies is equally large. Companies that are ‘early movers’ in their respective industries can benefit from growth trends by leveraging their competitive advantages, thereby increasing their moats.

Year in which IMF predicts China will overtake
the US in GDP
2030


Size of team’s universe of companies, across Shanghai, Shenzhen, HK and the US
4,000
Stock Connect
was introduced, improving accessibility in Shanghai and Shenzhen
2014
Figure 1: Reported Covid-19 cases
Figure 2: China PMIs
Figure 3: Returning workers in China after Chinese New Year
Figure 4: China Required Reserve Ratio
Figure 5: Contribution to China’s GDP
Figure 10: Consumption expenditure
is diversifying
Figure 9: Consumption of goods
and services
Figure 8: China Household Savings Rate
Figure 7: Korea, Japan, Taiwan and China GDP per capita comparison
Figure 6: China’s educated workforce
Figure 11: Evolution of trade war
Figure 12: Relocation of China’s
supply chain
Figure 13: Acceleration of China’s semiconductor investment
Figure 14: China nominal GDP
Figure 15: China PPP GDP
Figure 16: GDP, market cap share and weighting of major economies
Figure 17: MSCI inclusion of North Asian markets
Figure 18: Distribution of stock returns 2010 – 2019
Figure 19: Net income growth of Chinese corporates over 5 to 10 years
What Can China Teach the World?
A premiumisation trend is emerging within the Chinese consumer which, according to the economic development of more advanced economies, is typical of a country that has just passed the $10,000 GDP per capita level. We believe It is likely that companies with strong brands, quality products and efficient operations will profit the most. We have positions in Robam and Gree which are direct beneficiaries of this trend. We also believe that auto demand will recover after the effects of Covid-19 subside. Geely is one of the largest domestic auto producers in the country, is expanding globally and offers competitive mass models.
DISPOSABLE INCOME GROWTH

Figure 23: Mobile time and digital advertising share

Figure 22: Disposable income growth
Portfolio holdings are subject to change at any time without notice. This information should not be construed as a recommendation to purchase or sell any security.
The media and entertainment industry is transforming dramatically
in China due to a combination of technological changes and creative disruption led by millennials who are eager to spend money on good content. Focus Media is one of the country’s leading advertisers
and is one of the few companies that is combining offline with online advertising in order to grow its omnichannel presence. JOYY is another beneficiary of this thematic; the company offers live broadcasting
content in China and overseas.
new media, leisure & gaming

Figure 24: Breakdown of mobile application usage
China’s population is aging with estimates suggesting over 350 million people will be over the age of 65 by 2040. This will likely lead to a greater awareness and reliance on healthcare. Regulators are adapting to the country’s demographic changes and are reforming the national reimbursement system. Large companies are being encouraged to consolidate, and quality products should see an increase in volumes. We hold industry leaders Zhejiang Nhu, Kangtai and Sinopharm in the vitamin, vaccine and medical logistics sectors, respectively.
Health & fitness
Figure 26: China health care expenditure
Figure 25: China population over 65


Portfolio holdings are subject to change at any time without notice. This information should not be construed as a recommendation to purchase or sell any security.
Portfolio holdings are subject to change at any time without notice. This information should not be construed as a recommendation to purchase or sell any security.
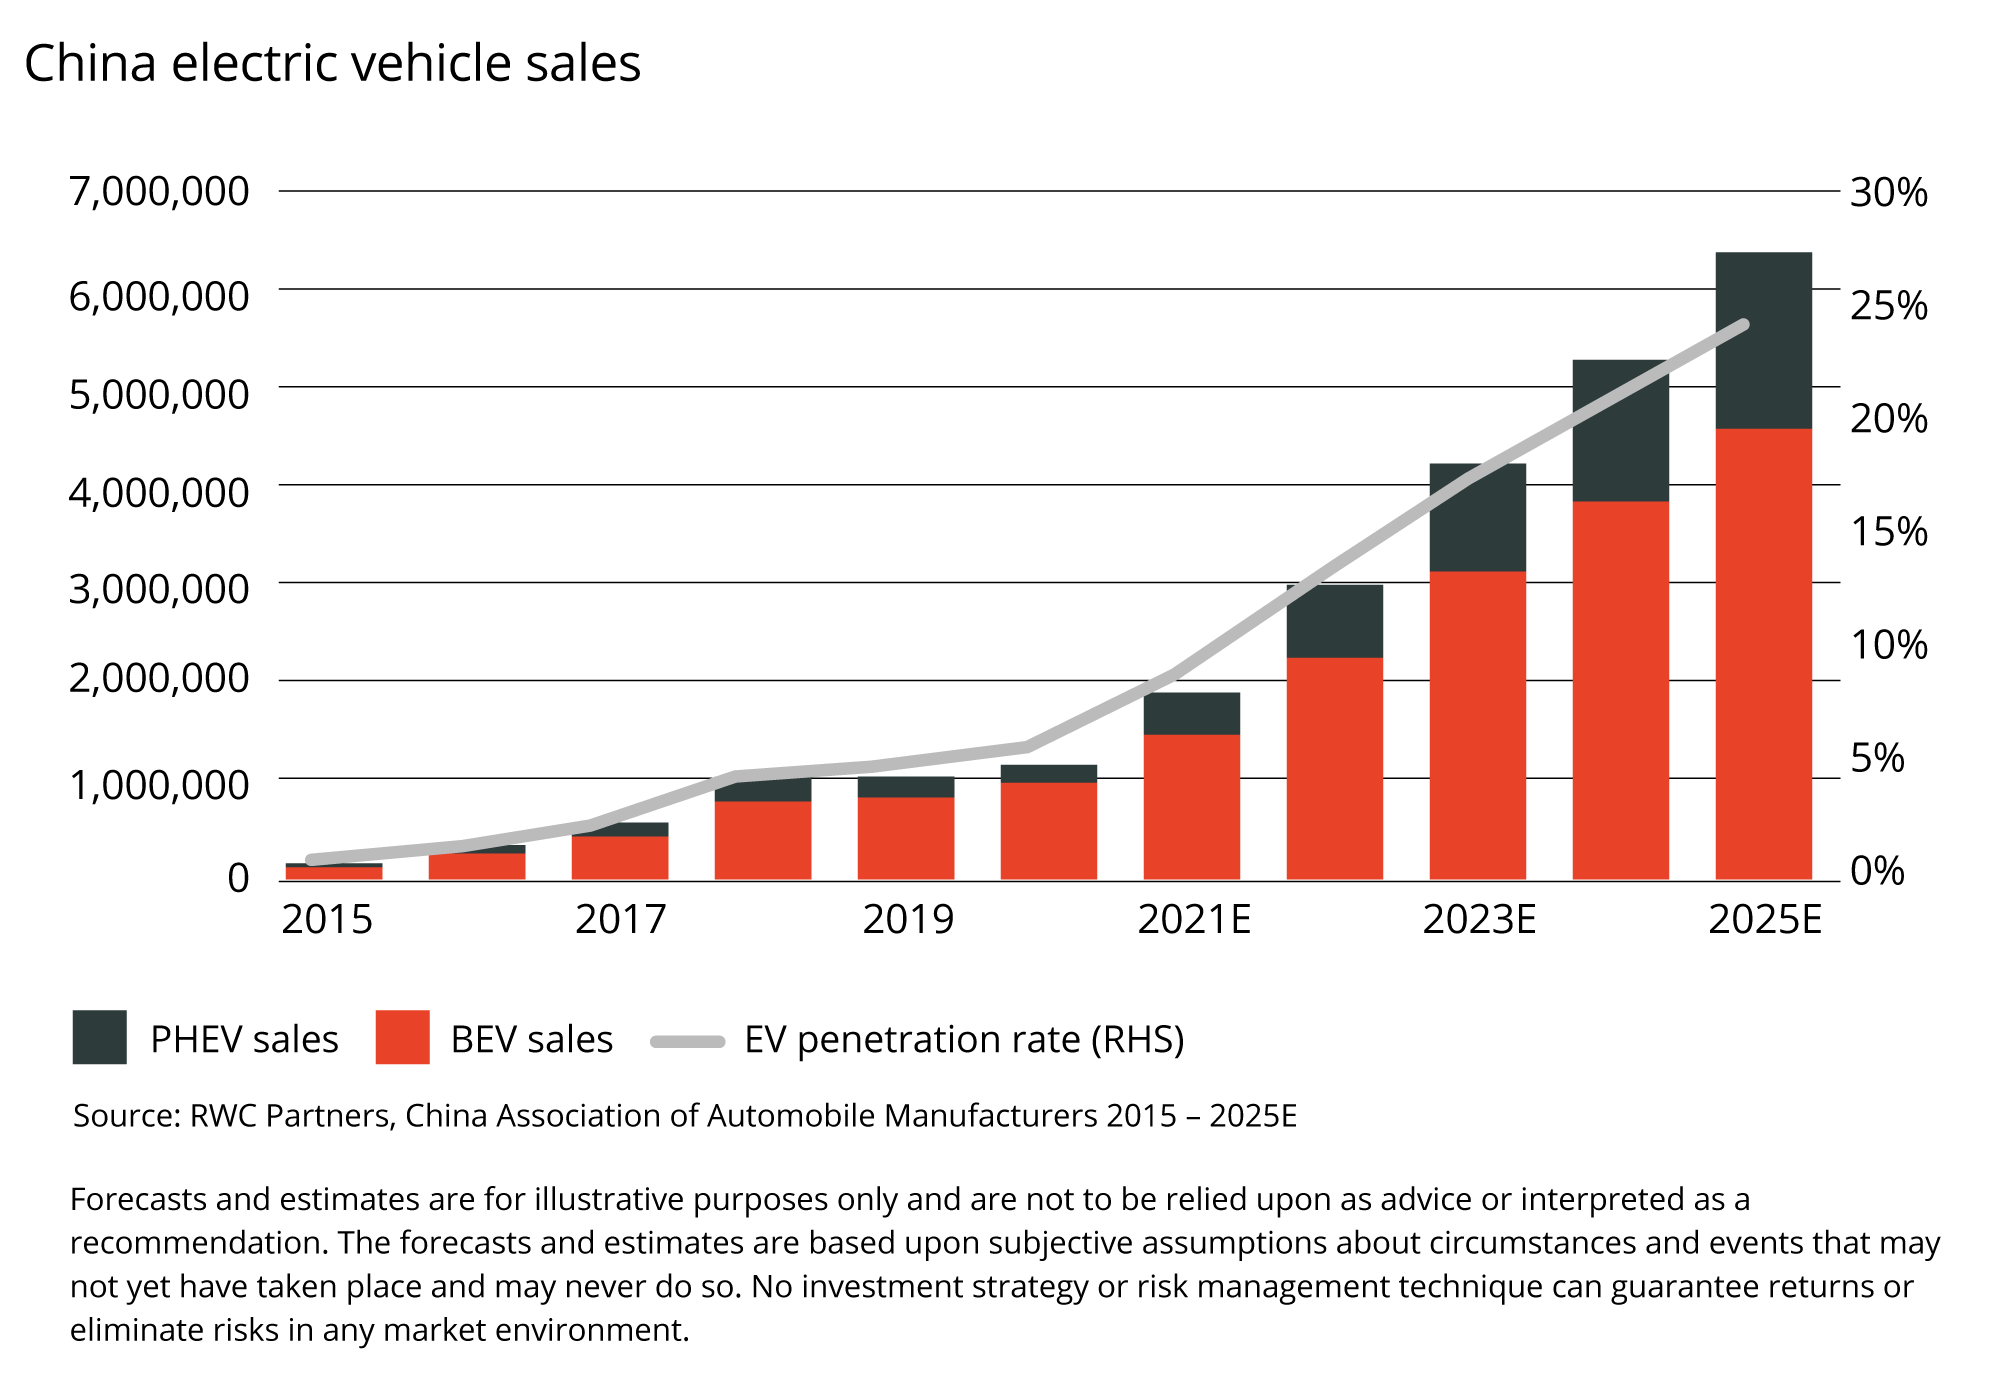
The substantial growth in electric vehicles over the last few years has been largely due to government subsidies. However, factors such as the superior driving experience, environmental advantages, upgrade convenience and price reductions of electric vehicles suggest that consumer demand will likely grow significantly. Huayou Cobalt, a vertically integrated cobalt miner, refiner and battery precursor producer could be a significant beneficiary.
New Auto Technology
Figure 27: China electric vehicle sales
China is one of the world’s leaders in the investment and adoption of 5G. Base stations and other 5G-related hardware are being rolled out ahead of schedule. Products such as cars, consumer electronics and other hardware are in the process of upgrading in order to withstand the higher transmission speed that 5G provides. Kinwong, a PCB producer that sells into multiple segments of the 5G value chain, could be a key beneficiary.
5G
Figure 28: 5G capital expenditures comparison (Including Spectrum)

Portfolio holdings are subject to change at any time without notice. This information should not be construed as a recommendation to purchase or sell any security.

The team
John Malloy and James Johnstone co-manage the RWC emerging and frontier markets team. The team is composed of a further 16 analysts, economists and strategists based in Miami, London and Singapore, many of whom have worked together for over twenty years. Colin Liang leads the RWC emerging and frontier market team’s China research and, with the China team, manages the China Opportunity strategy. The team joined RWC Partners in 2015 and now manages c.$6.8bn for its clients.