Reasons to Consider
AAM Brentview Dividend Growth ETF (BDIV) is an actively managed dividend growth ETF sub-advised by Brentview Investment Management (Brentview).��With over 25 years of experience across various market environments, Brentview has a singular focus and proven track record of investing solely in dividend-paying equities.
Above Market Yield�BDIV seeks to provide current income with an aggregate yield that is equal to or greater than the S&P 500.
Faster Dividend Growth�BDIV aims to provide a portfolio dividend growth rate greater than the S&P 500 Index.
Lower Portfolio Beta�BDIV targets high-quality companies with favorable risk-adjusted returns in an effort to help manage risk and control volatility.
Learn more about the BDIV difference
Why Brentview Investment Management?
Access to Institutional Strategies in an ETF
Access to Institutional Strategies in an ETF
Active Portfolio Management
Singular focus on dividend growth investing
Active Portfolio Management
Singular focus on dividend growth investing
With over 25+ years of experience across various market environments, Brentview has a proven track record of investing solely in dividend-paying equities while controlling risk.


Brentview incorporates a fundamentally driven approach to identify companies best positioned for total return potential.


Meet the Brentview Investment Team +
The underlying investment strategy is the same one Brentview has managed for institutional clients for over 15 years.


About Brentview Investment Management +
What's In A Name?
Brent is derived from a Celtic word which means "elevated." As a long-term investor, an elevated view may be achieved through fundamental research, thereby providing greater perspective and insight into each company.
Brentview was founded on the timeless principle of utilizing fundamental research to determine portfolio holdings.

Dividend Investing: A Timeless Investment Strategy
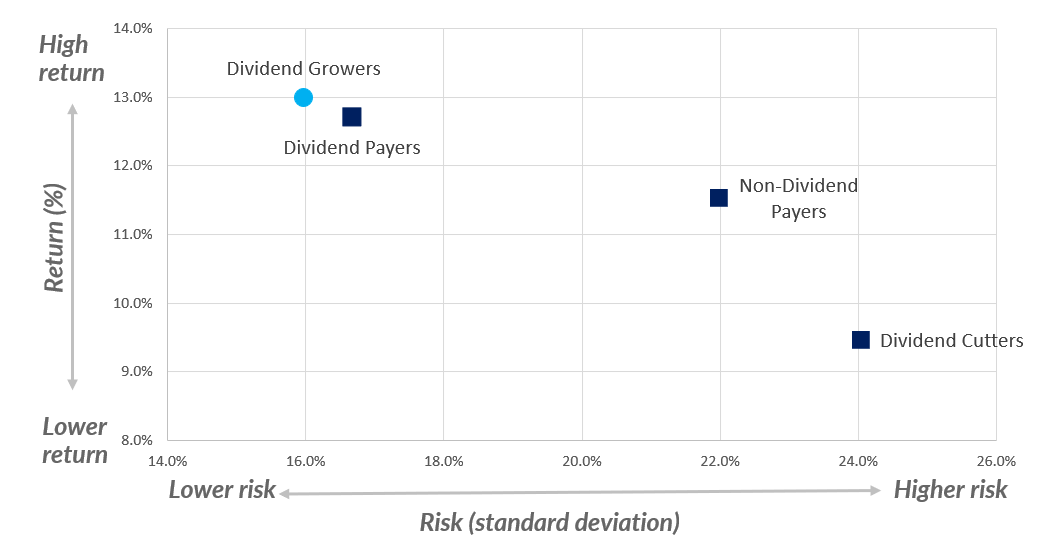
Dividends have historically been a meaningful contributor to total return comprising approximately 40% of total returns since 1930. If you look even closer, you’ll see that it is the dividend growers that have the strongest risk/return profile versus other segments within the S&P 500 dividend-paying universe (Illustration 1).
The long-term outperformance by dividend growers can be attributable to critical elements such as:
A stable business model
A strong balance sheet
A history of capital discipline
Management policies committed to creating shareholder value

Lower risk
Higher risk
Risk (standard deviation)
High return
Lower return
Return (%)
Dividend Growers
Dividend Payers
Non-dividend payers
Dividend cutters
Illustration 1:
Risk/Return Profiles Across Dividend Growers, Dividend Payers w. No Change, Non-Dividend Payers & Dividend Cutters (1973 - 2025)
Source: Ned Davis Research.
A popular dividend growth strategy uses minimum thresholds for dividend yield or payment history. Brentview, however, believes considering dividend payers with a wider range of yields and payment histories expands opportunities for portfolio diversification and total return.
Thus, BDIV expands its investable universe to consider all mid- to large-capitalization dividend-paying companies across the yield spectrum, growth rates, and paying history length (Illustration 2).
FOR ILLUSTRATIVE PURPOSES ONLY.
BDIV’s actively managed approach typically diversifies across all GICS sectors with a focus on:

BDIV
Dividend Growth
Capturing Yield
Illustration 2:
BDIV's Investable Universe by Dividend Yield
0-1% Yielders
48%
1-2% Yielders
18%
2-3% Yielders
16%
2-3% Yielders
18%
Managing Beta
Why Settle For A Smaller Investable Universe?


Meet the Brentview Investment Management Team
James R. Boothe, CFA
Chief Investment Officer
Portfolio Manager
40+ years industry experience
Hai H. Vu, CFA
Director of Research
Portfolio Manager
25+ years industry experience

Close
Why might this be?
Focus on Dividend Growth
OBJECTIVE:
Illustration 3
Returns of Highest Dividend Yielders v. Largest Dividend Growers of S&P 500 Stocks

BDIV Investment Philosophy
About Brentview Investment Management
'Brent' is derived from a Celtic word which means "elevated." As a long-term investor, an elevated view may be achieved through fundamental research, thereby providing greater perspective and insight into each company. Brentview was founded on the timeless principle of utilizing fundamental research to determine our portfolio holdings.
Brentview Investment Management, LLC is a boutique money manager and certified minority business enterprise. Their three founding partners have maintained a singular focus on dividend growth investing, which extends from their collective experience at their prior firm Santa Barbara Asset Management. Brentview is employee owned and the partners invest their personal assets in their dividend growth strategies. In this way, our commitment to their clients extends beyond words.
To learn more, visit www.brentviewim.com
Meet the Brentview Investment Management Team
James R. Boothe, CFA
Chief Investment Officer
Portfolio Manager
40+ years industry experience
Hai H. Vu, CFA
Director of Research
Portfolio Manager
25+ years industry experience
For more information on AAM Brentview Quality Growth ETF, please contact your Financial Professional or complete the form below and we'll be in touch shortly.
This form is for use by financial professionals only who reside in the U.S. We're unable to act on any requests to buy, sell or exchanges securities included in the submission of this form. AAM will never share your contact information outside of AAM. By completing this form, you're agreeing to be contacted via email.
BDIV Fact Card

Spotlight Flyer

View Disclosures
The investment objectives, risks, charges and expenses must be considered carefully before investing. The fund’s statutory and summary prospectus contains this and other important information about the investment company, and may be obtained by calling 800.617.0004 or visiting www.aamlive.com.
Read it carefully before investing.
18925 Base Camp Road • Monument, CO 80132 • www.aamlive.com | CRN: 2024-1022-12069 R
Investing involves risk, including the possible loss of principal. Shares of any ETF are bought and sold at market price (not NAV) and may trade at a discount or premium to NAV. Shares are not individually redeemable from the Fund and may be only be acquired or redeemed from the fund in creation units. Brokerage commissions will reduce returns. Companies with high yield or payout ratio may underperform other securities in certain market conditions and reduce or discontinue paying dividends entirely while included in the index. The Fund’s return may not match or achieve a high degree of correlation with the return of the underlying Index. To the extent the Fund utilizes a sampling approach, it may experience tracking error to a greater extent than if the Fund had sought to replicate the Index. Diversification does not assure a profit or protect against a loss in a declining market. The Strategy is designed for long-term investors who are willing to accept short-term market price fluctuations.
Principal Risks: Principal risks of investing in this strategy include stock market risk, management risk, recent market events risk, and large cap company risk. Common Stock Risk: An investment in common stocks should be made with an understanding of the various risks of owning common stock, such as an economic recession and the possible deterioration of either the financial condition of the issuers of the equity securities or the general condition of the stock market. Growth stocks are typically more volatile than value stocks. All equity investments inherently have aspects of risk associated with them. Market Capitalization Risk: The securities of large-capitalization companies may be relatively mature compared to smaller companies and therefore subject to slower growth during times of economic expansion. Dividend-Paying Securities Risk: Investment in dividend-paying securities could cause the Fund to underperform similar funds that invest without consideration of a company’s track record of paying dividends. Securities of companies with a history of paying dividends may not participate in a broad market advance to the same degree as most other securities, and a sharp rise in interest rates or economic downturn could cause a company to unexpectedly reduce or eliminate its dividend. There is no guarantee that the issuers of the securities held by the Fund will declare dividends in the future or that, if declared, they will remain at their current levels or increase over time. New Fund Risk: The Fund is a recently organized investment company with no operating history. As a result, prospective investors have no track record or history on which to base their investment decision. Management Risk: The Fund is actively managed and may not meet its investment objective based on the Adviser’s success or failure to implement investment strategies for the Fund. Information Technology Sector Risk: Market or economic factors impacting information technology companies and companies that rely heavily on technological advances could have a significant effect on the value of the Fund’s investments. The value of stocks of information technology companies and companies that rely heavily on technology is particularly vulnerable to rapid changes in technology product cycles, rapid product obsolescence, government regulation and competition, both domestically and internationally, including competition from foreign competitors with lower production costs.
Definitions: Absolute Yield measures how much income a company pays out to shareholders in dividends relative to its share price. Beta is a measure of the volatility of a security or a portfolio in comparison to the market as a whole. Cash flow is the net amount of cash and cash equivalents moving into and out of a business. Discounted Cash Flow is a valuation technique that uses expected future cash flows and a discount rate to estimate the present fair value of an investment. Global Industry Classification Standard (GICS) is a method for assigning companies to a specific economic sector and industry group that best defines its business operations. Maximum Drawdown is the peak-to-trough decline of an investment during a specific period and is expressed as a percentage. Price/Book Value Ratio (P/BV) is calculated by dividing the current closing price of the stock by the latest quarter’s book value per share. Price/Cash Flow Ratio (P/ CF) measures the value of a stock’s price relative to its operating cash flow per share, which adds back non-cash expenses such as depreciation and amortization to net income. Price/Earnings Ratio (P/E) is the ratio of a company’s stock price to the company’s earnings per share. Price/Sales Ratio (P/S) is calculated either by dividing the company’s market capitalization by its total sales over a 12-month period, or on a per-share basis by dividing the stock price by sales per share for a 12-month period. Sharpe Ratio is a measure of excess portfolio return over the risk-free rate relative to its standard deviation. Standard Deviation is a statistical measure of market volatility that measures how widely prices are dispersed from the average price. S&P 500 Index is a free-float capitalization-weighted index of the 500 large-cap common stocks actively traded in the United States. S&P 500 Equal Weight Index (EWI) is the equal-weight version of the S&P 500. Volatility is a measure of the variation in the price of an asset over time.
Not FDIC Insured • No Bank Guarantee • May Lose Value
©2024 Advisors Asset Management. Advisors Asset Management, Inc. (AAM) is an SEC-registered investment advisor and member FINRA/SIPC. AAM ETFs are distributed by Quasar Distributors, LLC. Quasar and AAM are not affiliated.�
Disclosures
Close


A singular focus on dividend growth investing
AAM Brentview Dividend Growth ETF
BDIV
History has shown us that the largest dividend-growing companies in the S&P 500 Index have outperformed the highest dividend-yielding companies. See Illustration 3.
A steady dividend growth rate cannot be understated because it often represents the quality of the underlying business and the company’s commitment to its shareholders.
BDIV employs rigorous quantitative, financial, and peer analysis to select steady dividend-paying companies that have demonstrated operating consistency, attractive fundamentals, and reasonable valuations.
Each company is analyzed based on its valuations and volatility and then evaluated against its peers. The end goal is to uncover high-quality companies that exhibit:
Capturing Dividend Yield
Contrary to popular belief, history has shown that lower dividend-yielding stocks (many with lower payment histories) have generated both, a higher total return and more favorable risk-adjusted returns than higher dividend-yielding stocks. Illustration 4 shows that the lower-yielding companies in Quartile 1-3 outperformed the highest-yielding companies in Quartile 5 - and with lower risk.
Often called the ‘dividend trap’, a high dividend yield might actually indicate a business in distress. The yield could be attributed to a drop in share price or management may pay dividends to its shareholders to compensate for its stagnant growth.
When investing for yield, quality, and stability of the underlying business matter most. BDIV diversifies across the dividend-paying spectrum with a lens for quality and sustainability. They seek to invest across all sectors in dividend-paying companies that exhibit:
Defendable competitive advantages
Healthy balance
sheet
Demonstrated earnings consistency
Potential for future sustainable earnings


Strong, consistent
risk-adjusted returns
1 / 3


Positive projected
growth rate
2 / 3
Healthy
balance sheet
3 / 3

Managing Beta
No matter how it is measured, a company’s risk profile is constantly changing. Exhibit 1 shows how a company with a lower beta (0.81) in 2016 was moving with greater sensitivity than the broader market in 2023 becoming a ‘high-beta company’ (1.17). This same phenomenon can happen to entire sectors as well.
BDIV analyzes valuation measures such as Price/Earnings, Price/Earnings Growth, Discounted Cash Flow Analysis, Beta, and Volatility across the sector peer groups in seeking to balance exposure across:
Sectors
Dividend growth rate
Dividend yield
Beta


BDIV Investment Process
While the potential long-term benefits of dividend-investing are evident, we believe a thoughtful, active approach is vital to accessing these benefits while balancing risk and reward. BDIV targets quality companies that are poised to increase their dividends in a manner that keeps their future growth intact.
KEY TAKEAWAY
Preliminary Screen
Determines investable universe. Starts with all U.S.-listed companies with a market cap of $3B+. A portfolio candidate list is derived after screening for minimum characteristics, qualitative review, and relative comparison.
Preliminary
Screen
Research &
Security Selection
Sell Discipline
Diversification &
Risk Management

Research & Security Selection
Using our portfolio candidate list, our research team follows a repeatable three-step process to select companies positioned for total return that have demonstrated operating consistency, attractive fundamentals, and reasonable valuations.
Sell Discipline
Continued research on holdings to identify factors contrary to original investment rationale in order to anticipate potential dividend cuts and/or deteriorating fundamentals.


BDIV seeks to provide a portfolio dividend growth rate greater than the S&P 500 Index.
OBJECTIVE:
BDIV seeks to provide a portfolio dividend growth rate greater than the S&P 500 Index.
OBJECTIVE:
BDIV seeks to provide a portfolio dividend growth rate greater than the S&P 500 Index.
Diversification & Risk Management
Brentview seeks to balance exposure across sectors, dividend growth rate, yield, and company beta.
Full sector diversification
Wide spectrum of dividend growth rates
Differing levels of beta
Representation varied dividend yields


Illustration 4: S&P 500 Stocks by dividend yield quartiles
Annual Returns
Sharpe ratio
max drawdown
Source: Ned Davis Research, 3/31/2026. Past performance does not guarantee future results.
Source: Ned Davis Research, 10 Years Ending12/31/2025. Past performance does not guarantee future results.
exhibit 1: Evolution of a company's beta
Source: FactSet | For illustrative purposes only. Performance data shown represents past performance nad does not predict or guarantee future results.

0.81 beta
1.17 beta

Past performance does not guarantee future results.
Don't be boxed in by your dividend growth strategy.


Highest Yielders
Payment History
Payout Ratio
Dividend Yield > X%
Minimum # of payment years


Click on each stage to learn more