DJIA: The Dow Jones Industrial Average is a price-weighted average of 30 actively traded blue-chip stocks. DJIA covers all industries with the exception of transportation and utilities.
S&P 500 Index: The S&P 500 Index is an unmanaged market capitalization-weighted index used to measure 500 companies chosen for market size, liquidity and industry grouping, among other factors.
Dividend-Paying vs. Non-Dividend-Paying Stocks: Each stock’s dividend policy is determined by its indicated annual dividend. Ned Davis Research classifies a stock as a dividend- paying stock if the company indicates that it is going to be paying a dividend within the year. A stock is classified as a non-payer if the stock’s indicated annual dividend is zero.
The index returns are calculated using monthly equal-weighted geometric averages of the total returns of all dividend-paying (or non-paying) stocks. A stock’s return is only included during the period it is a component of the S&P 500 Index. The dividend figure used to categorize the stock is the company’s indicated annual dividend, which may be different from the actual dividends paid in a particular month.Dividend-Growing, No-Change-In-Dividend, and Dividend-Cutting: Dividend Growers and Initiators include stocks that increased their dividend anytime in the last 12 months. Once an increase occurs, it remains classified as a Grower for 12 months or until another change in dividend policy. No-Change stocks are those that maintained their existing indicated annual dividend for the last 12 months (i.e., companies that have a static, non-zero dividend). Dividend Cutters and Eliminators are companies that have lowered or eliminated their dividend anytime in the last 12 months. Once a decrease occurs, it remains classified as a Cutter for 12 months or until another change in dividend policy.
You should carefully consider the investment objectives, potential risks, management fees, and charges and expenses of the Fund before investing. The Fund's prospectus and summary prospectus contains this and other information about the Fund, and should be read carefully before investing. You may obtain a current copy of the Fund's prospectus and summary prospectus by calling 888.966.9661.
This material is not intended to be a recommendation or investment advice, does not constitute a solicitation to buy or sell securities, and is not provided in a fiduciary capacity within the meaning of the Employee Retirement Income Security Act of 1974 (ERISA) and the Internal Revenue Code. The information provided does not take into account the specific objectives or circumstances of any particular investor, or suggest any specific course of action. Investment decisions should be made based on an investor’s objectives and circumstances and in consultation with his or her advisers.
Unless otherwise stated, all information and opinions were produced by sources we believe to be accurate and are subject to change. Additional information may be required to make an informed investment decision. AAM may make a market in or have other financial interests in any given security with which this analysis suggests may be benefited from its conclusions. AAM does not offer tax advice. Past performance does not guarantee future results. Any forward looking statements are not to be considered as forecasts but rather are presented for your consideration.
Not FDIC Insured. Not Bank Guaranteed. May Lose Value.
Distributed by IMST Distributors, LLC | (866) 966-9661 | www.aamlive.com
Advisors Asset Management, Inc. (AAM) is an SEC-registered investment advisor and member FINRA/SIPC.
The performance data quoted represents past performance and is not a guarantee of future results. It is not possible to investin an index.
Dividend Payment Risk: An issuer of a security may be unwilling or unable to pay income on a security. Common stocks do not assure dividend payments and are paid only when declared by an issuer’s board of directors. The amount of any dividend may vary over time.
An investment in the Fund is subject to risks and you could lose money on your investment in the Fund. The principal risks of investing in the Fund include, but are not limited to, investing in foreign securities, investing in small-and mid-cap companies, and focused risk. The prices of foreign securities may be more volatile than the securities of U.S. issuers because of economic conditions abroad, political developments, and changes in the regulatory environment of foreign countries. Investments in small and mid-cap companies involve greater risks including increased price volatility compared to the market or larger companies. Although the Fund is diversified, the Sub-advisor intends to focus its investments in the securities of a comparatively small number of issuers. Investment in securities of a limited number of issuers exposes the Fund to greater market risk and potential losses than if its assets were diversified among the securities of a greater number of issuers. More information about these risks may be found in the Fund’s prospectus.
1 Source: Ned Davis Research. The return of the price index is referred to as capital appreciation. Income return is assumed to be the Index’s total return minus its capital appreciation. Total Return = Capital appreciation plus reinvested dividends during the time period. Time period from stats above = 12/31/1929–3/31/2018
2 Source: Ned Davis Research. Based on equal-weighted geometric average of total returns (including dividends) of dividend-paying and non-dividend-paying historical S&P 500 Stocks. Uses Indicated Annual Dividends to identify dividend- paying stocks on a rolling 12-month basis.
[Source]
Definitions:
IMPORTANT INFORMATION:
Sources and Disclosures

Visit AAM
For more information on the Shenkman Capital Short Duration High Income Fund, visit us online or please complete the form below and we will be in touch shortly.

James E. Russell
Vice President
and Principal
Keith H. Rennekamp, CFA, CFP
Portfolio Manager
& Principal
Stephanie S. Thomas
Vice President
and Principal
Nicholas W. Puncer
Vice President
and Principal


4/4

Ellis D. Hummel, CFP
Portfolio Manager
& Principal, Board Director
John B. Schmitz, CFA
Portfolio Manager & Principal, Board
Director
Edward A. Woods, CFA
Portfolio Manager
& Principal, Board Director


2/4


Nicholas Sarchese, CFA, Senior Vice President; Co-Portfolio
Manager
Justin W. Slatky, Executive Vice President; Chief Investment Officer;
Co-Portfolio
Manager
Mark R. Shenkman, Founder, President;
Co-Portfolio Manager


1/4


Meet the investment team
Since its inception in 1985, Shenkman’s business has been dedicated to researching and investing across the entire capital structure of high yield companies. Given its size, we believe Shenkman is large enough to provide institutional size and scale from a pricing and access perspective, while remaining small enough to be selective with credits.
About SHENKMAN
Shenkman Website
Positioning for Rising Rates?
Presentation
Top 3 Reasons
Fact Card


Resources

Resources
Minimum Investment (Class I)
$1,000,000 initial/$100,000 subsequent
Minimum Investment (Class F/A/C)
$1,000 initial/$100 subsequent
Inception Date
October 31, 2012 (Classes A and I)
May 17, 2013 (Class F)
January 28, 2014 (Class C)
Investment Style
Short Duration High Yield
Benchmark
ICE BofA 0-2 Year Duration BB-B
US High Yield Constrained Index
Philosophy
Seeks a high level of current income while minimizing interest rate risk, avoiding credit events, and maximizing risk-adjusted returns.
Investment Objective
Seeks to generate a high level of current income.
Ticker Symbols
Fund Facts
Class F: SCFFX / Class A: SCFAX
Class C: SCFCX / Class I: SCFIX
Highlights
The Shenkman Capital Short Duration High Income Fund seeks a high level of current income by investing in a diversified portfolio of short duration high yield securities and bank loans.
Shenkman seeks to differentiate itself from many other high yield managers by considering potential risks first, as opposed to price and/or yield. The Fund employs the following Five Step Research Process:
• Rigorous in-depth credit analysis
• Direct communication with management
• Proprietary analytics
• Comprehensive financial models
• Trading analytics
Not only does this Fund make sense in a difficult environment, but we also believe it should be considered as a core allocation in any investor’s portfolio, potentially adding value in any market environment.
ABOUT THE SHENKMAN CAPITAL SHORT DURATION HIGH INCOME FUND


1, 2
Dividend-paying stocks declined, on average, roughly 10% less than non-dividend payers in bear markets (-12.8% vs -22.9%) from 1/31/1973 - 1/31/2023.


1
Dividends represented 100% of the S&P 500’s 2011 total return.


1
The 2000s (12/31/1999-12/31/2009) encompassed the bursting of the “technology-media-telecom” bubble as well as the beginning of the financial crisis. During this period, the index’s income return was positive, while its price and total return were both negative.


1
During the 1930s, which included the Great Depression, dividends represented 1,693% of the S&P 500’s total return.


1972 - 2018
2011
2000s
1930s

Historically, dividends have provided a cushion against volatility and market downturns with dividend-paying stocks tending to weather ups and downs better than non-dividend-payers.
Dividends can provide
a cushion during
market declines
2
Dividend-paying stocks averaged 2.1% higher return per year than non-dividend payers during bull markets.
Higher Yearly
%
2.1
1
The S&P 500’s annualized
return with dividends
reinvested – compared to
5.8% without dividends
Annual return
%
9.7
1
Amount of the S&P 500
Index’s total returns
driven by dividends
%
40.6

Dividend payments can provide a strong foundation for a stock’s total return, through bull and bear markets. Dividend payments have been crucial to the S&P 500’s total return:
Power of Compounding Interest
This highly repeatable process has been in place for over 30 years. The relative stability of the Fund’s net asset value illustrates Shenkman’s success at achieving these goals since the Fund’s inception.

aCHIEVEMENTS
The ability to pay a dividend is an important indicator to investors that the company has
a proven and sustainable business model.

RISK MANAGEMENT
Direct communication with company management.
ACCESS
Rigorous in-depth credit and liquidity analysis.

ANALYSIS
Shenkman focuses first and foremost on capital preservation and avoiding defaults, which they believe are the two key drivers of success in short duration high yield.
How does Shenkman seek to avoid defaults? They don’t rely on the ratings agencies, instead choosing to conduct their own rigorous analysis utilizing a consistent proprietary credit scoring process they call C.Scope®. The process is rules-based, extremely structured and detailed, and incorporates:
Preservation of Capital is Primary Focus
Potential Risk Reduction
Power of Compounding Interest
Preservation of Capital is Primary Focus
We believe the Shenkman Capital Short Duration High Income Fund can be an effective tool when seeking to generate income, diversify a portfolio, drive attractive risk-adjusted returns and/or manage cash.
Many investors think high yield and immediately think high risk. We disagree. High yield securities, particularly those with a short duration and at the higher end of the high yield spectrum (BB and B rated) can be an important component of a well-diversified fixed income allocation. Today especially, short duration high yield may help balance investors’ need for current income with the risk of interest rate and credit-driven price volatility.
Why SHORT DURATION HIGH YIELD?
See why
The Shenkman Capital Short Duration High Income Fund seeks to provide a high level of current income while minimizing interest rate risk, avoiding credit events, and maximizing risk-adjusted returns.


SHORT DURATION HIGH
INCOME
FUND
SHENKMAN
TICKER SYMBOLS CLASS F: SCFFX / CLASS A: SCFAX / CLASS C: SCFCX / CLASS I: SCFIX


The index returns are calculated using monthly equal-weighted geometric
Jordan N. Barrow, CFA, Senior Vice President; Co-Portfolio Manager & Research Analyst

Nicholas W. Puncer, CFA, CFP
Portfolio Manager & Principal, Managing Director, Institutional
Visit AAM
12/31/1929 - 6/30/2020
12/31/1929 - 6/30/2020


3/4

Christopher M. Rowane, CFA
Portfolio Manager
& Principal
W. Jeff Bahl
Portfolio Manager & Principal, Board
Director


1973 - 1/31/2023
1 The Shenkman Group of Companies (Shenkman) consists of Shenkman Capital Management, Inc., and its affiliates and subsidiaries, including, without limitation, Shenkman Capital Management Ltd, Romark Credit Advisors LP, and Romark CLO Advisors LLC. The Shenkman Group focuses on the leveraged finance market and is dedicated to providing in-depth, bottom-up, fundamental credit analysis.
Mutual fund investing involves risk. Principal loss is possible. There can be no assurance that the Fund will achieve its stated objectives. In addition to the normal risks associated with investing, bonds, bank loans and the funds that invest in them are subject to interest rate risk and can be expected to decline in value as interest rates rise. Investment by the Fund in lower-rated and non-rated securities presents a greater risk of loss to principal and interest than higher-rated securities. The Fund may invest in foreign securities that involve political, economic and currency risks, greater volatility, and differences in accounting methods. Derivatives may involve certain costs and risks such as liquidity, interest rate, market, credit, management, and the risk that a position could not be closed when most advantageous. Leverage may cause the effect of an increase or decrease in the value of the portfolio securities to be magnified and the fund to be more volatile than if leverage was not used. Diversification does not guarantee a profit or protect from a loss in a declining market. The SEC does not endorse, indemnify, approve nor disapprove of any security.
References to indices are for information purposes only. The Shenkman Group believes that any indices discussed herein are broad market indices and are indicative of the type of investments that the Shenkman Group may purchase but may contain different securities than those held in the Shenkman Group portfolios managed pursuant to the strategies described herein. The indices have not been selected to represent an appropriate benchmark. The strategies referred to herein are not designed to mimic the investments on which any index is based. The indices are unmanaged and not available for direct investment and do not reflect deductions for fees or expenses.
Links to third-party website and materials are included as a convenience to the user. AAM assumes no responsibility for the content of the linked materials. The fact that such link exists does not indicate approval or endorsement of any linked content.
Important Disclosures
The Fund’s investment objectives, risks, charges and expenses must be considered carefully before investing. The statutory and summary prospectuses contain this and other important information about the Fund and may be obtained by calling 1-855-SHENKMAN (1-855-743-6562). Read carefully before investing.
Bond credit spreads refer to the difference in yield between a US Treasury bond and another debt security of the same maturity but different credit quality. Credit spreads are often used as a barometer of economic health; widening is viewed as “bad” and narrowing is viewed as “good.”
Bond ratings are grades given to bonds that indicate their credit quality as determined by a private independent rating services which evaluates a bond issuer’s financial strength, or its ability to pay a bond’s principal and interest in a timely fashion. Ratings are expressed as letters: AAA, AA, A, and BBB are investment grade ratings; BB, B, CCC/CC/C and D are below-investment grade ratings. US Government or agency securities are generally considered to be of the highest quality. In limited situations when the rating agency has not issued a formal rating, the rating agency will classify the security as non-rated.
The ICE BofA 0-2 Year Duration BB-B US High Yield Constrained Index (H42C) consists of all securities in the ICE BofA BB-B US High Yield Index (HUC4) that have a duration-to-worst of 2 years or less. The HUC4 index is a subset of the ICE BofA US High Yield Index (H0A0) that includes all securities in the H0A0 rated BB1 through B3, inclusive. The HUC4 index is unmanaged, not available for direct investment and does not reflect deductions for fees or expenses.
The Bloomberg US Aggregate Bond Index is widely used to represent performance and characteristics of the investment grade corporate bond market. It is an unmanaged, broad based index composed of US dollar denominated, investment grade, fixed-rate taxable bonds with at least $250 million par amount outstanding and at least one year to final maturity.
Bloomberg 7-10 Year US Treasury Index is an unmanaged, market capitalization weighted index of all Treasuries in the Bloomberg US Aggregate Bond Index with a maturity of 7-10 years.
©2026 Advisors Asset Management, Inc. All rights reserved. The Shenkman Capital Short Duration High Income Fund is distributed by Quasar Distributors, LLC, which is not affiliated with Shenkman Capital Management, Inc. AAM acts as the third-party marketing agent for the Shenkman Capital Short Duration High Income Fund.
18925 Base Camp | Monument, CO 80132 | www.aamlive.com
CRN: 2025-0224-12348 R Link 10713
Definitions

Scott D. Rodes, CFA
Portfolio Manager
& Principal
Neil Wechsler, CFA, Senior Vice President; Co-Portfolio
Manager

Stephanie S. Thomas, CFA
Portfolio Manager & Principal, Managing Director, Institutional

Peter M. Kwiatkowski, CFA
Portfolio Manager
& Principal, CIO

James Russell, Jr.
Portfolio Manager
& Principal

J. Eric Strange, CFA
Portfolio Manager
& Principal


30

Preservation of Capital is Primary Focus
What is a bond ladder?
TAX-EXEMPT INCOME
Inflation:
Remains Above the Trend
In short, we expect inflation could remain
above-trend, possibly still as high as 4.5%+/- by
year-end 2023. Why is that? Simply put, the Fed can only destroy demand, it can’t solve some of the more pernicious drivers of inflation. For example, the Fed cannot drill for oil, grow food, increase supply chains, or stop deglobalization. Wages are another challenge that could lead to sticky inflation with gains north of 5% and broadening across many industries as the labor shortage could be very difficult to overcome given growing unionization, job hoarding, long-COVID, early retirees and aging demographics.
Importantly, history also shows that once inflation gets going, even if it is declining, it can remain above-trend for years (four years on average).
Source: Federal Reserve Economic Data (FRED), Haver Analytics, CEA Calculation
6 Episodes of Post-WWII Inflation
% change year over year


Click to Close


33.0
3.5
Germany
21.0
2.2
Japan
14.6
1.4
France
14.5
1.5
United Kingdom
12.1
4.9
United States
11.8
2.8
Canada
10.0
1.2
India
8.6
2.9
South Africa
5.5
0.6
Brazil
COVID-19 crisis
2008 financial crisis
2

Interest Rates
Move Higher
Enhanced Bond Ladder
Potential Risk
Reduction
Recession:
Likely in 2023
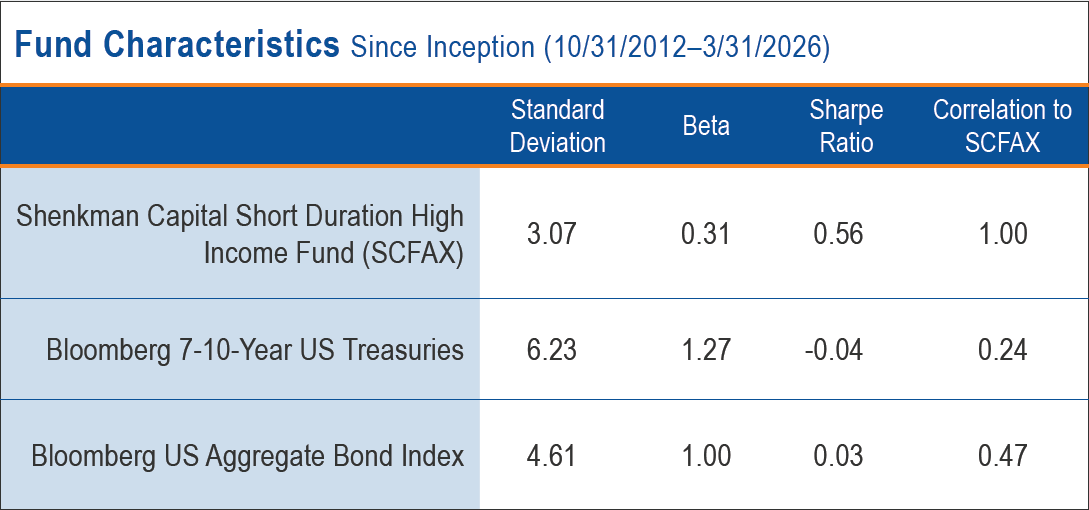
Acting as a diversifier, the Shenkman Capital Short Duration High Income �Fund’s low correlation to the broad �fixed income market and US Treasuries indicates that an allocation has the potential to reduce risk in the fixed �income segment of your overall portfolio.
Power of Compounding Interest
Potential Risk Reduction
Preservation of
Capital is Shenkman's Primary Focus
Shenkman focuses first and foremost on capital preservation and avoiding defaults, which they believe are the two key drivers of success in short duration high yield.
How does Shenkman seek to avoid defaults? They don’t rely on the ratings agencies, instead choosing to conduct their own rigorous analysis utilizing a consistent proprietary credit scoring process they call C.Scope®. The process is rules-based, extremely structured and detailed, and incorporates:
ANALYSIS
Rigorous in-depth credit and liquidity analysis.
ACCESS
Direct communication with company management.
COMPREHENSIVE RISK MANAGEMENT
Innovative credit risk analytics that can help to outperform in difficult and uncertain markets.
aCHIEVEMENTS
30
This highly repeatable process has been in place for over 30 years. The relative stability of the Fund’s net asset value illustrates Shenkman’s success at achieving these goals since the Fund’s inception.
Preservation of Capital is Primary Focus
Shenkman focuses first and foremost on capital preservation and avoiding defaults, which they believe are the two key drivers of success in short duration high yield.
How does Shenkman seek to avoid defaults? They don’t rely on the ratings agencies, instead choosing to conduct their own rigorous analysis utilizing a consistent proprietary credit scoring process they call C.Scope®. The process is rules-based, extremely structured and detailed, and incorporates:
ANALYSIS
Rigorous in-depth credit and liquidity analysis.
ACCESS
Direct communication with company management.
RISK MANAGEMENT
The ability to pay a dividend is an important indicator to investors that the company has
a proven and sustainable business model.
aCHIEVEMENTS
30
This highly repeatable process has been in place for over 30 years. The relative stability of the Fund’s net asset value illustrates Shenkman’s success at achieving these goals since the Fund’s inception.
Explore 3 Main Reasons to Invest in the Shenkman Capital Short Duration High Income Fund
Preservation of Capital is Primary Focus
Preservation of
Capital is Shenkman's Primary Focus
Power of Compounding Interest
Albert Einstein is widely credited with saying, “The most powerful force in the universe is compound interest.” We agree with this sentiment, whether Einstein actually said it or not. To harness this power, an investor needs only three things:


The longer, the better.


1/3
TIME


2/3
The higher, the better, but one must always consider the risk of loss compared to the return potential.*


3/3
Even a small amount of capital can turn into something big, given a long enough horizon.


RETURN ON INVESTMENT
CAPITAL

Source: Morningstar. Past performance does not guarantee future results.
Beta is a measure of the volatility, or systematic risk, of a security or a portfolio in comparison to the market as a whole. A beta of 1 indicates that the security’s price moves with the market. A beta of less than 1 means that the security is theoretically less volatile than the market. A beta of greater than 1 indicates that the security’s price is theoretically more volatile than the market. Correlation is a statistical measure of how two variables move in relation to each other with coefficients ranging from +1 to -1. A correlation coefficient of +1 implies that as one variable moves, the other will move in the same direction in exact lockstep. Alternatively, a correlation coefficient of -1 implies that if one variable moves, the other moves in the same amount in the opposite direction. If the correlation is 0, the movements of the variables are completely independent of each other. As interest rates increase, bond prices generally decline. A fund with a low or negative correlation to US Treasuries should not move in tandem with or may even potentially move higher if US Treasury prices decline. Correlations vary over time. Sharpe Ratio is a measure for calculating risk-adjusted returns. The Sharpe ratio is the average return earned in excess of the risk-free rate per unit of volatility or total risk. The higher the Sharpe ratio, the better the risk-adjusted performance has been. Standard deviation is a statistical measurement that sheds light on historical volatility by measuring the dispersion of a set of data from its mean. The higher the standard deviation, the higher the deviation within the data set. Standard deviation is calculated as the square root of variance by determining the variation between each data point relative to the mean.
Shenkman focuses first and foremost on capital preservation and avoiding defaults, which in the firm’s opinion are the two key drivers of success in short duration high yield.
PHILOSOPHY
PRESENCE
Direct communication with company management.
DEPTH OF RESEARCH TEAM
The ability to pay a dividend is an important indicator to investors that the company has
a proven and sustainable business model.
RISK MANAGEMENT
30
This highly repeatable process has been in place for over 30 years. The relative stability of the Fund’s net asset value illustrates Shenkman’s success at achieving these goals since the Fund’s inception.
Figures illustrate the ending value of a hypothetical investment. An investment may be worth more or less than the initial principal investment at sale. Actual returns will vary over time and may not always be positive. The amounts shown above are hypothetical and do not relate to the Shenkman Capital Short Duration High Income Fund or any AAM product and are for illustrative purposes only.

If you are...
...BEARISH
The Shenkman Capital Short Duration High Income Fund has historically helped mitigate both equity market volatility and increasing credit spreads when included as part of a diversified portfolio.
...BULLISH


Highlights of the Fund's Investment Approach


1/4
Shenkman focuses first and foremost on capital preservation and avoiding defaults, which in the firm’s opinion are the two key drivers of success in short duration high yield.


2/4


3/4


4/4
...UNCERTAIN
The current yield is attractive, and we anticipate the Fund could capture some upside returns if the markets rally, as it has often done historically.
Given the Fund’s focus on avoiding credit defaults and clipping the coupon, we believe the Fund is well positioned to weather many of the potential pitfalls impacting sentiment (high inflation, possible recession, credit risk, and further interest rate risk, to name a few).
SHENKMAN ADVANTAGES

PHILOSOPHY
Shenkman combines the potential advantages of a $30.5 billion high yield platform with the nimbleness of a
$7.8 billion short duration strategy.
PRESENCE

Shenkman’s 21-member credit research team is organized by sector with each analyst responsible for the entire capital structure and maturity spectrum.
depth of
research team

Innovative credit risk analytics that can help to outperform in difficult and uncertain markets.
risk management

Fund Advisor
Shenkman Group of Companies (i.e. Shenkman)
1
Represented by:
*Although fixed income investments are generally thought to be “less risky” than equities, not all fixed income investments are created equal, particularly within the high yield arena. Therefore, we believe that the ability to effectively manage a high yield fund depends significantly on the manager’s ability to conduct strong bottom-up research.

Visit Website
Shenkman capital
Source: Yahoo Finance. Past performance does not guarantee future results. View the fact card for standardized performance for all share classes of the Shenkman Capital Short Duration High Income Fund.