M&A has a bigger role in building products
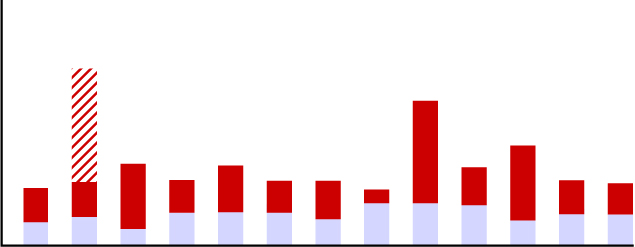
North America has seen larger deals in recent years
North America construction and building products deal value ($B)
North America
North America
Europe, the Middle East, and Africa
Europe, the Middle East, and Africa
Asia-Pacific
Asia-Pacific


$12B
21
20
16
29
41
21
38
46
31
66
21
32
25
46
18
21
21
26
21
26
56
$18B
30
25
49
63
23
36
19
25
28
19
21
$14B
23
22
21
20
19
18
17
16
15
14
13
55
42
52
60
34
35
58
42
40
36
37
29
Deal count
60
65
64
57
38
49
48
50
55
45
55
52
97
86
108
108
89
93
98
100
125
87
78
76
Average deal value per year
Average deal count per year
2010–17
2018–25
$16B
$42B
2018–25
50
$24B
$25B
55
$21B
$35B
98
Frequent M&A boosts shareholder returns
Building products companies that regularly acquire others outperform their less active competitors
Global CAGR 2012–22
Annual total shareholder returns for building products companies
Serial bolt-ons
Selective fill-ins
Mountain climbers
Selective large bets
Average more than one deal per year
Average less than one deal per year
Acquisition frequency
Less than 50% of buyer‘s market cap
More than 50% of buyer‘s market cap
Relative deal value
9.1%
9.6%
5.3%
6.5%
The industry has three main inherent challenges
But M&A in building products is hard
Concentrated product categories
Limited synergies across product categories
Highly local market dynamics with few geographic synergies
Economic uncertainty is creating opportunity; a robust capability delivers outsized returns
Leaders make M&A a differentiating skill
Prioritize opportunities (core vs. adjacency) and method (organic vs. M&A) for a growth strategy
Articulate and support goals with the right talent, tech, and management systems
Build a screening and sourcing framework to assess and target priority companies
60
40
20
0


Notes: Only includes deals with disclosed values over $50 million; North America 2018–24 average deal value excludes Home Depot–SRS and Quikrete–Summit Materials deals; Europe, the Middle East, and Africa 2010–17 average deal value excludes Holcim–Lafarge deal. Sources: Dealogic; analyst reports; Bain M&A database 2023 (N=2,533)
60
24
72
20
57
39
104
Choose a region


80


25
19

Corporate M&A
Financial sponsor
Europe, the Middle East, and Africa construction and building products deal value ($B)
Corporate M&A has declined substantially in Europe, the Middle East, and Africa since 2023
Holcim & Lafarge
merger: ~$36B
Holcim-Lafarge: around $36B

Asia-Pacific construction and building products deal value ($B)
Since 2023, activity picked up in Asia-Pacific, due to financial sponsors