Sources: US Census Bureau; US Bureau of Labor Statistics
1.8M
673K
500K
0
1M
2M
1.5M
'17
'10
'00
'90
'80
'70
'60
'50
Note: 2017 is an estimate.

Population of Detroit, 1950–2017
1.4%
0.3%
5.6%
0.5%
1.8%
7.5%
13.6%
55.5%
43.7%
79.7%
White
Black
Hispanic/Latino
Other/mixed
Asian
0
20%
40%
60%
100%
80%
'17
'10
'00
'90
'80
'70
Percent race breakdown of Detroit, 1950–2017
Note: 2017 is an estimate. Other/mixed data not included for 2017.

5%
9.2%
0
5%
10%
15%
20%
'18
'14
'10
'06
'02
'98
'94
'90
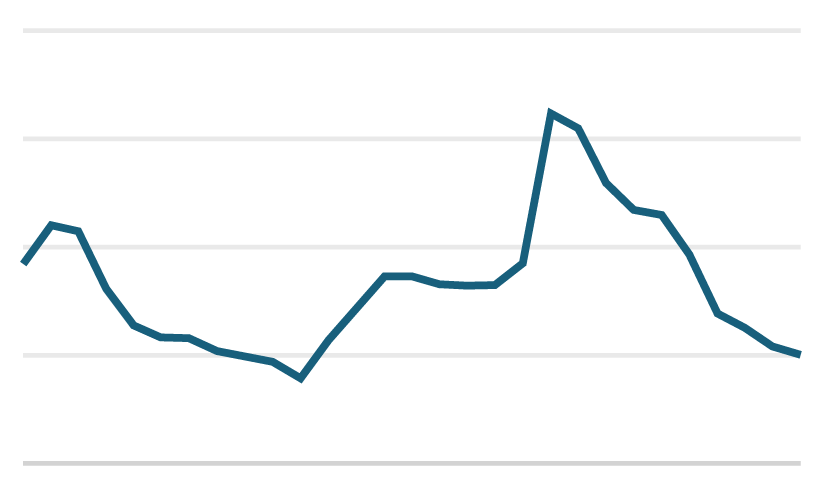
Average unemployment rate in Detroit, 1950–2017
Note: 2018 average as of May.
