Land values:
the national view
Average arable land values in England and Wales increased marginally in the third quarter. On an annual basis, growth has accelerated. Longer-term growth is driven by a low level of new supply by historical standards, a rise in alternative buyers, and the presence of rollover funds.
While both smaller and larger blocks are in high demand, some segments are becoming more price-sensitive due to increased borrowing costs and Budget uncertainty.
The economy has significantly improved, with inflation falling sharply and interest rates decreasing. This positive trend is expected to boost the housing market (with important implication for those purchasing land with residential assets), improve cash flow for those with existing debt, and expand the pool of potential buyers.
£9,722
per acre
Average arable land value in Q3
from
Q2 2024
+0.6%
+2.2%


from
Q3 2023
£7,889
per acre
from
Q2 2024
+0.7%
+2.7%
from
Q3 2023


Farmland
Market Update
The farmland market in England and Wales has continued its upward trajectory. Supply is broadly meeting demand, with buyers finding a range of opportunities in land, including commercial farming, environmental gains and leisure. The upcoming Budget has created some hesitancy, but increased clarity should boost market sentiment.

“Land value growth has not entered negative
territory in over three years.”
FIGURE 5
Commodity prices
Source: Carter Jonas, AHDB, Farmers Weekly, Defra, ONS, OPEC
Input
Outputs


CRUDE OIL
Unit
Latest data
Date
Quarterly change
Annual change
£/barrel
55.7
Sept' 24
-15%
-27.0%
Fertiliser
Unit
Latest data
Date
Quarterly change
Annual change
£/tonne
330.6
Sept' 24
0.3%
-8.8%
Red Diesel
Unit
Latest data
Date
Quarterly change
Annual change
pence/litres
75.1
Sept' 24
-9.2%
-15.8%
Feed Wheat
Unit
Latest data
Date
Quarterly change
Annual change
£/tonne
191.6
Sept' 24
-6.0%
0.0%
oilseed rape
Unit
Latest data
Date
Quarterly change
Annual change
£/tonne
398.4
Sept' 24
0.0%
6.0%
MILK
Unit
Latest data
Date
Quarterly change
Annual change
pence/litre
41.1
Aug' 24
8.0%
13.4%
BEEF
Unit
Latest data
Date
Quarterly change
Annual change
pence/kg dw
505.5
Sept' 24
5.8%
6.2%
Pork
Unit
Latest data
Date
Quarterly change
Annual change
pence/kg dw
208.4
Sept' 24
-0.3%
-4.9%


Click a location for
a local overview


East of England
Arable
Pasture
£8,000
£7,000
£11,500
£9,500
£9,750
£8,000
2.6%
3.2%
9.6%
12.7%
Low
£ / acre
Prime
£ / acre
Average
£ / acre
Quarterly %
Annual %
East of England land values
North West
Arable
Low
£ / acre
Prime
£ / acre
£ / acre
Quarterly %
Annual %
Average
£8,000
£6,500
£12,000
£10,000
£10,000
£8,000
0.0%
0.0%
0.0%
0.0%
Pasture
North West land values
Wales
Arable
Low
£ / acre
Prime
£ / acre
£ / acre
Quarterly %
Annual %
Average
£8,250
£4,250
£10,000
£10,000
£8,500
£6,500
0.0%
0.0%
0.0%
0.0%
Pasture
EMAIL Hugh
01248 360417
Partner
Hugh O’Donnell

Wales land values

North East
Arable
Low
£ / acre
Prime
£ / acre
£ / acre
Quarterly %
Annual %
Average
£6,500
£4,250
£8,750
£6,500
£7,500
£5,750
0.0%
0.0%
0.0%
0.0%
Pasture
EMAIL Sam
01423 707801
Associate Partner
Sam Johnson

North East land values

Yorkshire and the Humber
Arable
Low
£ / acre
Prime
£ / acre
£ / acre
Quarterly %
Annual %
Average
£8,000
£5,500
£11,000
£7,250
£9,000
£7,000
0.0%
0.0%
0.0%
0.0%
Pasture
EMAIL Sam
01423 707801
Associate Partner
Sam Johnson


Yorkshire and the
Humber land values
East Midlands
Arable
Low
£ / acre
Prime
£ / acre
£ / acre
Quarterly %
Annual %
Average
£8,250
£7,250
£11,250
£9,250
£9,500
£8,250
2.7%
3.1%
5.6%
5.8%
Pasture
East Midlands land values
West Midlands
Arable
Low
£ / acre
Prime
£ / acre
£ / acre
Quarterly %
Annual %
Average
£9,500
£7,000
£14,000
£12,000
£11,500
0.0%
0.0%
4.5%
5.6%
Pasture
EMAIL EDWARD
0121 3060386
Associate Partner
Edward Beale

West Midlands land values
South East
Arable
Low
£ / acre
Prime
£ / acre
£ / acre
Quarterly %
Annual %
Average
£9,250
£8,000
£12,250
£9,500
£10,750
£9,000
0.0%
0.0%
0.0%
0.0%
Pasture
EMAIL Andrew
07880 084633
Partner
Andrew Chandler


Wales

West Midlands

East Midlands

South west

South east

East of england

Yorkshire & the humber

North east

North west
Get in touch
Hover over a trend for more info


South West
Arable
Low
£ / acre
Prime
£ / acre
£ / acre
Quarterly %
Annual %
Average
£10,000
£7,000
£12,000
£11,000
£11,000
£9,000
0.0%
0.0%
0.0%
0.0%
Pasture
EMAIL David

01823 428591
Partner
David Hebditch

South West land values
EMAIL Andrew
07880 084633
Head of Rural Agency
Andrew Chandler

Some buyers and sellers have sped up their purchases ahead of the Budget, but new launches have slowed (when compared to this time last year) in anticipation of upcoming tax changes. Coupled with the typical seasonal slowdown in launches, we can now expect a reduction in supply until the spring.
Although the industry still awaits specifics on the policy direction of the new government, the uptake of agri-environment schemes is gaining momentum. This is increasingly important for farmers looking to improve their profitability.
Supply and
demand
Commodity price trends


£1,000
£2,250
£1,700
0.0%
0.0%
Hill
£500
£1,500
£1,000
0.0%
0.0%
Hill
£1,800
£2,900
£2,250
0.0%
0.0%
Hill
£11,000
£14,000
£12,500
0.0%
0.0%
Lifestyle
£1,800
£3,850
£2,750
0.0%
0.0%
Hill
£10,750
£15,750
£13,250
0.0%
0.0%
Lifestyle
£11,000
£13,000
£12,000
0.0%
0.0%
Yorkshire Wolds
£13,250
£25,000
£16,750
0.0%
0.0%
Lifestyle
£9,500
£15,500
£11,500
4.5%
15.0%
Silts and Fen
£25,000
£16,000
0.0%
0.0%
Lifestyle
£13,500
£25,000
£17,000
0.0%
1.5%
Lifestyle
£9,500
£15,500
£11,500
4.5%
15.0%
Silts and Fen
£16,000
£35,000
£22,500
0.0%
0.0%
Lifestyle
SHEEP
Unit
Latest data
Date
Quarterly change
Annual change
pence/kg dw
644.7
Sept' 24
-17.6%
17.3%
CHICKEN
Unit
Latest data
Date
Quarterly change
Annual change
pence/kg dw
384.0
Aug' 24
2.1%
0.8%
EMAIL SOPHIE
020 7493 0685
Research Associate
Sophie Davidson


FIGURE 2: Annualised Growth of Average Land Values in England and Wales
FIGURE 1: Average Land Values in England and Wales
South East land values
FIGURE 4: Cumulative publicly marketed farmland supply
FIGURE 3: Year-to-date publicly marketed farmland supply
£12,500
£9,500


Carter Jonas continues to monitor the changing nature of the farmland market and the influences on land values in England and Wales.
Please note that values vary depending on the quality of the land and local dynamics, among many other factors. Speak to your regional expert (at the bottom of this page) for location-specific advice.
Land values:
the regional view


Q3 2024
Download the full report

Download the full report

Download the full report

Download the full report

For more commentary, download the full report as a PDF.
For more commentary, download the full report as a PDF.
Download the full report

For more commentary, download the full report as a PDF.
Average pasture land value in Q3
Explore the report
Land values: the national view | Land values: the regional view
Supply and demand | Commodity prices


For more commentary, download the full report as a PDF.

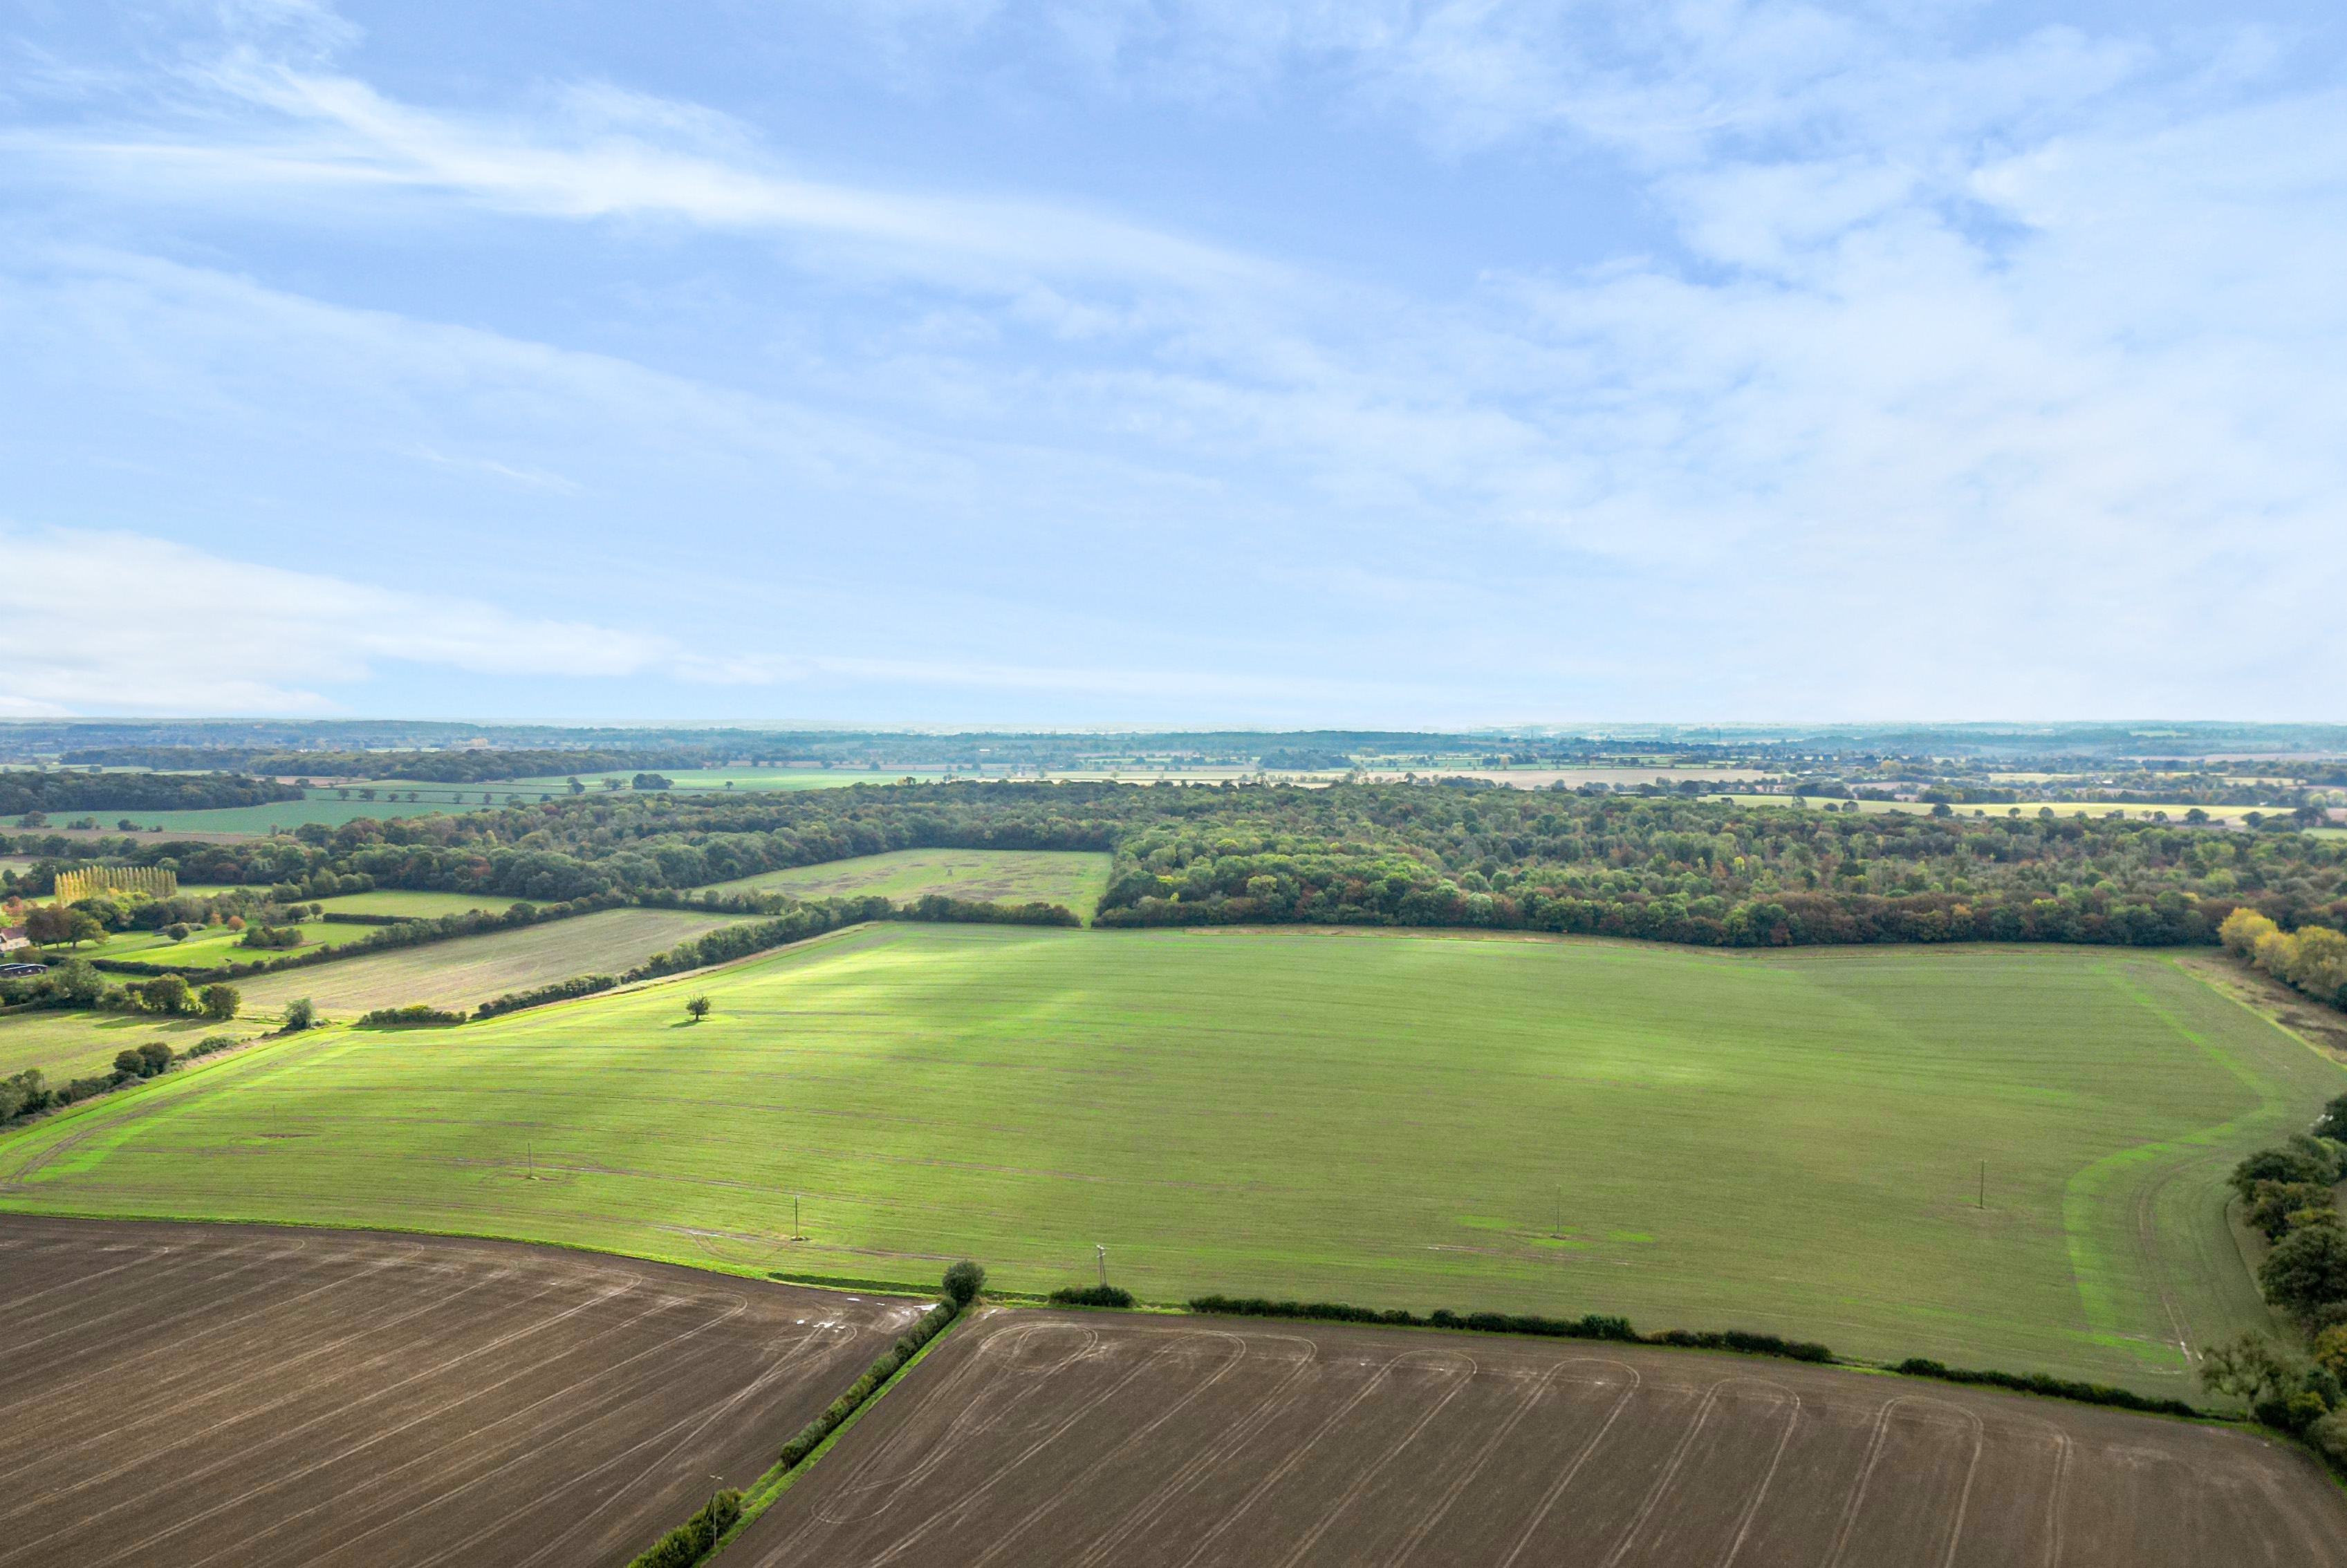
Ruses Farm & Hempstead Hall Farm, Hempstead CB10 / 392.4 acres / For sale


EMAIL Sam
01423 707801
Associate Partner
Sam Johnson


EMAIL Jamie
01223 346592
Senior Surveyor
Jamie Elbourn


EMAIL Jamie
01223 346592
Senior Surveyor
Jamie Elbourn


Overview and spotlight on the East
Ruses Farm & Hempstead Hall Farm, Hempstead CB10 / 392.4 acres / Under offer

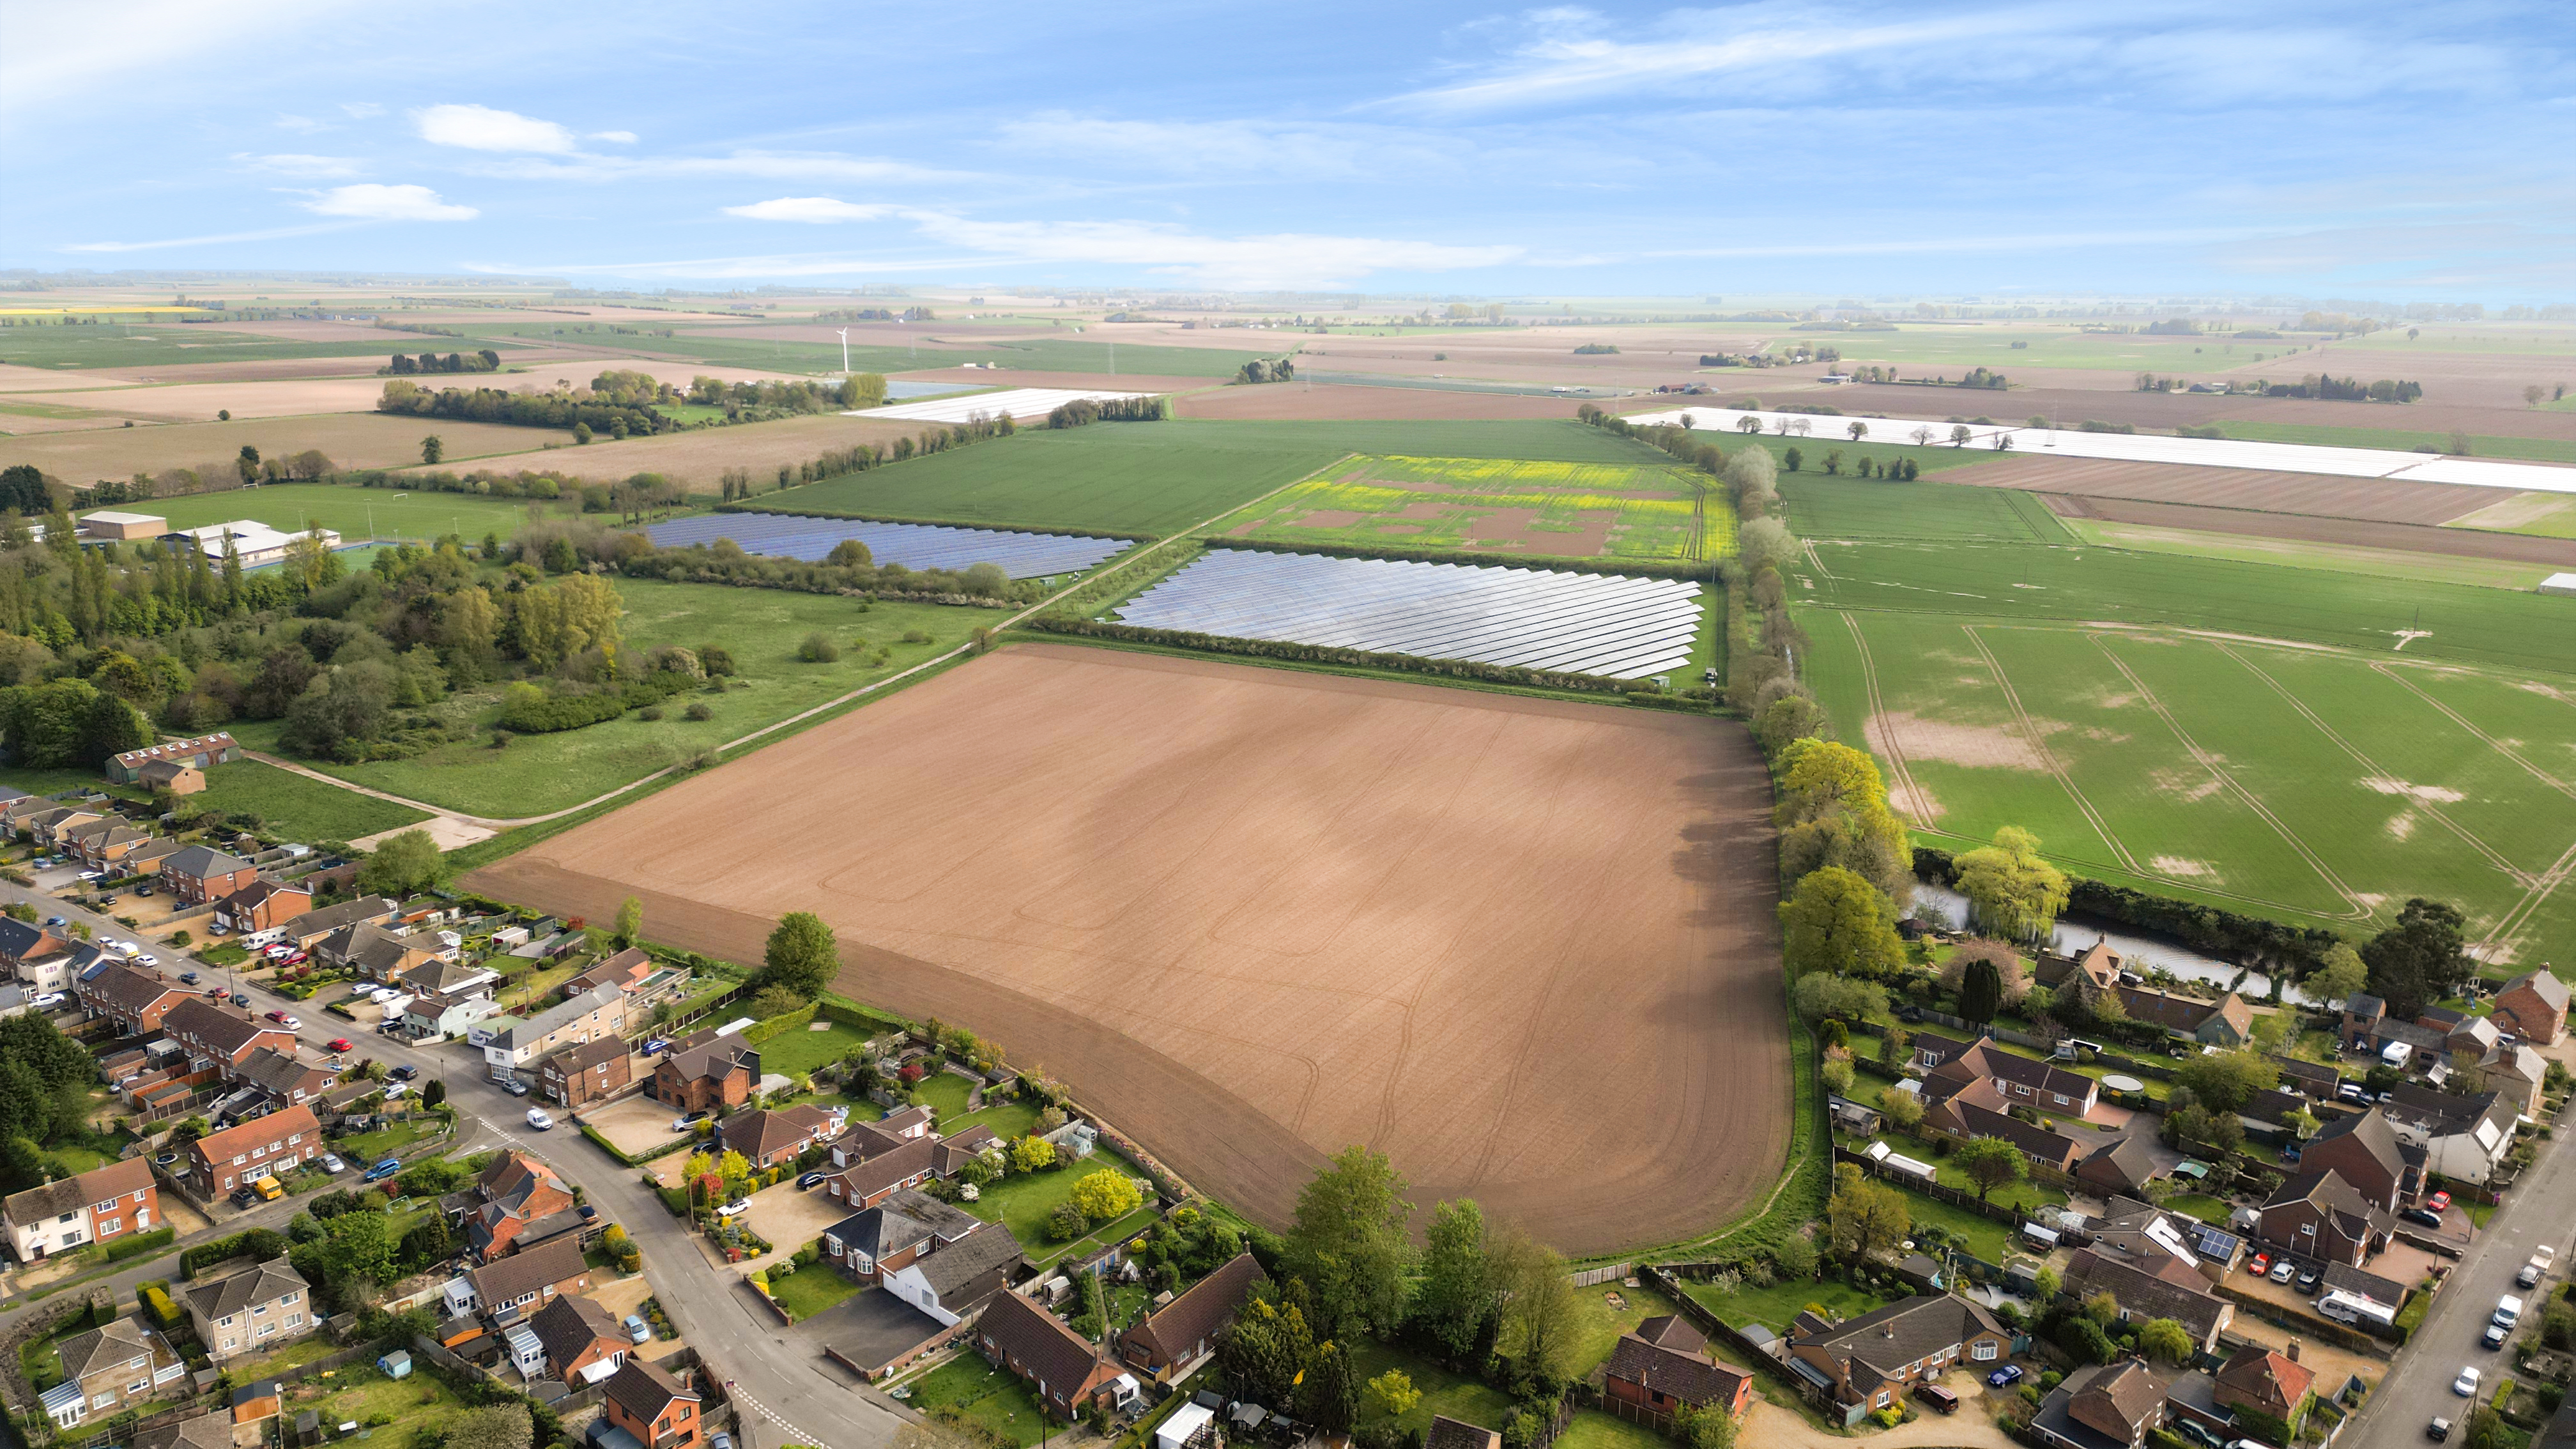
Hall Marsh Farm, Long Sutton PE12 / 131 acres / Sold
Source: Carter Jonas
Source: Carter Jonas
Source: Farmers Weekly
Source: Farmers Weekly
Download the full report


+2.7%
from
Q3 2023


+0.7%
from
Q2 2024
per acre
£7,889

+2.2%
from
Q3 2023


+0.6%
from
Q2 2024
Average pasture land value in Q3
per acre
£9,722
Average arable land value in Q3
Land values:
the national view
Average arable land values in England and Wales increased marginally in the third quarter. On an annual basis, growth has accelerated. Longer-term growth is driven by a low level of new supply by historical standards, a rise in alternative buyers, and the presence of rollover funds.
While both smaller and larger blocks are in high demand, some segments are becoming more price-sensitive due to increased borrowing costs and Budget uncertainty.
The economy has significantly improved, with inflation falling sharply and interest rates decreasing. This positive trend is expected to boost the housing market (with important implication for those purchasing land with residential assets), improve cash flow for those with existing debt, and expand the pool of potential buyers.


Download the full report

For more commentary, download the full report as a PDF.
Land values:
the regional view


Click a location for
a local overview


WEST MIDLANDS

NORTH EAST

SOUTH WEST

WALES

NORTH WEST

YORKSHIRE & HUMBER

EAST MIDLANDS

EAST OF ENGLAND

SOUTH EAST
East of England land values

EMAIL Jamie
01223 346592
Senior Surveyor
Jamie Elbourn

CLOSE

View on desktop for a full overview
EMAIL Sam
01423 707801
Associate Partner
Sam Johnson


North West land values

CLOSE

View on desktop for a full overview
EMAIL Hugh

01248 360417
Partner
Hugh O’Donnell

Wales land values

CLOSE

View on desktop for a full overview
CLOSE

View on desktop for a full overview

EMAIL David
01823 428591
Partner
David Hebditch

South West land values

EMAIL Sam
01423 707801
Associate Partner
Sam Johnson


North East land values

CLOSE

View on desktop for a full overview
EMAIL Sam
01423 707801
Associate Partner
Sam Johnson


Yorkshire and the
Humber land values

CLOSE

View on desktop for a full overview
East Midlands land values

CLOSE

View on desktop for a full overview
EMAIL Jamie
01223 346592
Senior Surveyor
Jamie Elbourn


EMAIL EDWARD
0121 3060386
Associate Partner
Edward Beale

West Midlands land values

CLOSE

View on desktop for a full overview
EMAIL Andrew
07880 084633
Partner
Andrew Chandler


View on desktop for a full overview
South East land values

CLOSE

Download the full report

For more commentary, download the full report as a PDF.
Supply and
demand
FIGURE 4: Cumulative publicly marketed farmland supply

FIGURE 3: Year-to-date publicly marketed farmland supply

Source: Farmers Weekly
Source: Farmers Weekly
Some buyers and sellers have sped up their purchases ahead of the Budget, but new launches have slowed (when compared to this time last year) in anticipation of upcoming tax changes. Coupled with the typical seasonal slowdown in launches, we can now expect a reduction in supply until the spring.
Although the industry still awaits specifics on the policy direction of the new government, the uptake of agri-environment schemes is gaining momentum. This is increasingly important for farmers looking to improve their profitability.
Download the full report

For more commentary, download the full report as a PDF.
Source: Carter Jonas, AHDB, Farmers Weekly, Defra, ONS, OPEC
Commodity price trends
Click a trend for more info
FIGURE 5
Commodity prices
Inputs
Outputs


Crude Oil
Fertiliser
Red Diesel
Milk
Beef
Feed Wheat
Oilseed Rape
Pork
Sheep
Chicken
CRUDE OIL
Unit
Latest data
Date
Quarterly change
Annual change
£/barrel
55.7
Sept' 24
-15.0%
-27.0%

Fertiliser
Unit
Latest data
Date
Quarterly change
Annual change
£/tonne
330.6
Sept' 24
0.3%
-8.8%

Red Diesel
Unit
Latest data
Date
Quarterly change
Annual change
pence/litres
75.1
Sept' 24
-9.2%
-15.8%

Feed Wheat
Unit
Latest data
Date
Quarterly change
Annual change
£/tonne
191.6
Sept' 24
-6.0%
0.0%

oilseed rape
Unit
Latest data
Date
Quarterly change
Annual change
£/tonne
398.4
Sept' 24
0.0%
6.0%

MILK
Unit
Latest data
Date
Quarterly change
Annual change
pence/litre
41.1
Aug' 24
8.0%
13.4%

BEEF
Unit
Latest data
Date
Quarterly change
Annual change
pence/kg dw
505.5
Sept' 24
5.8%
6.2%

Pork
Unit
Latest data
Date
Quarterly change
Annual change
pence/kg dw
208.4
Sept' 24
-0.3%
-4.9%

SHEEP
Unit
Latest data
Date
Quarterly change
Annual change
pence/kg dw
644.7
Sept' 24
-17.6%
17.3%

CHICKEN
Unit
Latest data
Date
Quarterly change
Annual change
pence/kg dw
384.0
Aug' 24
2.1%
0.8%

Download the full report

For more commentary, download the full report as a PDF.
EMAIL Andrew

07880 084633
Head of Rural Agency
Andrew Chandler
Get in touch
EMAIL SOPHIE
020 7493 0685
Research Associate
Sophie Davidson


