Land values:
the national view
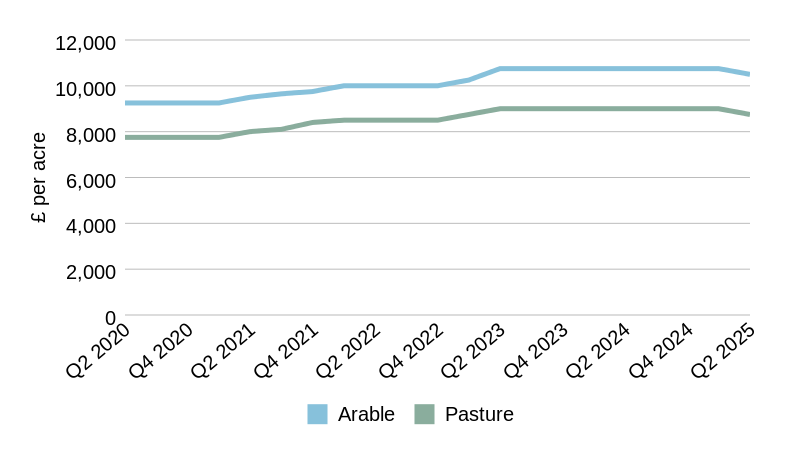
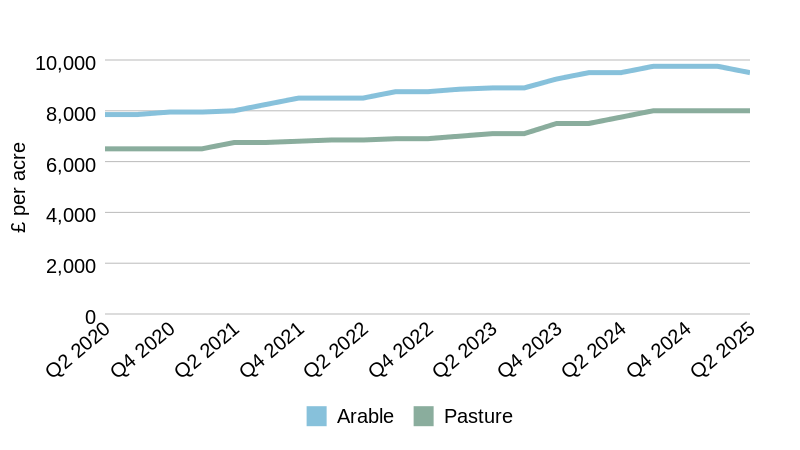
Farmland values in England and Wales eased in Q2 2025 amid cautious buyer sentiment.
That said, values are still up on this time last year. Over the longer term, long-term growth is
robust and significantly outstrips CPI inflation.
There remains a healthy level of demand for prime assets, particularly when there is interest from local farmers looking to expand their operations and in locations with a strong rollover buyer presence. Secondary and tertiary assets, on the other hand, are being approached with hesitancy, widening the price gap.
£9,700
per acre
Average arable land value in Q2
from
Q1 2025
-1.1%
+0.3%

from
Q2 2024
£7,900
per acre
from
Q1 2025
-0.7%
+0.9%
from
Q2 2024
Farmland
Market Update
Average farmland values across England and Wales softened in the second quarter of the year amid increased caution in parts of the market.
An adjustment in values reflects easing buyer appetite for some
assets, as market polarisation intensifies.

FIGURE 5
Commodity prices
Source: Carter Jonas, AHDB, Farmers Weekly, Defra, ONS, OPEC
Input
Outputs


CRUDE OIL
Unit
Latest data
Date
Quarterly change
Annual change
£/barrel
51.5
June '25
-10.2%
-21.4%
Fertiliser
Unit
Latest data
Date
Quarterly change
Annual change
£/tonne
376.4
June '25
-0.2%
14.2%
Red Diesel
Unit
Latest data
Date
Quarterly change
Annual change
pence/litre
71.8
June '25
-8.0%
-13.2%
Feed Wheat
Unit
Latest data
Date
Quarterly change
Annual change
£/tonne
180.2
June '25
-3.9%
-11.6%
oilseed rape
Unit
Latest data
Date
Quarterly change
Annual change
£/tonne
429.3
June' 25
1.0%
7.8%
MILK
Unit
Latest data
Date
Quarterly change
Annual change
pence/litre
43.1
May '25
-6.0%
13.4%
BEEF
Unit
Latest data
Date
Quarterly change
Annual change
pence/kg dw
641.3
June '25
-4.2%
34.2%
Pork
Unit
Latest data
Date
Quarterly change
Annual change
pence/kg dw
203.7
June '25
1.4%
-1.5%


Click a location for
a local overview


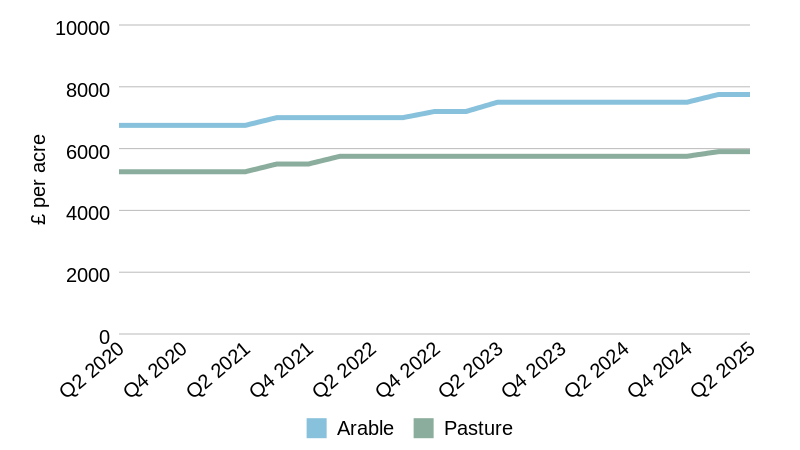
East of England
Arable
Pasture
£8,000
£7,000
£12,000
£9,500
£9,500
£8,000
-2.6%
0.0%
0.0%
3.2%
Low
£ / acre
Prime
£ / acre
Average
£ / acre
Quarterly %
Annual %
East of England land values
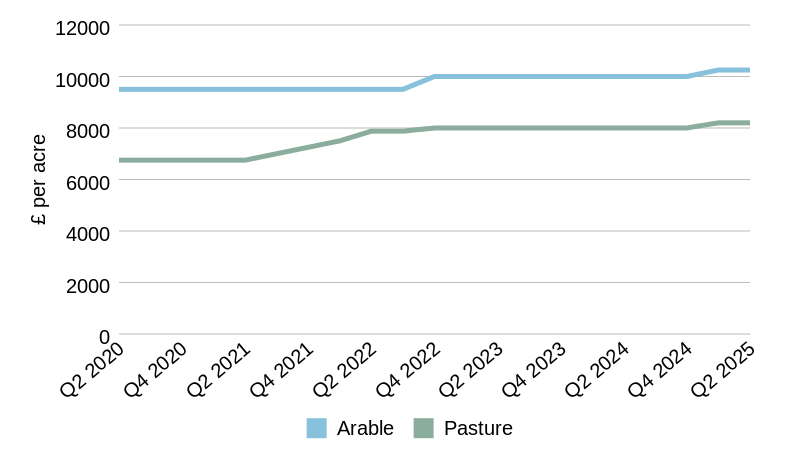
North West
Arable
Low
£ / acre
Prime
£ / acre
£ / acre
Quarterly %
Annual %
Average
£8,200
£6,750
£12,300
£10,250
£10,250
£8,200
0.0%
0.0%
2.5%
2.5%
Pasture
North West land values
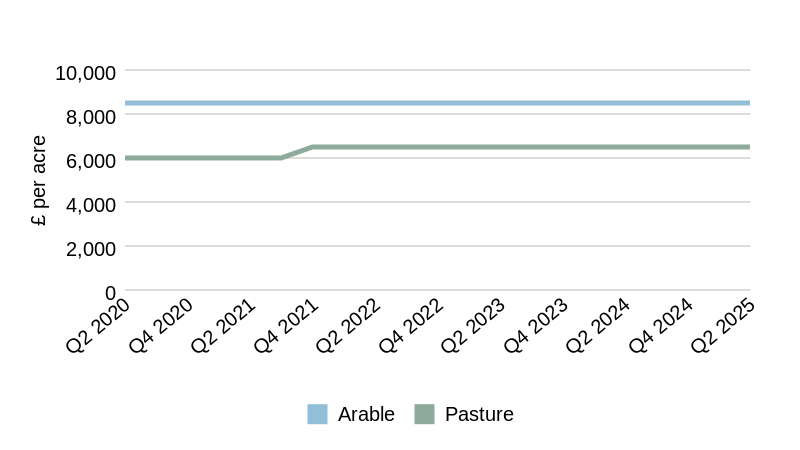
Wales
Arable
Low
£ / acre
Prime
£ / acre
£ / acre
Quarterly %
Annual %
Average
£8,250
£4,250
£10,000
£10,000
£8,500
£6,500
0.0%
0.0%
0.0%
0.0%
Pasture
EMAIL Hugh
01248 360417
Partner
Hugh O’Donnell

Wales land values

North East
Arable
Low
£ / acre
Prime
£ / acre
£ / acre
Quarterly %
Annual %
Average
£6,650
£4,400
£9,000
£6,650
£7,750
£5,900
0.0%
0.0%
3.3%
2.6%
Pasture
EMAIL Sam
01423 707801
Associate Partner
Sam Johnson
North East land values

Yorkshire and the Humber
Arable
Low
£ / acre
Prime
£ / acre
£ / acre
Quarterly %
Annual %
Average
£8,200
£5,700
£11,275
£7,500
£9,300
£7,250
0.0%
0.0%
3.3%
3.6%
Pasture
EMAIL Sam
01423 707801
Associate Partner
Sam Johnson
Yorkshire and the
Humber land values
East Midlands
Arable
Low
£ / acre
Prime
£ / acre
£ / acre
Quarterly %
Annual %
Average
£8,250
£7,250
£11,250
£9,250
£9,250
£8,250
-2.6%
0.0%
0.0%
3.1%
Pasture
East Midlands land values
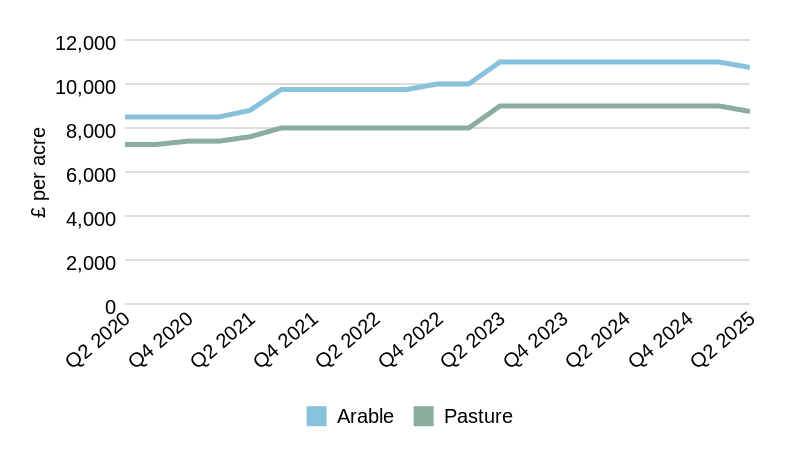
West Midlands
Arable
Low
£ / acre
Prime
£ / acre
£ / acre
Quarterly %
Annual %
Average
£9,500
£7,000
£14,000
£12,000
£11,500
0.0%
0.0%
0.0%
0.0%
Pasture
EMAIL EDWARD
0121 3060386
Associate Partner
Edward Beale
West Midlands land values
South East
Arable
Low
£ / acre
Prime
£ / acre
£ / acre
Quarterly %
Annual %
Average
£9,000
£8,000
£12,250
£9,500
£10,500
£8,750
-2.3%
-2.8%
-2.3%
-2.8%
Pasture
EMAIL Andrew
07880 084633
Partner
Andrew Chandler
Wales
West Midlands
East Midlands
South west
South east
East of england
Yorkshire & the humber
North east
North west
Get in touch
Hover over a trend for more info


South West
Arable
Low
£ / acre
Prime
£ / acre
£ / acre
Quarterly %
Annual %
Average
£9,500
£6,500
£12,000
£11,000
£10,750
£8,750
-2.3%
-2.8%
-2.3%
-2.8%
Pasture
EMAIL JACK

01823 428593
Partner
Jack Mitchell
South West land values
EMAIL Andrew
07880 084633
Head of Rural Agency
Andrew Chandler
After a slow start to the year, the volume of new, publicly marketed supply saw a significant increase in the second quarter, making the first half of the year considerably higher than the same period last year. While supply levels now exceed recent averages, they remain below historical highs.
Rather than one main factor driving the increase in supply, a combination of mounting pressures is prompting some farmers and landowners to review their business strategies and financial position, sometimes leading to a decision to sell (in whole or in part).
A number of policy changes took effect this quarter, with potential profit implications. Firstly, there were increases in employers’ National Insurance Contributions (NIC), the National Living Wage and National Minimum Wage. The beneficial tax treatment of furnished holiday lets was also removed, and the transitional period for changes to Class Q and R planning rules ended.
Supply and
demand
Commodity price trends


£1,100
£2,500
£1,800
0.0%
5.9%
Hill
£500
£1,500
£1,000
0.0%
0.0%
Hill
£1,900
£3,000
£2,300
0.0%
2.2%
Hill
£11,275
£14,350
£12,800
0.0%
2.4%
Lifestyle
£1,900
£4,000
£2,850
0.0%
3.6%
Hill
£11,000
£16,000
£13,500
0.0%
1.9%
Lifestyle
£11,250
£13,250
£12,300
0.0%
2.5%
Yorkshire Wolds
£13,250
£25,000
£16,750
0.0%
0.0%
Lifestyle
£9,500
£17,000
£13,000
4.0%
18.2%
Silts and Fen
£25,000
£16,000
0.0%
0.0%
Lifestyle
£13,500
£25,000
£17,000
0.0%
0.0%
Lifestyle
£9,500
£17,000
£13,000
4.0%
18.2%
Silts and Fen
£15,000
£34,000
£22,500
0.0%
0.0%
Lifestyle
SHEEP
Unit
Latest data
Date
Quarterly change
Annual change
pence/kg dw
743.5
June '25
1.3%
-5.0%
CHICKEN
Unit
Latest data
Date
Quarterly change
Annual change
pence/kg dw
378.0
Jan' 25
-1.6%
-1.6%
EMAIL SOPHIE
020 7493 0685
Research Associate
Sophie Davidson

South East land values
£12,500
£9,500

Land values:
the regional view
Q2 2025
Download the full report

Download the full report
Download the full report
Download the full report
For more commentary, download the full report as a PDF.
For more commentary, download the full report as a PDF.
Download the full report
For more commentary, download the full report as a PDF.
Average pasture land value in Q2
Explore the report
Land values: the national view | Land values: the regional view | Supply and demand | Commodity prices


For more commentary, download the full report as a PDF.

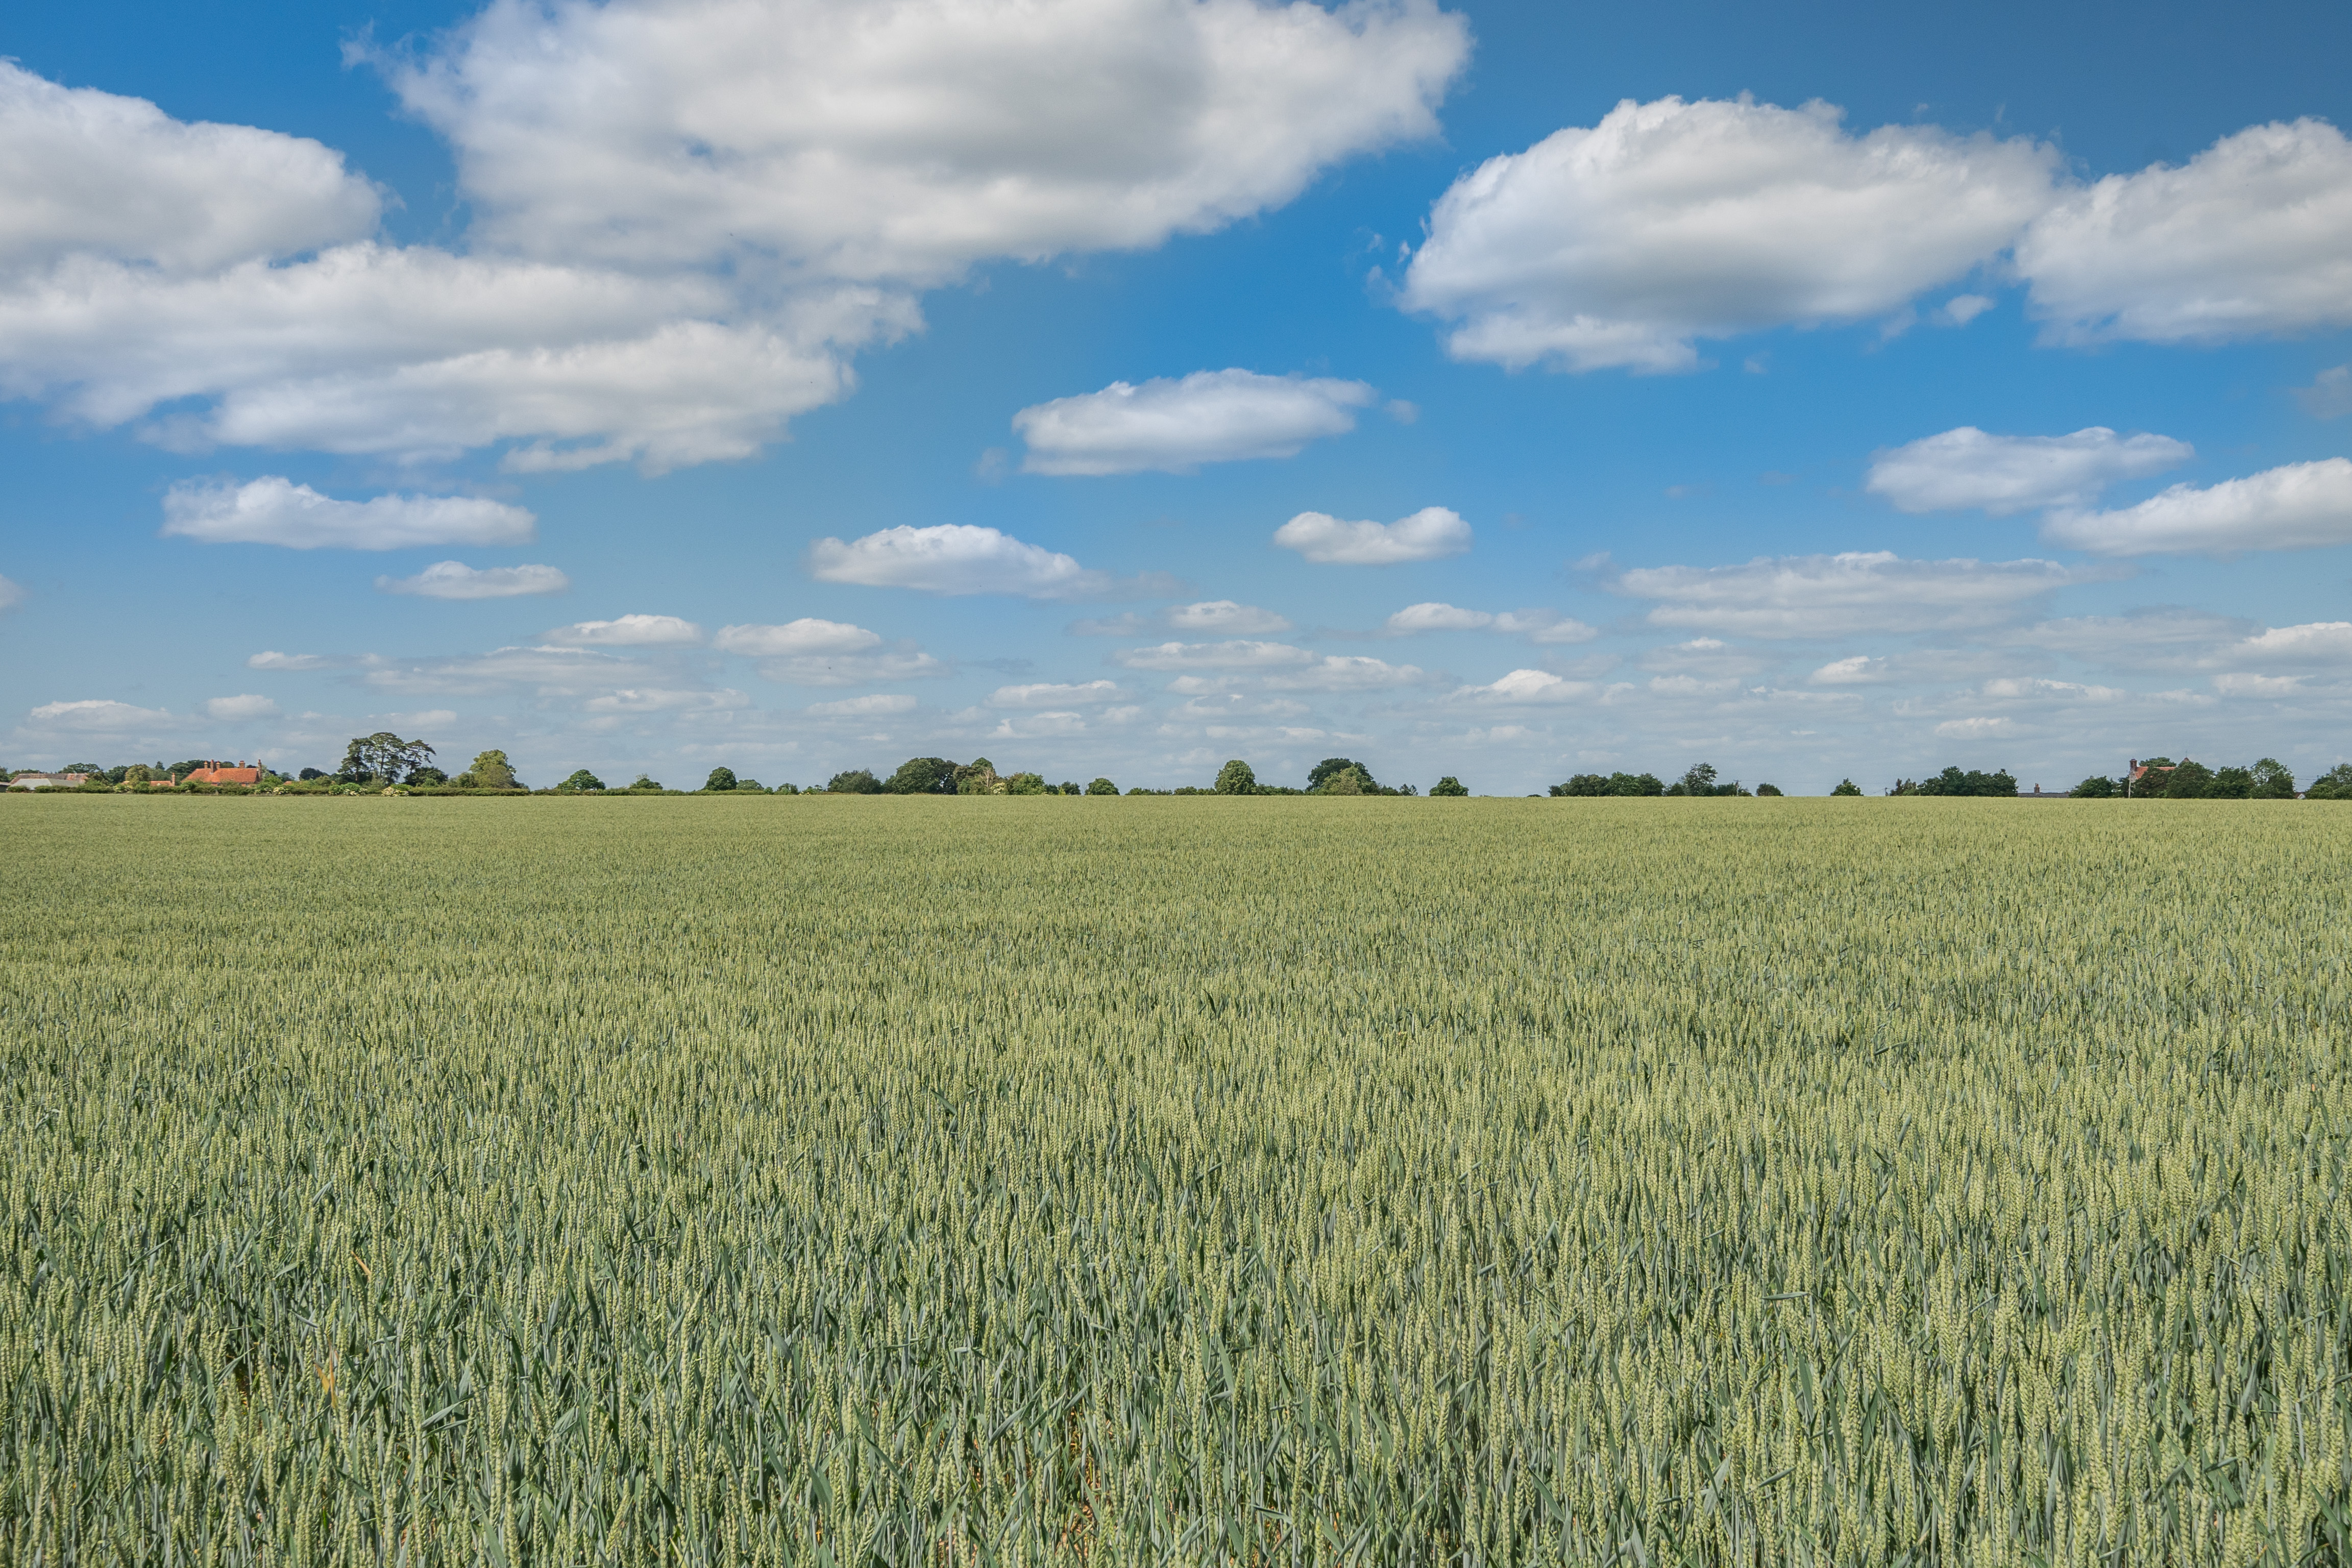
Ruses Farm & Hempstead Hall Farm, Hempstead CB10 / 392.4 acres / For sale


EMAIL Sam
01423 707801
Associate Partner
Sam Johnson
EMAIL Jamie
01223 346592
Associate
Jamie Elbourn
EMAIL Jamie
01223 346592
Associate
Jamie Elbourn


Overview and spotlight on the East
Rowbury Farm, Leckhampstead, Berkshire / 260 acres / For sale / £6,000,000
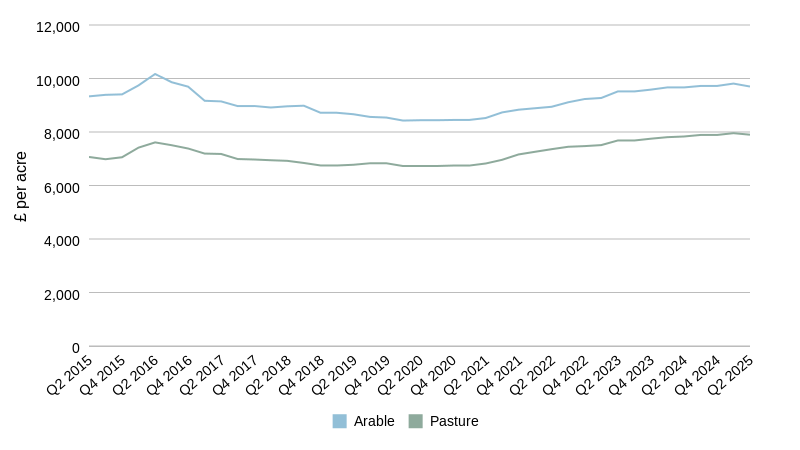
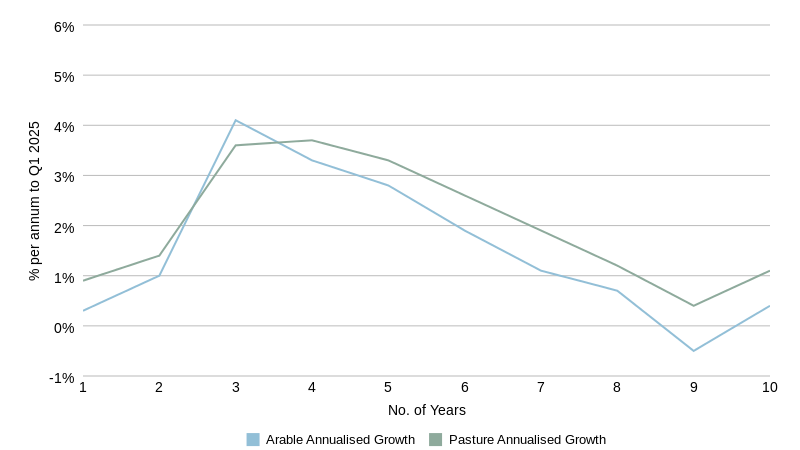
FIGURE 2: Annualised Growth of Average Land Values in England and Wales
Source: Carter Jonas
FIGURE 1: Average Land Values in England and Wales
Source: Carter Jonas
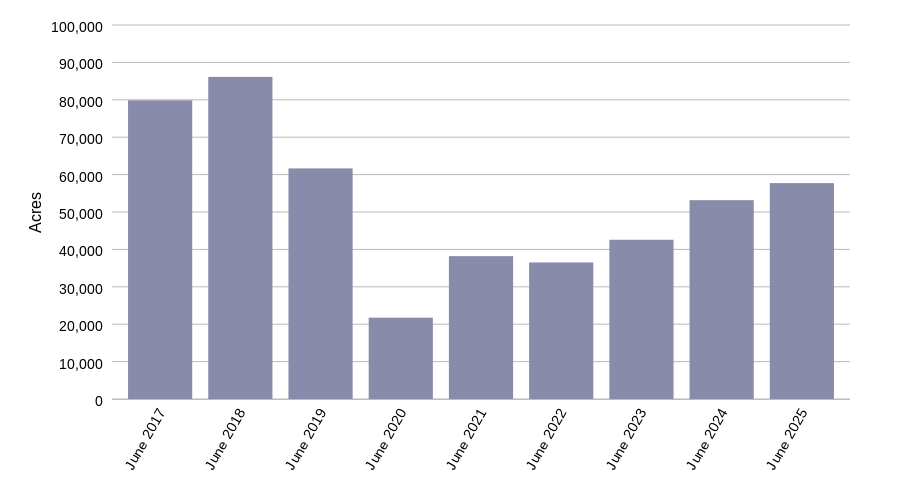
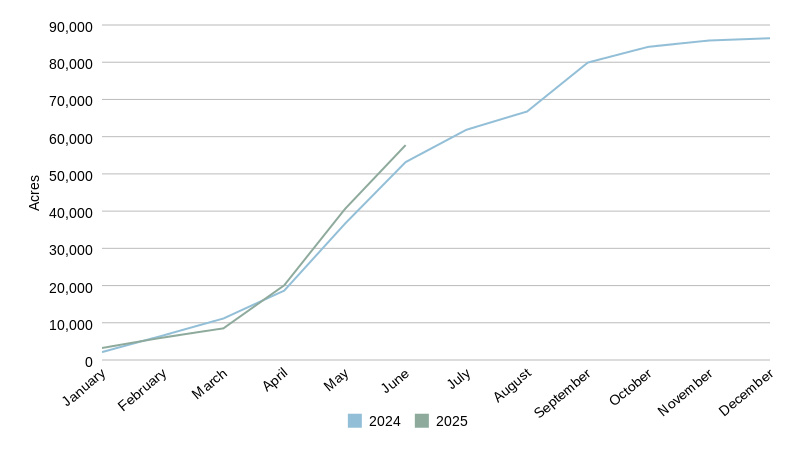
FIGURE 4: Cumulative publicly marketed farmland supply
FIGURE 3: Year-to-date publicly marketed farmland supply
Source: Farmers Weekly
Source: Farmers Weekly
Overview and spotlight on the West Midlands