Rethinking the Green Belt
Summer 2024
A source of controversy since its introduction, the Green Belt describes multiple rings of land (not necessarily open space) around urban areas that are protected from development.
We have analysed data on the structure of the Green Belt and looked at examples of places where growth is constrained to understand the cost of the Green Belt and how greater flexibility could increase levels of sustainable development.
Get in touch


David Churchill
Partner
07866 794560
EMAIL ME

Sophie Davidson
Research Associate
07917 233948
EMAIL ME

For more detail on the Green Belt,� download the full research report.
Download the full report

Green Belt
All�Environmental�Designations

For more commentary, download the full research report as a PDF.
For more commentary, download the full research report as a PDF.
Download the full report


Sites of Special Scientific Interest

National Landscapes

National Parks

Special Areas of Conservation

Local Nature Reserves

Special Protection Areas

Ramsar sites

Country Parks

Registered Parks and Gardens

World Heritage Sites

National Nature Reserves


Definitions


Sites of Special Scientific Interest �(SSSI). Areas of land or water designated for their high conservation value, often due to unique flora, fauna, geological features, or habitats.
National Landscapes
(Previously AONB). Areas recognised for their exceptional natural beauty and protected to conserve and enhance their landscape and biodiversity.
National Parks
Large areas designated for conservation and recreation, often featuring diverse ecosystems, wildlife, and cultural heritage.
Special Areas of Conservation
Protected areas designated under the European Union’s Habitats Directive to conserve habitats and species of European importance.
Local Nature Reserves
Small areas managed to conserve local biodiversity, ecosystems, and geological features.
Special Protection Areas
Sites designated under the European Union’s Birds Directive to conserve habitats for rare and vulnerable bird species.
Ramsar sites
Wetlands of international importance designated under the Ramsar Convention,
protected for their ecological value and biodiversity.
Country Parks
Publicly accessible areas designated for recreation and conservation, often offering
trails, picnic areas, and educational facilities.
Registered Parks and Gardens
Historic parks and gardens recognised for their cultural and horticultural significance.
World Heritage Sites
Areas recognised by UNESCO for exceptional natural or cultural significance.
National Nature Reserves
Protected areas managed by conservation organisations to safeguard important habitats,
species, and geological features.
Return to map

Structure & expansion


Over a 10-year period, �only 39 LAs have increased the extent of their Green Belt, while 102 have decreased theirs.
Area of land designated as Green Belt
Source: Department for Levelling Up, Housing and Communities
For more commentary, download the full research report as a PDF.
Download the full report


1,645,000
1,640,000
1,635,000
1,630,000
1,625,000
1,620,000
1,615,000
1,610,000
1,605,000
1,600,000
2008-09
2009-10
2010-11
2011-12
2012-13
2013-14
2014-15
2015-16
2016-17
2017-18
2018-19
2019-20
2020-21
2021-22
2022-23
Environment


Green Belt
Source: DLUHC, Natural England, �Carter Jonas GIS, Carter Jonas Research
London
Oxford
Cambridge
Bristol
Bath
Cheltenham
Gloucester
Wolverhampton
Coventry
Nottingham
Stoke-on-Trent
Liverpool
Manchester
York
Bournemouth
Poole
Leeds
Bradford
Sheffield
Newcastle
Middlesborough
White Haven
Lancaster
Carlisle
Lincoln
Bangor
St Davids
Swansea
Cardiff
Barnstaple
Land area (ha)
Norwich
Salisbury

Locations on

Locations off
Coverage


London
Bournemouth / Poole

Bristol / Bath

Oxford

Gloucester / Cheltenham

Leeds / Sheffield /Bradford

For more commentary, download the full research report as a PDF.
Download the full report


Nottingham

Manchester / Liverpool

Birmingham / Coventry

Newcastle

Cambridge

York

Stoke-on-Trent


Compare all
Close


Despite having �the word ‘green’ �in its title, the �Green Belt is not �an environmental designation.


Travel


Case studies


For more commentary, download the full research report as a PDF.
Download the full report


For more commentary, download the full research report as a PDF.
Download the full report


We have identified LAs with higher percentages of Green Belt land and where data indicates substantial pressure on housing, both at present and in future years. To delve deeper, we have chosen four case studies, and examine these in turn. We have also compared these LAs against national figures to understand the extent of these pressures.
Download the full report to read more information about each location


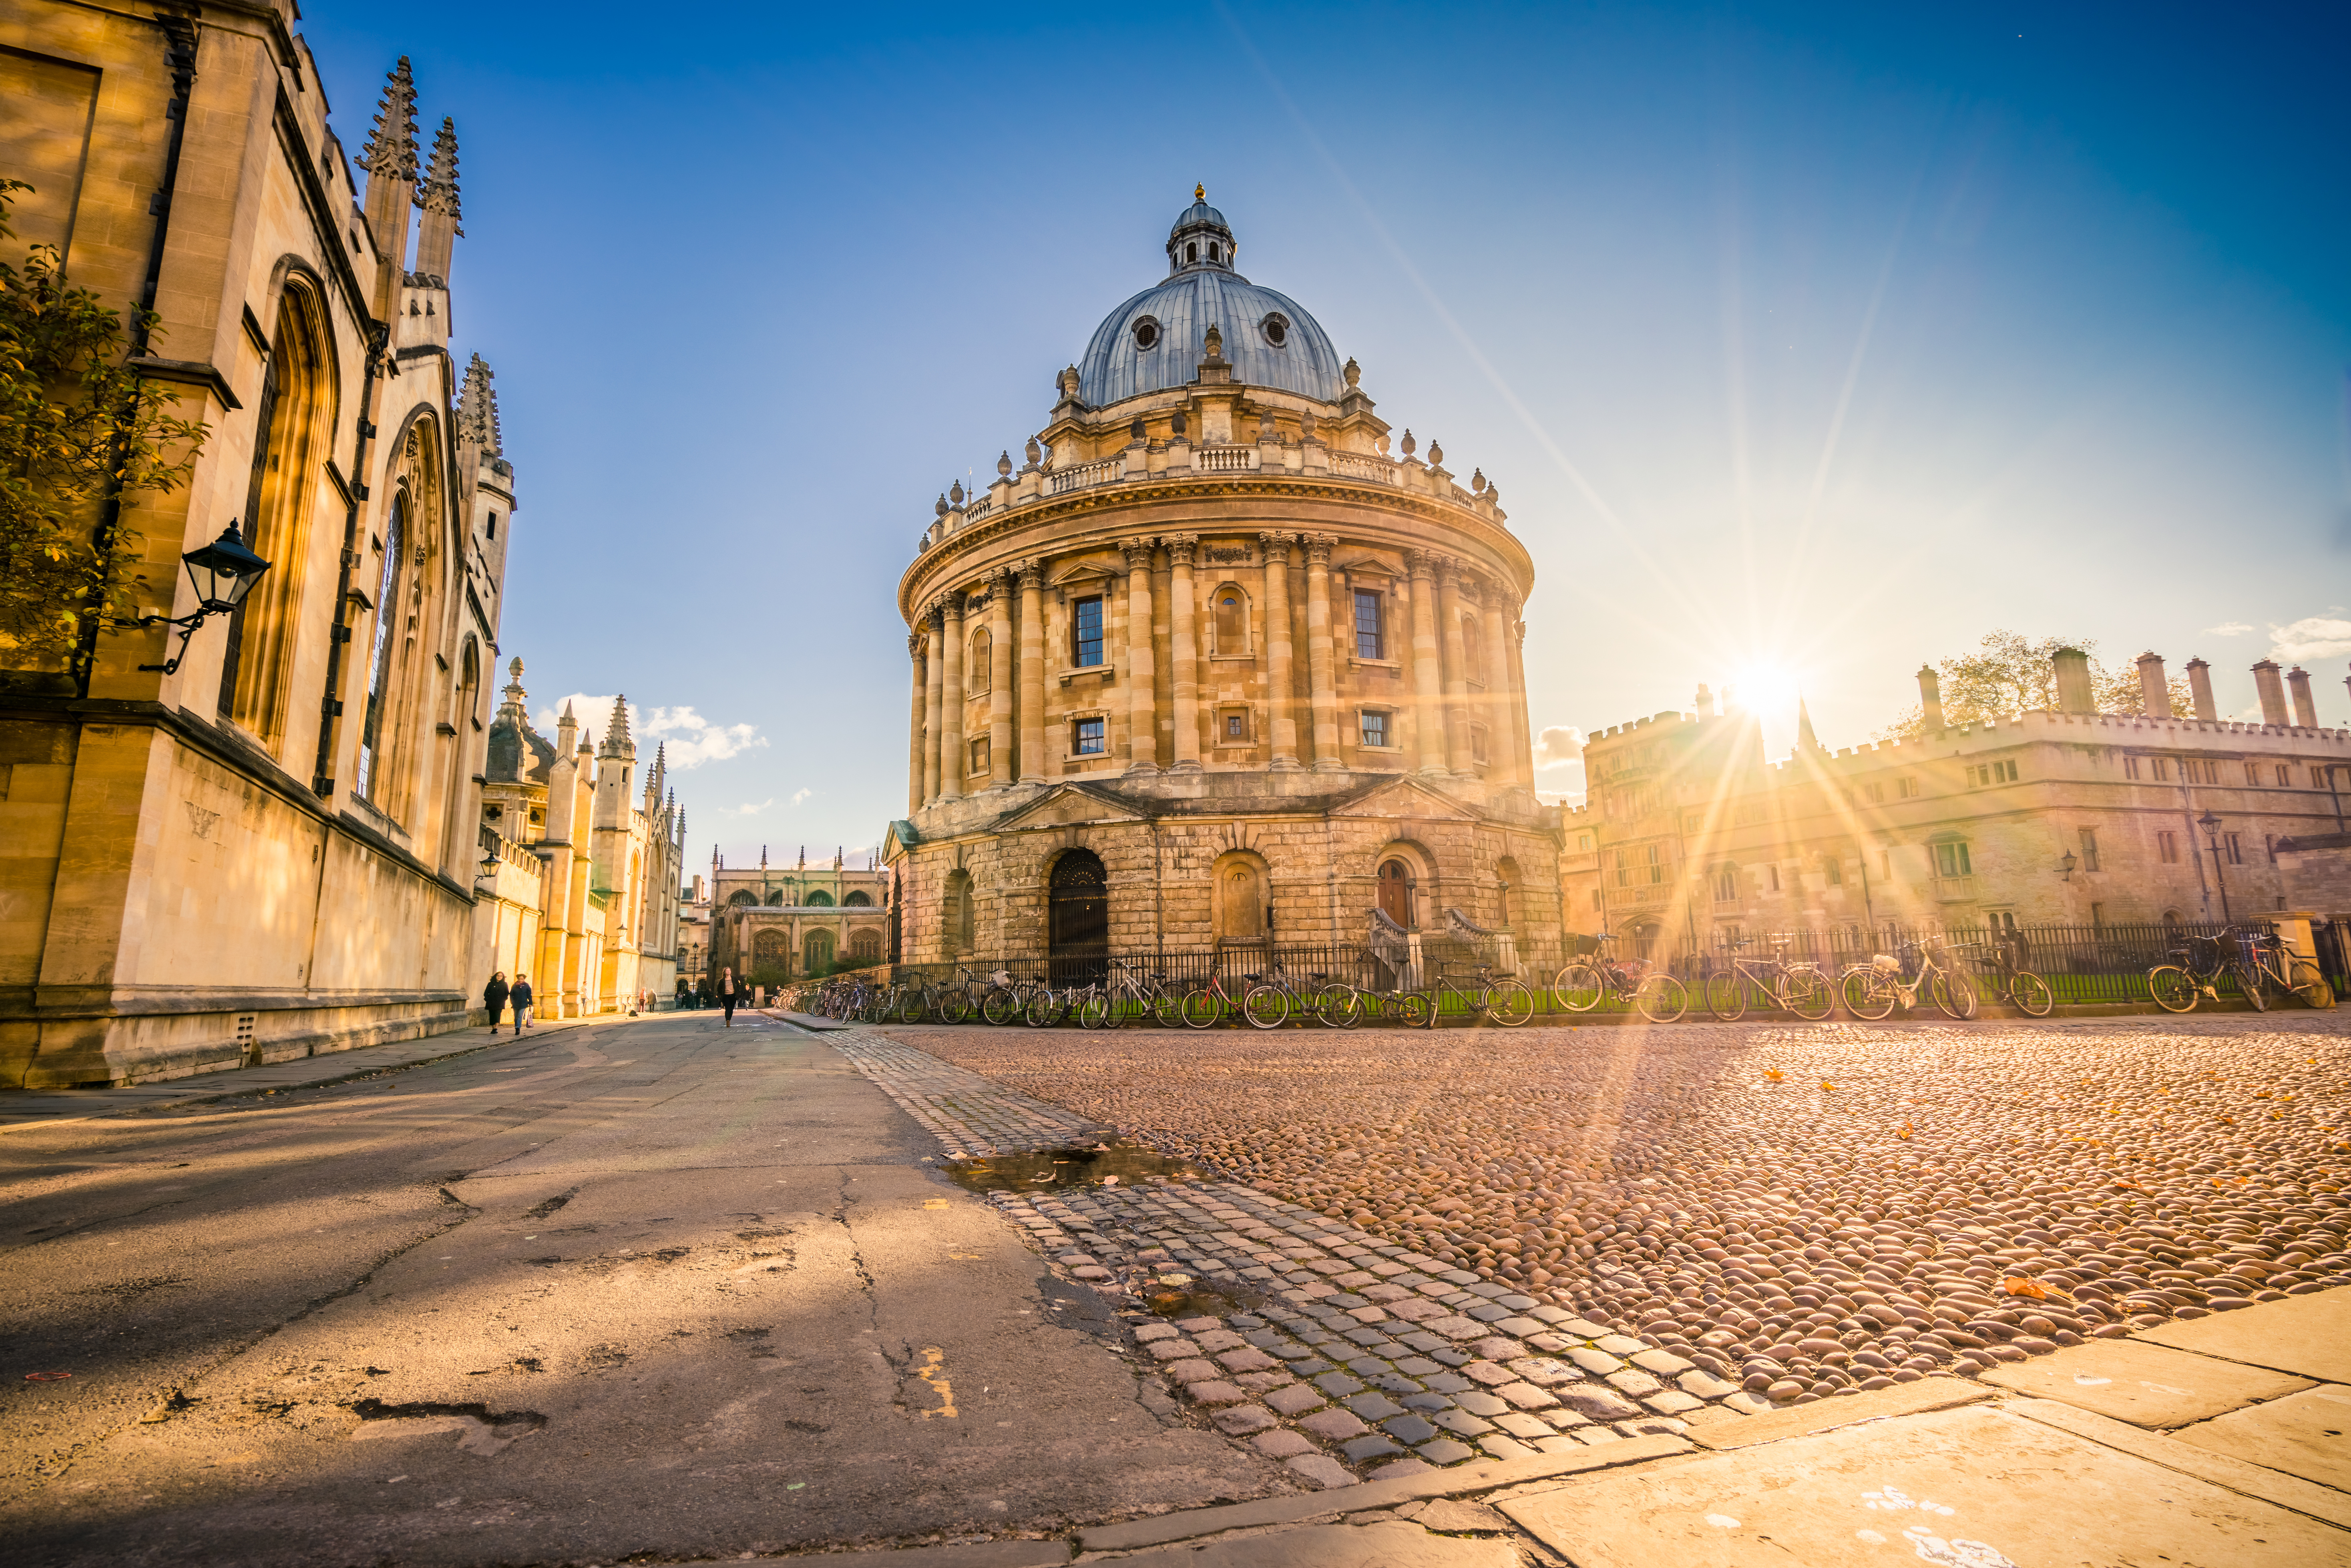
Oxford

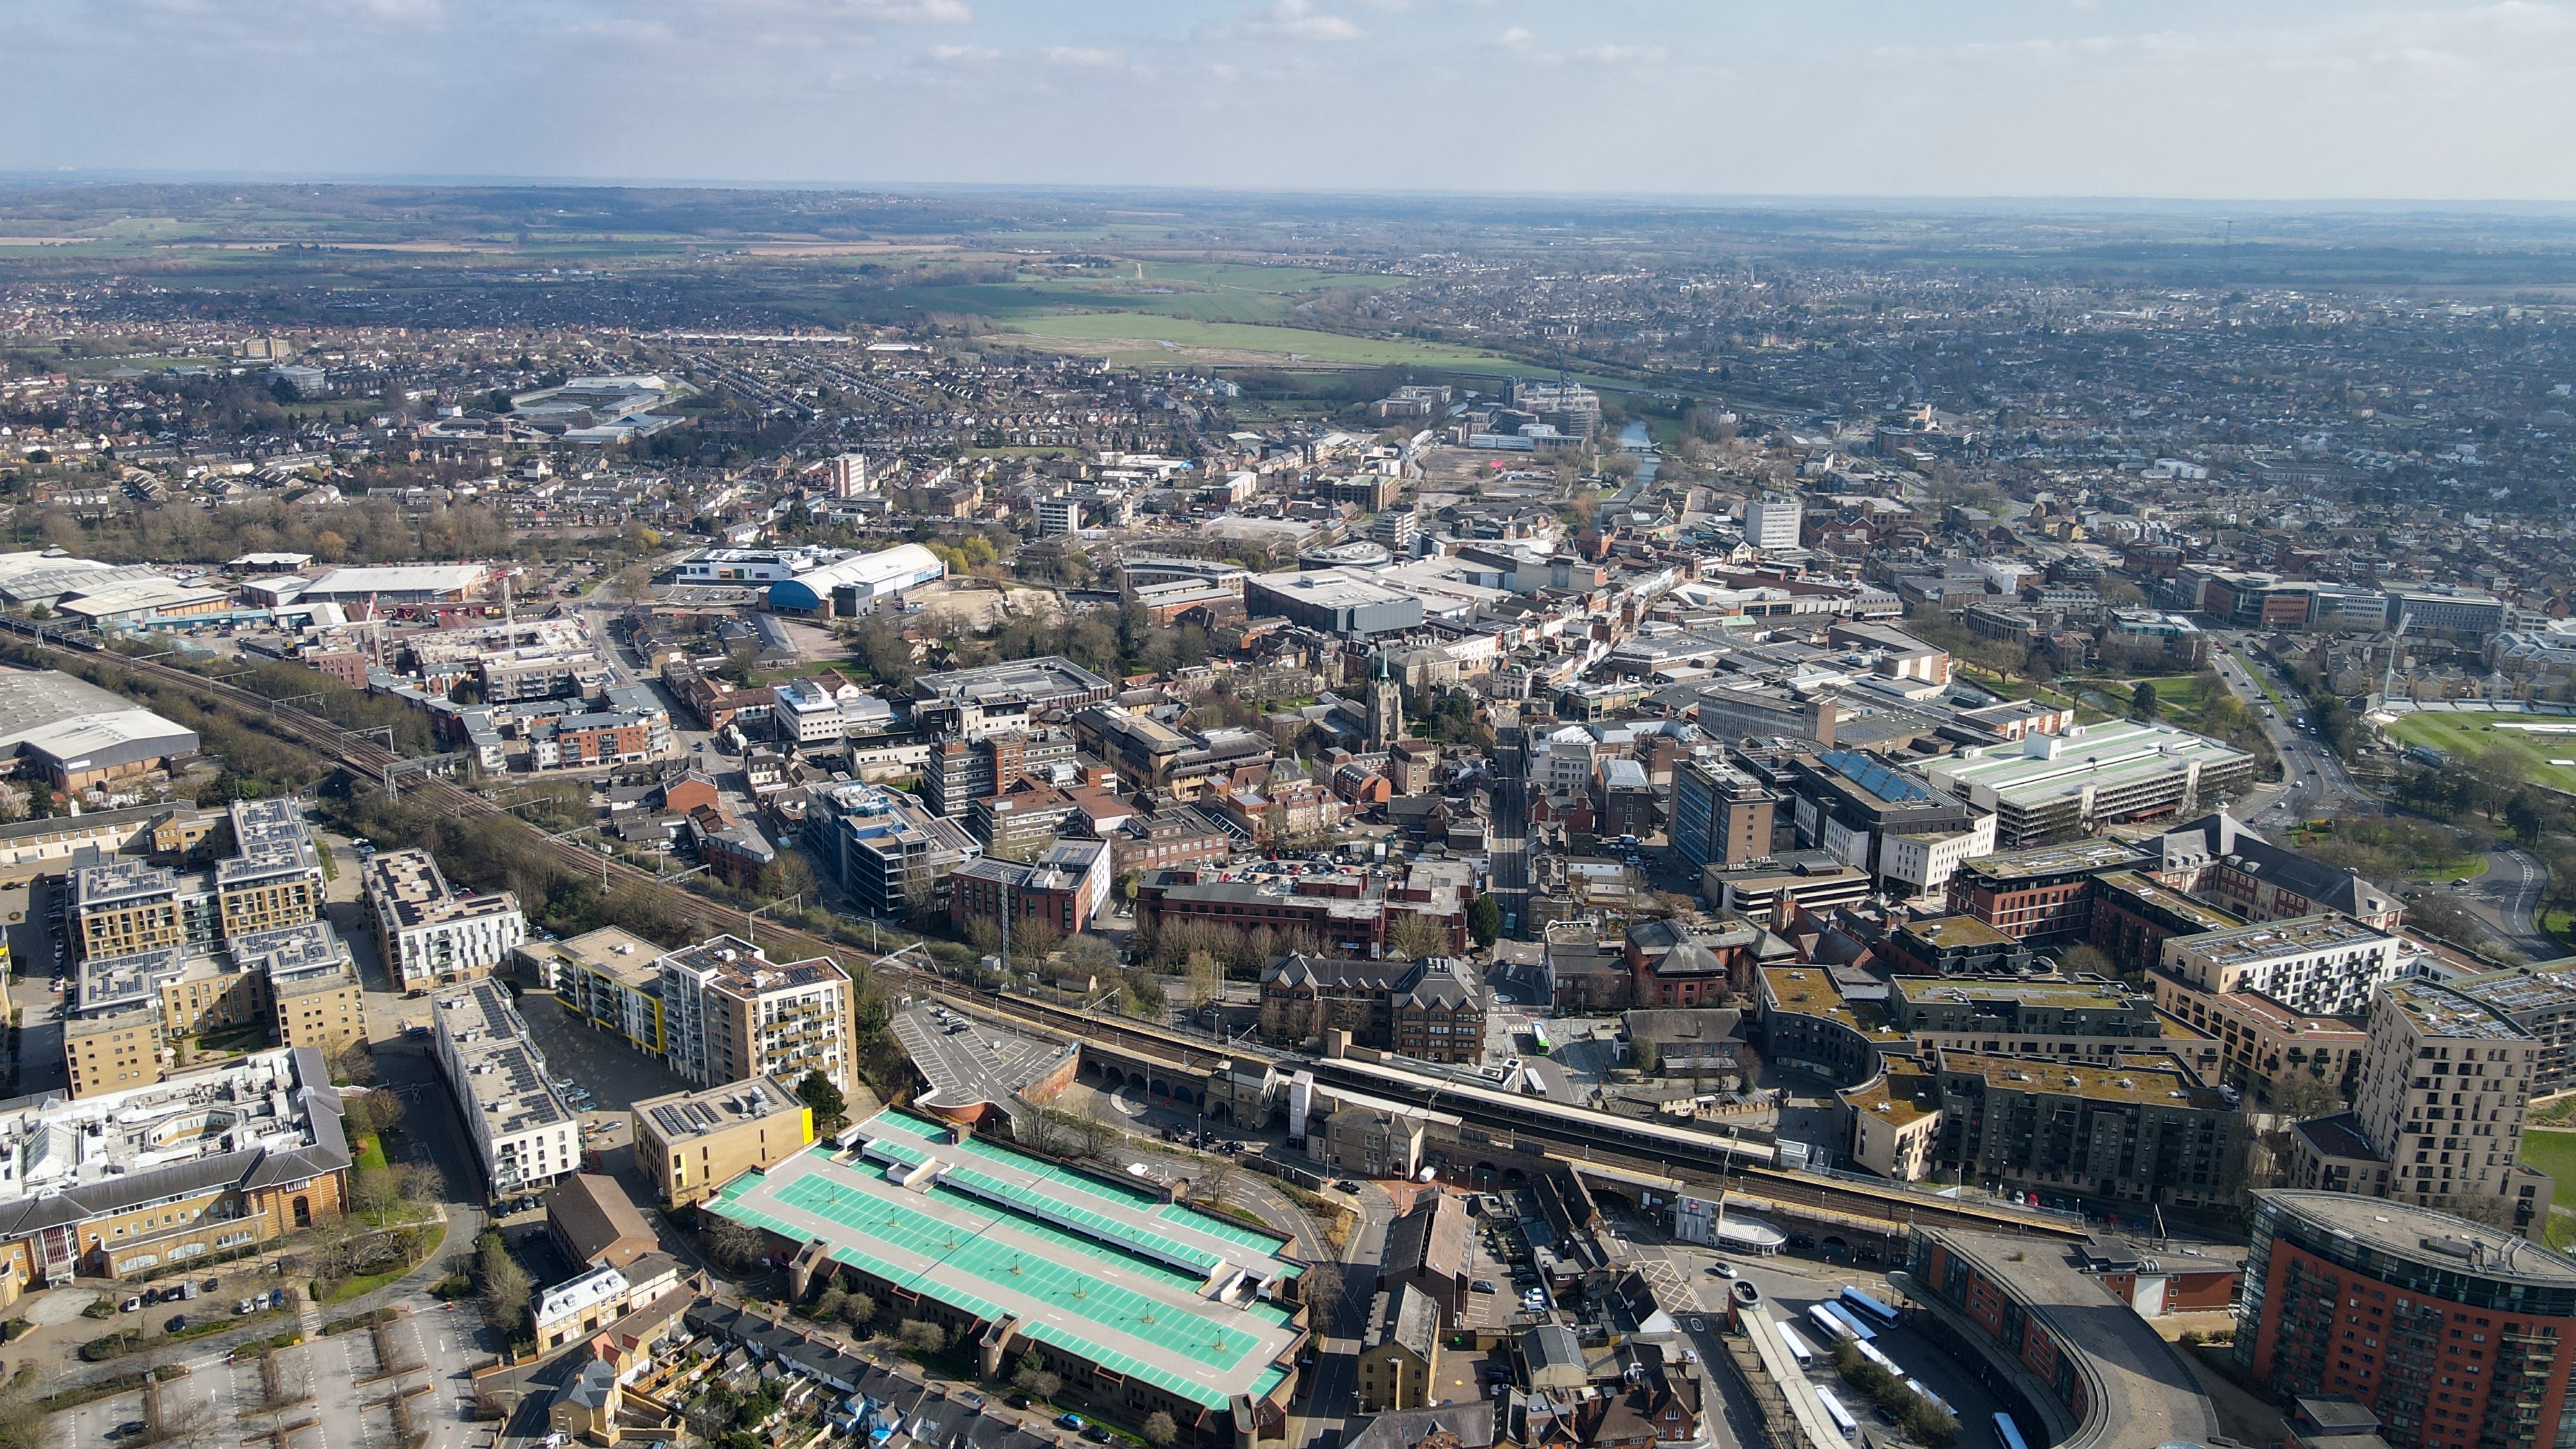
Chelmsford

Slough

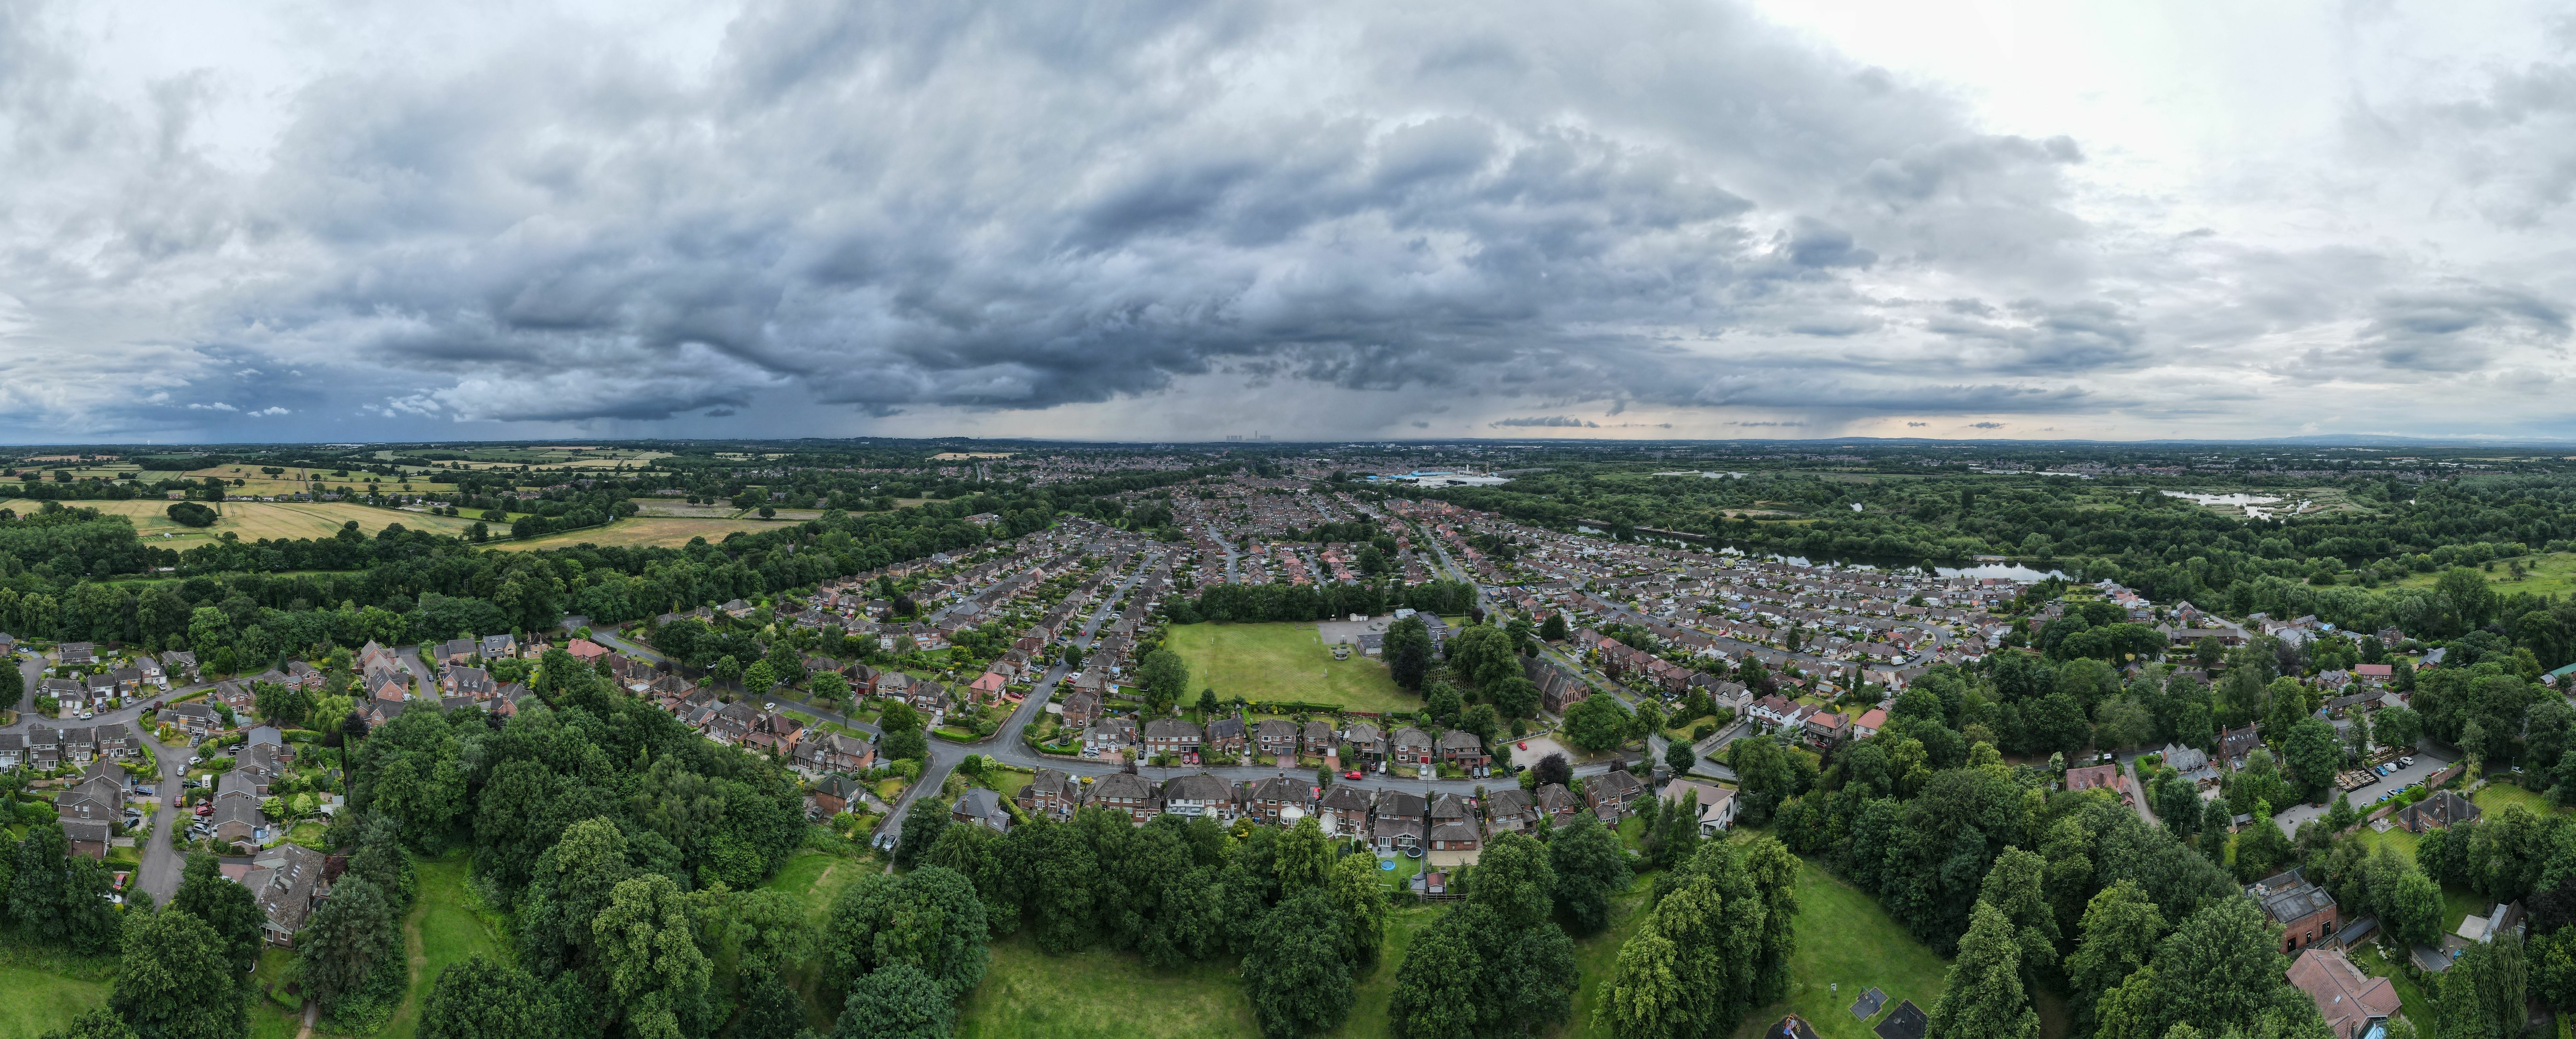
Warrington


Green Belt �releases are finally producing new homes, but not at the rate required


Chelmsford, a popular commuter hub, has been undergoing a significant housing development boom.


Slough has a very small geographical area (3,250 ha), �26.6% of which is designated as �Green Belt.


Despite its recent reduction, a very �high percentage of
Warrington is covered by Green Belt land
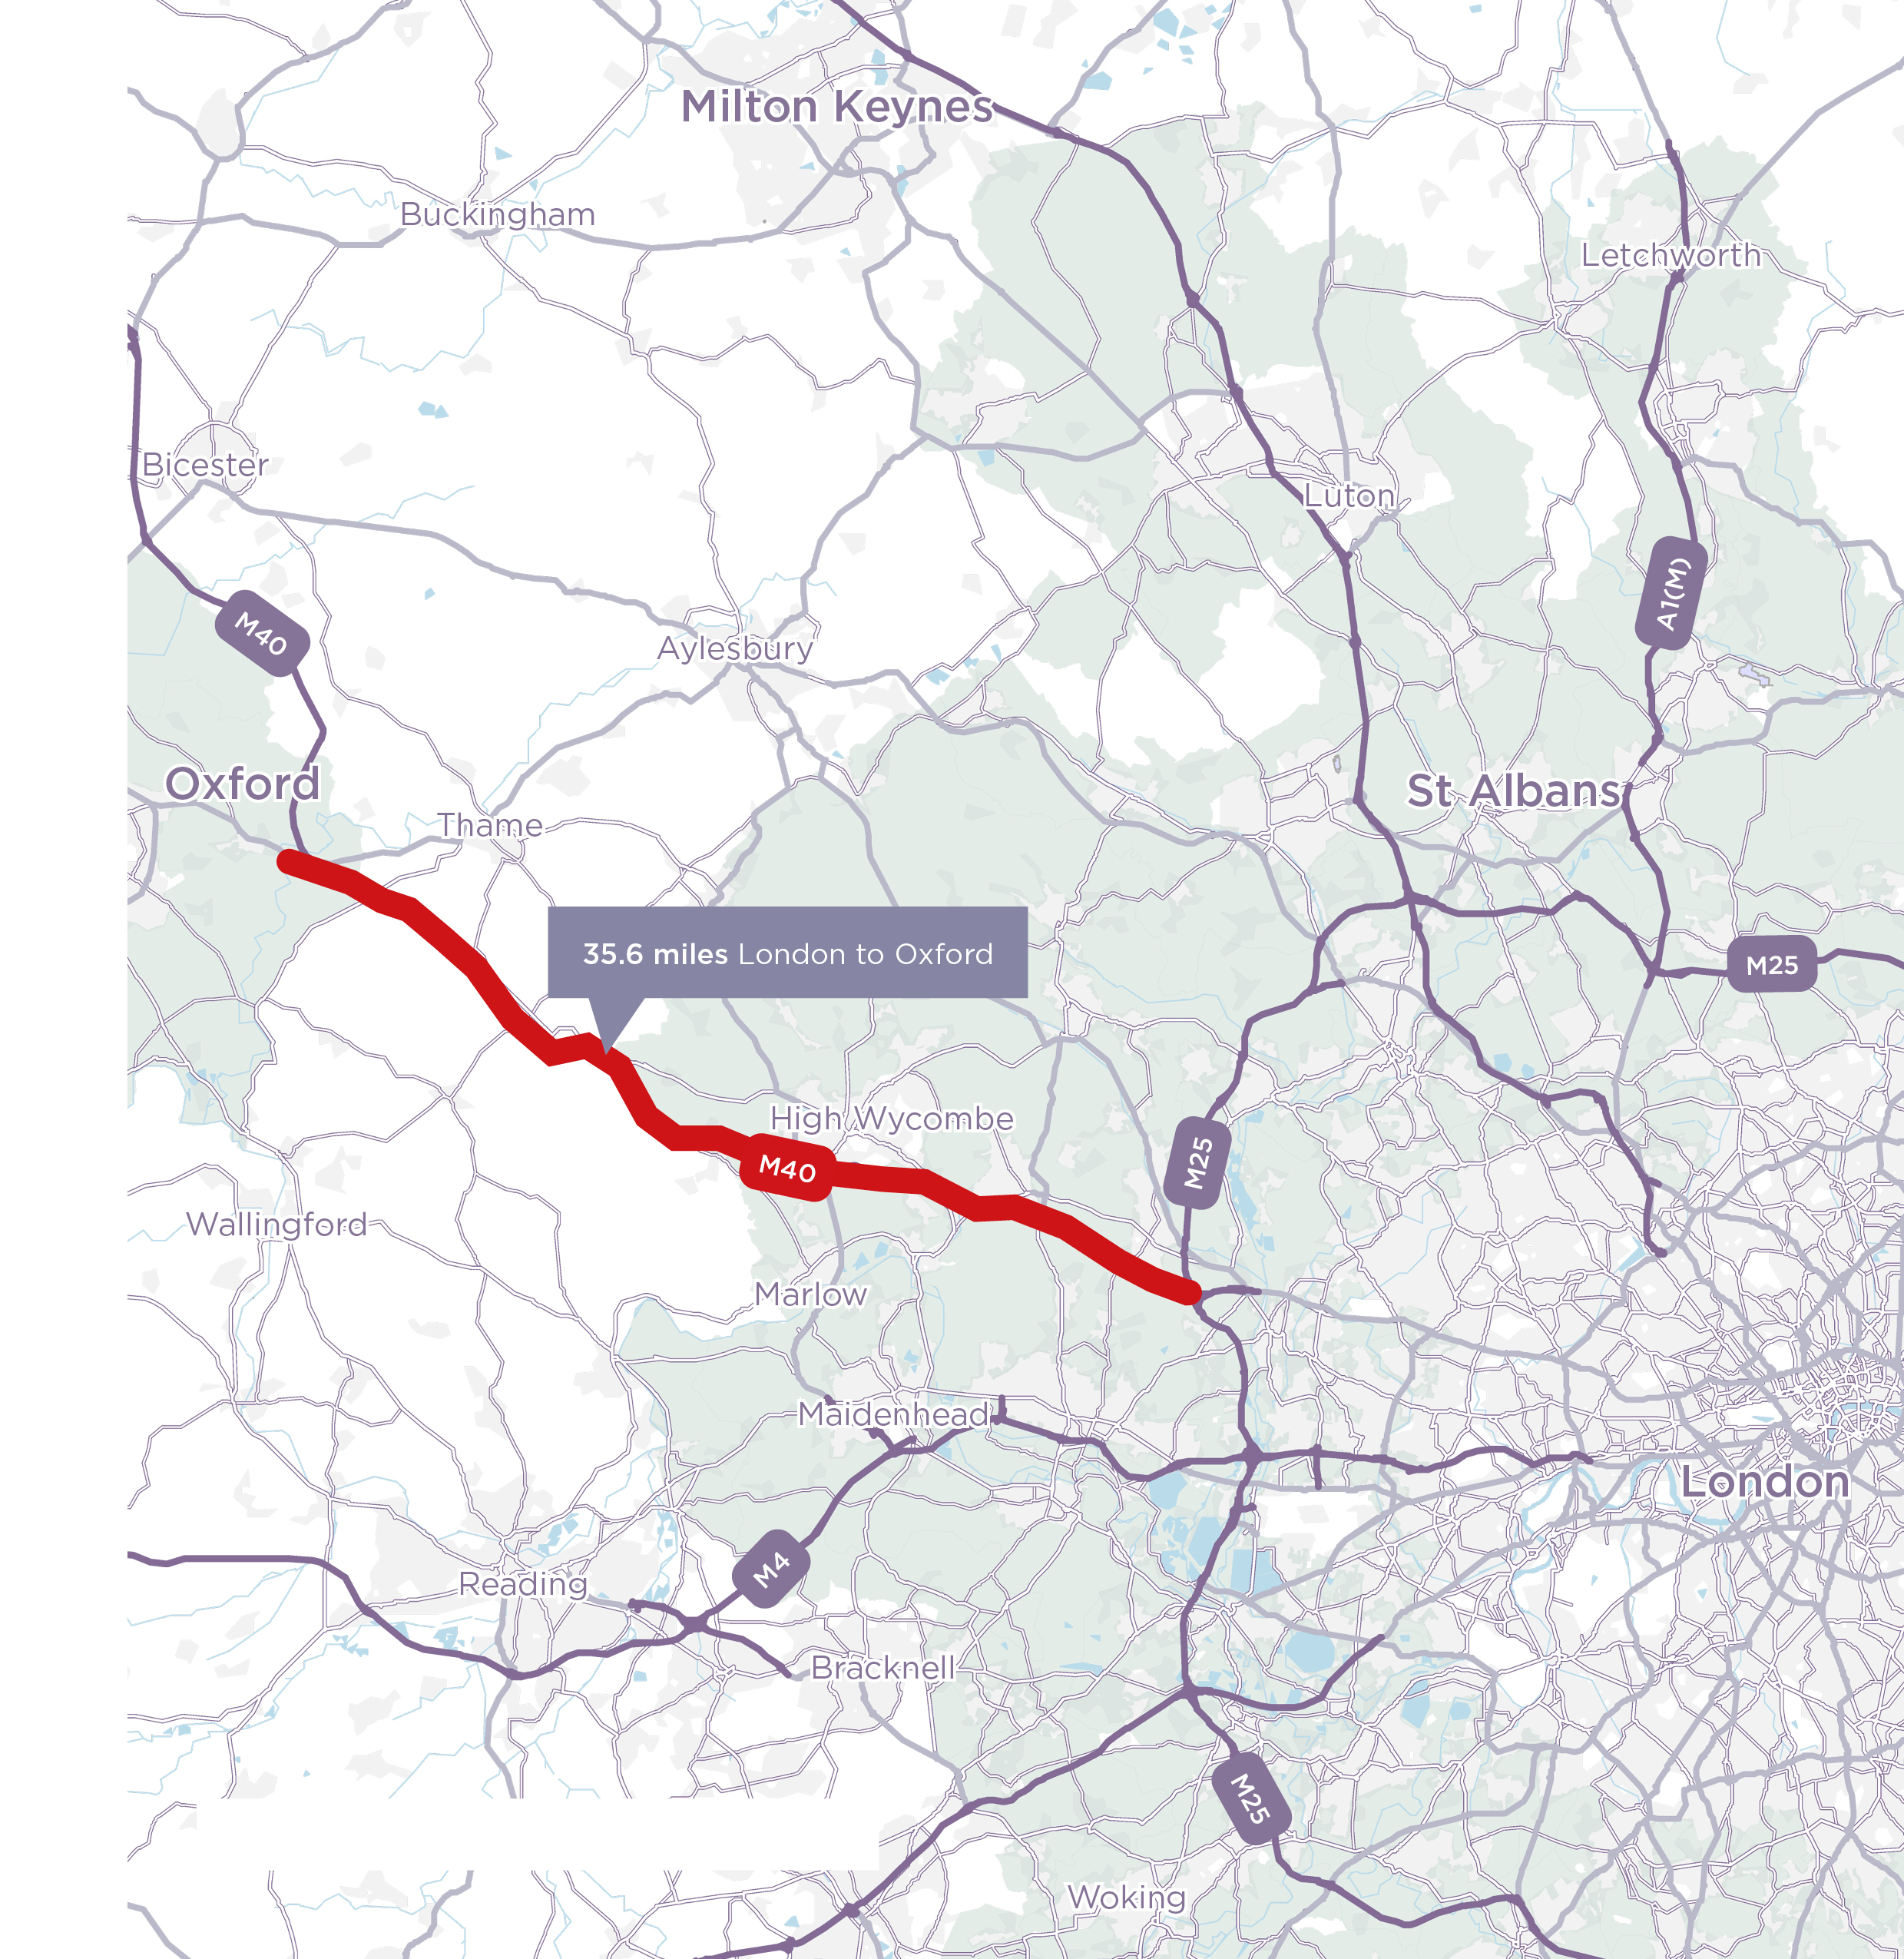
We have listed examples of where development along transport corridors could help ease pressure on housing in city centres.

M1 between Sheffield and Leeds

Rail route between Birmingham and Stratford-upon-Avon

A40/M40 between London and Oxford


60% of its junctions fall within the Green Belt


Facilitating development around these stations would optimise the utilisation of
existing infrastructure


Stretching approx 27 miles, 74.4% of the route is in Green Belt land

Colin Brown
Head of Planning & Development
07771 924426
EMAIL ME

Jump straight to a section:
Structure & expansion
Environment
Coverage
Travel
Case studies
Get in touch
Environment
Coverage
Travel
Case studies
Get in touch

Coverage
Travel
Case studies
Get in touch

Structure & expansion
Structure & expansion
Environment
Travel
Case studies
Get in touch

Environment
Coverage
Case studies
Get in touch

Structure & expansion
Environment
Coverage
Travel
Get in touch

Structure & expansion
Download the full report

Download the full report

View this page on desktop to see interactive maps illustrating where the greenbelt falls within the UK and all environmental designations.
Download the full report

Percentage of the Green Belt
Covered by Another Environmental
Designation by Green Belt Area
Source: DLUHC, Natural England,
Carter Jonas GIS, Carter Jonas Research


Download the full report


Download the full report


Download the full report


Download the full report


Download the full report
