

open storage UPDATE
Summer 2023
The average size of site required has declined modestly since peaking at 5.2 acres in 2021, falling to 4.9 acres in 2022 and 4.5 acres in Q1 2023.
outlook
The open storage market will continue to grow and evolve, becoming more mainstream as an institutional asset class. The number of high-quality Class 1 sites will increase as this is where the demand/supply imbalance is greatest.
Please contact our specialist team:
Email me

Andrew Smith
Partner, Open Storage Lead
+44 (0)7919 326085
Email me

Daniel Francis
Head of Research
+44 (0)20 7518 3301
FRICS SIOR


Occupier demand

Section one
Classifying open storage sites

Section two
Supply

Section three
Pricing and tenure

Section four
Drivers, opportunities and growth potential

Section Five


Welcome to our Summer 2023 update on the open storage market. The level of occupier enquiries continues to accelerate and interest from a range of private and institutional investors has increased further. Against this positive backdrop, we assess the outlook for the sector.
Figure 1 also shows that the average size of open storage land requirements has fallen from a peak of 5.2 acres in 2021 to 4.0 acres during the first eight months of 2022. In part, this is due to several enquiries for very large sites in 2021 (greater than 20 acres), which have not recurred in 2022.
Carter Jonas has been monitoring the rapid acceleration in enquiry levels for open storage sites over the last four years. The number and average size of enquiries since 2019 are illustrated in Figure 1. As this shows, 2022 saw well over 400 enquiries compared with 250 in 2021 and under 200 in 2019. The start of 2023 has been particularly strong, with almost 200 enquiries in Q1 alone.


Rental trends
The open storage sector has seen significant rental growth over the last year, led by the regional markets outside of London and the inner South East. These have been significantly undervalued in the past and are moving up from a low base, with rental growth of 58% over the 12 months to Q1 2023.
In London and the inner South East, rents have risen by 19% over the last 12 months. Although this is a much lower rate than the regional markets, it still represents a very strong level of performance, well above inflation and significantly higher than the mainstream commercial market.
Source: Carter Jonas
Stated ERVs assume a 1.5 acre Class 1 site which is serviced and fenced, with a concrete surface, broadly unrestricted B8 use and available on a lease length of 3-5 years.


Read more about our research on how Open Storage is the new asset class in the industrial sector
Read more


Total Demand (acres)
Number of enquiries

The proportion of enquiries for small sites (less than 1.5 acres) has increased noticeably. In 2021, this segment accounted for 28% of enquiries, compared with 42% of enquiries in 2022 to date. Enquiries by size band are shown in Figure 2.
In terms of the number of enquiries, 2022 is broadly in line with the 2021 level, and is significantly elevated compared with previous years, as Figure 3 illustrates.
•
•
•
•
•
Average size required (acres)
Figure 1: Open Storage Demand
Number of enquiries
Average size required
Source: Carter Jonas, Agency Pilot, IAS
Actual
Forecast
Figure 2: Open Storage Demand (acres)
Ulta-urban: <1.5 acres
Standard urban: 1.5-2.9 acres
Total demand (no. of enquiries)
Figure 3: Demand by size band, 12 months to Q1 2023
Source: Carter Jonas, Agency Pilot, IAS
Supply remains constrained, especially in major urban areas. As well as an overall shortage of sites, there is an imbalance in terms of the provision of high-quality sites which are the focus of growth in the sector.
•
Figure 4: Demand by tenure type
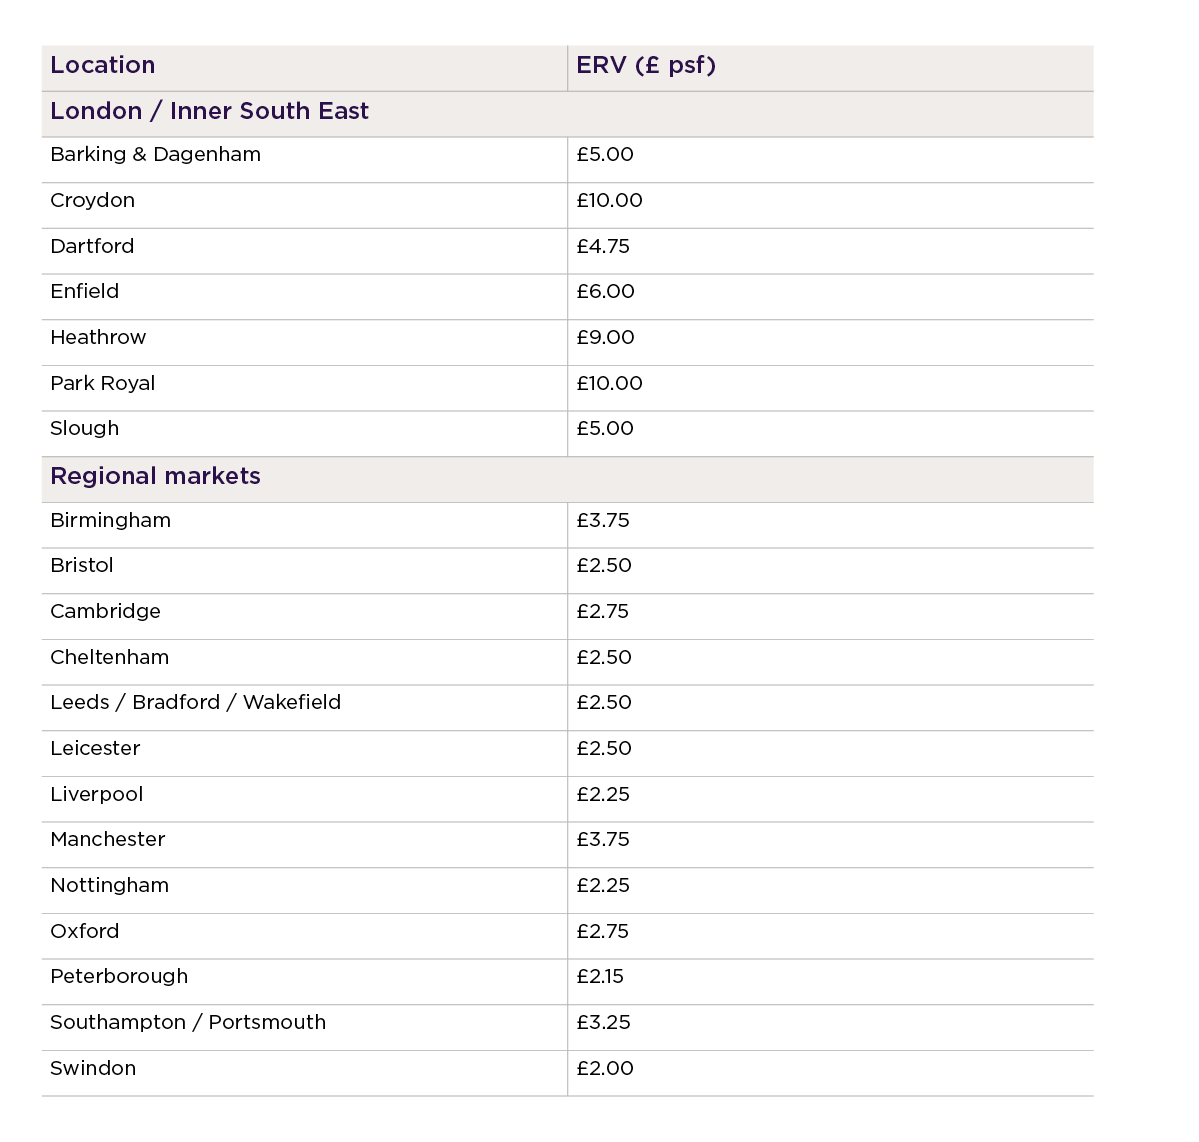
Stated ERVs assume a 1.5 acre (net useable) average Class 1 site scoring a minimum of 85 on the Carter Jonas classification scoring system. The site is assumed to be serviced and fenced, with a concrete surface, broadly unrestricted B8 use and available on a lease length of 3-5 years.
Table 2: Prime rents – Class 1 sites
London/Inner South East
Rest of UK
Figure 6: Rental growth to April 2023
Price per sq ft (£)
6 months
1 year
Figure 7: Prime open storage rents, London and inner South East
Price per sq ft (£)
•
Investment trends
The open storage sector is already operating at significant scale. Valuation Office Agency data suggests that land classified as open storage has a total rateable value of £383 million across more than 26,000 sites (England and Wales). However, this will be a considerable underestimate of the total market, as many open storage facilities will be part of larger sites classified under other uses. In terms of capital value, we estimate that the UK market could be worth well in excess of £16 billion.
•

Occupational demand levels for open storage
Source: Carter Jonas, Agency Pilot, IAS
Source: Carter Jonas, Agency Pilot, IAS
Source: Carter Jonas
Source: Carter Jonas

•
In terms of the volume of space, demand in 2022 exceeded 2,000 acres. Enquiries in Q1 totalled a record 895 acres, above the 765 acres recorded in Q4 2022. Given this acceleration in enquiries, we are forecasting demand to exceed 4,300 acres for the whole of 2023. It should be noted that the actual level of demand will be higher than this as some enquiries are for multiple sites. In addition, our overall demand figures will have captured only a proportion of the whole market. The volume of enquiries since 2019 plus our projection for 2023 are illustrated in Figure 2.
•
In terms of site size, the highest level of demand by number of enquiries is for small ‘ultra-urban’ sites of less than 1.5 acres. However, demand is broadly spread across a range of size bands (see Figure 3).
Total demand (acres)
Large urban: 3-6.9 acres
Non-urban: 7+ acres
The sources of demand for open storage have continued to diversify, and the sectors where demand is growing correlate with those requiring high specification sites. Logistics and parcel operators continue to seek large numbers of sites for the parking and storage of van fleets for both traditional and electric vehicles (EVs). But it is the requirements for EV charging where we are seeing the largest volume and highest growth in enquiries. This will be a significant ongoing source of demand, although in some locations open storage operators will need to compete with other types of provider such as park and ride schemes.
•
Aecom recently undertook a survey of lorry parking in England on behalf of the Department for Transport. This highlighted that the number of lorries requiring parking exceeded the available on-site parking facilities within five kilometres of the strategic road network (SRN) by more than 4,500. However the insurance industry and wider health and safety issues will increasingly require lorries to be parked in designated areas, and we believe this will create a growing source of demand for open storage sites located close to the SRN.
•
We are also seeing increased demand from niche users such as film companies. However, it is important to remember that the traditional base of occupiers such as building contractors, and uses such as pallet storage, general storage and scrap metal recycling still form a significant proportion of overall demand, and continue to sit within the sector’s diverse tenant mix (although many of these operators do not require Class 1 sites). See Table 1 for Carter Jonas 4-tier classification system.
•
Many of those seeking open storage space would consider either leasing or purchasing a site, accounting for nearly 43% of enquiries. 32% of enquiries are looking only to rent whilst 25% are looking only to purchase (see Figure 4). For investors, this suggests that over two thirds of open storage requirements can be met through leased sites. Furthermore, it is likely that the majority of enquiries from larger corporates for high-quality sites are likely to be in this category.
•
There is also a geographic imbalance as Figure 5 demonstrates, with the highest proportion of demand focussed in the South East and Greater London, whilst the greatest stock is focussed in areas such as the north of England and the South West.
•
Sources of demand for open storage


New stock levels
Rents
Capital values
Summary of forecast market trends for open storage

Yields

Enquiry levels
Figure 5: Open storage sites by region compared with demand
Source: Carter Jonas, Agency Pilot, IAS
Proportion of open storage sites
Proportion of enquiries
Carter Jonas has developed a 4-tier classification system to score sites based on a standard set of criteria. This is based on the quality of the surfacing, site security,
the services and facilities available, accessibility, operating hours and other
planning use.
•
Note: the enquiries figures exclude national enquiries
However, growth in the regional markets has slowed to a more sustainable rate, with a rise over the last six months of 9.9%, only slightly above London and the inner South East at 9.3%. These trends are illustrated in Figure 6.
•
•
•
London and the inner South East continue to see significant variations in rents, depending on location. For our monitored locations, this ranges from £10.00 psf in Croydon and Park Royal, to £5.00 psf in Barking & Dagenham and Slough, and £4.75 psf in Dartford.
•
Despite having seen significant growth, prime rents in the regional markets outside of London and the inner South East sit within a much lower range, from £2.00 psf to £3.75 psf. Indeed, the differential between rents remains striking – the average rent for Class 1 sites in locations within Greater London is £8.00 psf, compared with £4.75-£5.00 psf in the inner South East and an average of £2.68 psf for the regional markets.
•
Source: Carter Jonas
Figure 8: Prime open storage rents, regional markets
Price per sq ft (£)
Source: Carter Jonas
We are seeing a huge level of interest in the sector from a broad variety of investors, with an increasing number of larger funds now seriously considering how they can gain entry. As a result, we have seen a higher level of trading of open storage sites in recent months. Larger assets are now starting to trade as open storage and there have been some interesting portfolio deals recently. It is noticeable that agents have been positioning certain portfolios, particularly those with low site coverage, as open storage.
•
The sector is highly attractive to investors. These are some key reasons:
•
It has traditionally been undervalued from a rental point of view, with further scope for rental growth given the strength of demand and constrained supply.
•
The occupier base is broad, and many occupiers sit in sectors that will see further growth in requirements. For well-located sites, demand will remain strong with a low void risk given the demand/supply imbalance.
•
There is potential to upgrade sites, and many sites will also have longer term development potential.
•
The sector is attractive from a sustainability point of view, as open storage sites do not consume large amounts of energy and are less subject to tightening Minimum Energy Efficiency Standards (MEES) regulations. That said, the use of concrete surfaces is potentially problematic from an ESG point of view, although temporary surfaces such as hardcore or mesh can be used where heavy traffic movements are not generated.
•
It requires relatively low CAPEX compared with new build product.
•
The product attracts full 100% rating relief when it is vacant, so there is a limited hold cost.
•
We estimate that the amount of capital (including debt and equity) looking to
invest in the sector has risen from around £2 billion a year ago to more than £6 billion currently. Investors are now operating or proposing a variety of different business models, and some are effectively using the UK as a testbed for expansion into the broader European open storage market. Indeed, we estimate that around half of available capital is from players who are also looking to invest on the continent.
•
Whilst there has been some upward yield adjustment in the open storage sector, this has not been to the same extent as the broader industrial occupier market, which has seen average equivalent yields move up by circa 180 basis points since last summer (MSCI Monthly Index). The resilience of open storage has been partly due to its high level of yields relative to other commercial sectors, as well as the continued positive investor sentiment.
•
Equivalent yields are currently in the region of 7-7.5% for high-quality Class 1 sites. Secondary stock is likely to trade at 100-200 basis points higher than this, depending on class and location. Conversely, some exceptionally well-specified and well-located sites could expect to see a lower yield.
•
Many occupiers are seeking the certainty of leasing space for longer than 18 months to two years, particularly on larger sites of three acres plus where CAPEX may be higher on set up. Importantly, longer-term lettings work for investors too, particularly if they decide to invest in a site to increase its grade, attracting tenants with a stronger covenant who will potentially pay a premium for a longer lease.
•
Open storage has traditionally been seen as an interim use for a site prior to development, and many sites suitable for long-term open storage compete with other uses (although this is less applicable to sites with a development constraint such as overhead cables, easements or gas pipes underneath).
•
Many developers have been concluding that schemes will be built eventually rather than the site remaining in open storage use, even if development is delayed due to current market conditions. There has understandably been a reluctance to spend capital to create an interim open storage site, as investment over less than 5-8 years tends only to be viable where there is an existing slab / surface (even here, expenditure would still be required on items such as security for good quality sites).
•
However, current economic and market conditions are increasingly favouring longer-term open storage over developing an alternative use on a site. Debt has become more expensive, construction costs remain high, commercial property yields have shifted upwards, and residential values are falling, with added uncertainty due to rising interest rates. All of this has made development riskier. Conversely, the metrics of the open storage market have become more favourable.
•
For landowners, the capital expenditure and ongoing costs of an open storage site are much lower than developing and maintaining a building. Depending on the efficiency of a site and the gross to net ratio, it is conceivable that the overall value / return could be better for an open storage solution rather than for a new build. We think there is now an opportunity for investors and developers to re-evaluate whether open storage could work in the longer term in some higher value locations.
•
Development potential
We believe an increasing number of investors will see the potential to upgrade sites for longer-term open storage use, with current market conditions making this a more viable option.
•
There will continue to be an undersupply of open storage in urban areas given the natural constraints around land supply. However, we see no let-up in occupier demand, and an increase in the number of Class 1 sites as a proportion of the overall market, we expect further rental growth over the next year, ahead of most commercial property sectors.
•
It is currently quite difficult to value open storage sites, as relatively few property professionals have experience in the sector and there is still a lack of data. Indeed, as the market grows and matures, it will become more important to value open storage sites as a specific use in its own right, taking into account the quality of the site.
•
Market transparency will gradually improve, helped by innovations such as the Carter Jonas 4-tier classification system (see Table 1). Carter Jonas has further evolved this concept with a scoring system to provide a more accurate view on where a site is positioned within each tier.
•
The sector will become increasingly attractive from a sustainability viewpoint, as it is cushioned from the impacts of tightening MEES regulations given that any buildings tend to be small (and are often temporary structures) and energy use is generally low. The provision of surfacing will be an ongoing issue from a sustainability point of view, particularly as concrete is generally used for the surfacing of Class 1 sites. However, we think there is an opportunity for technical innovation to deliver environmentally friendly solutions to this problem.
•
Current Carter Jonas instructions
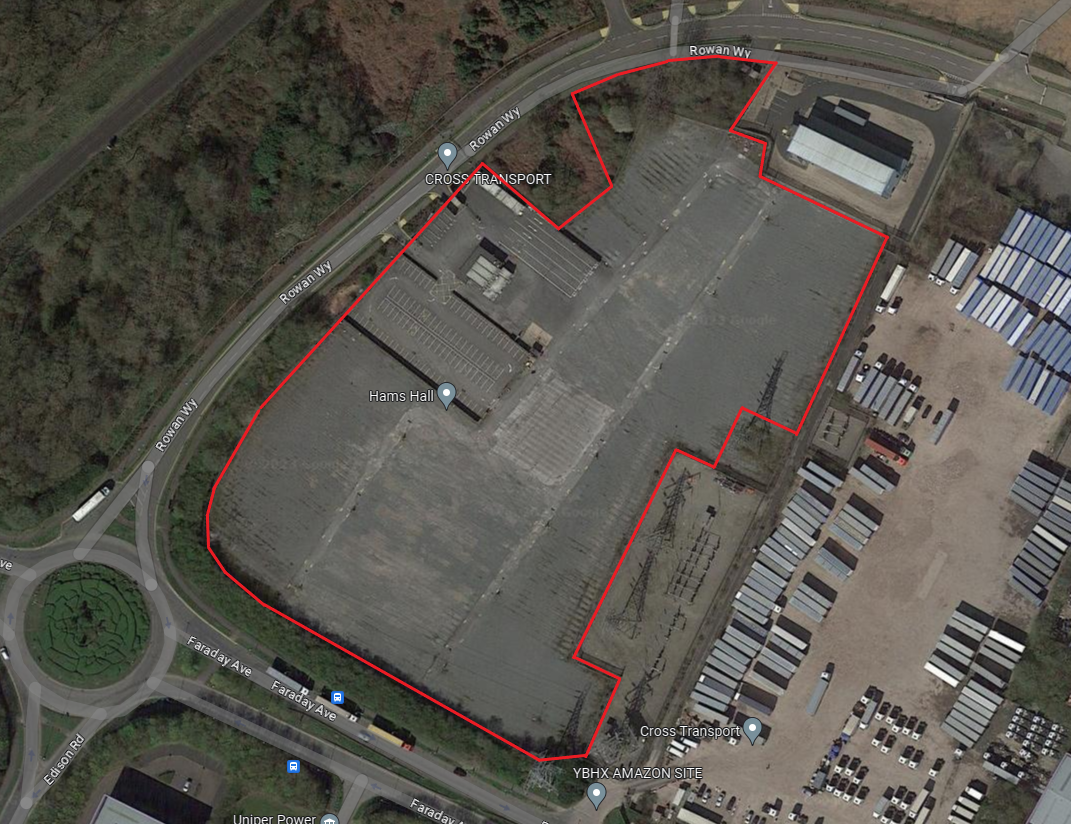
Hams Hall Distribution Park, Birmingham
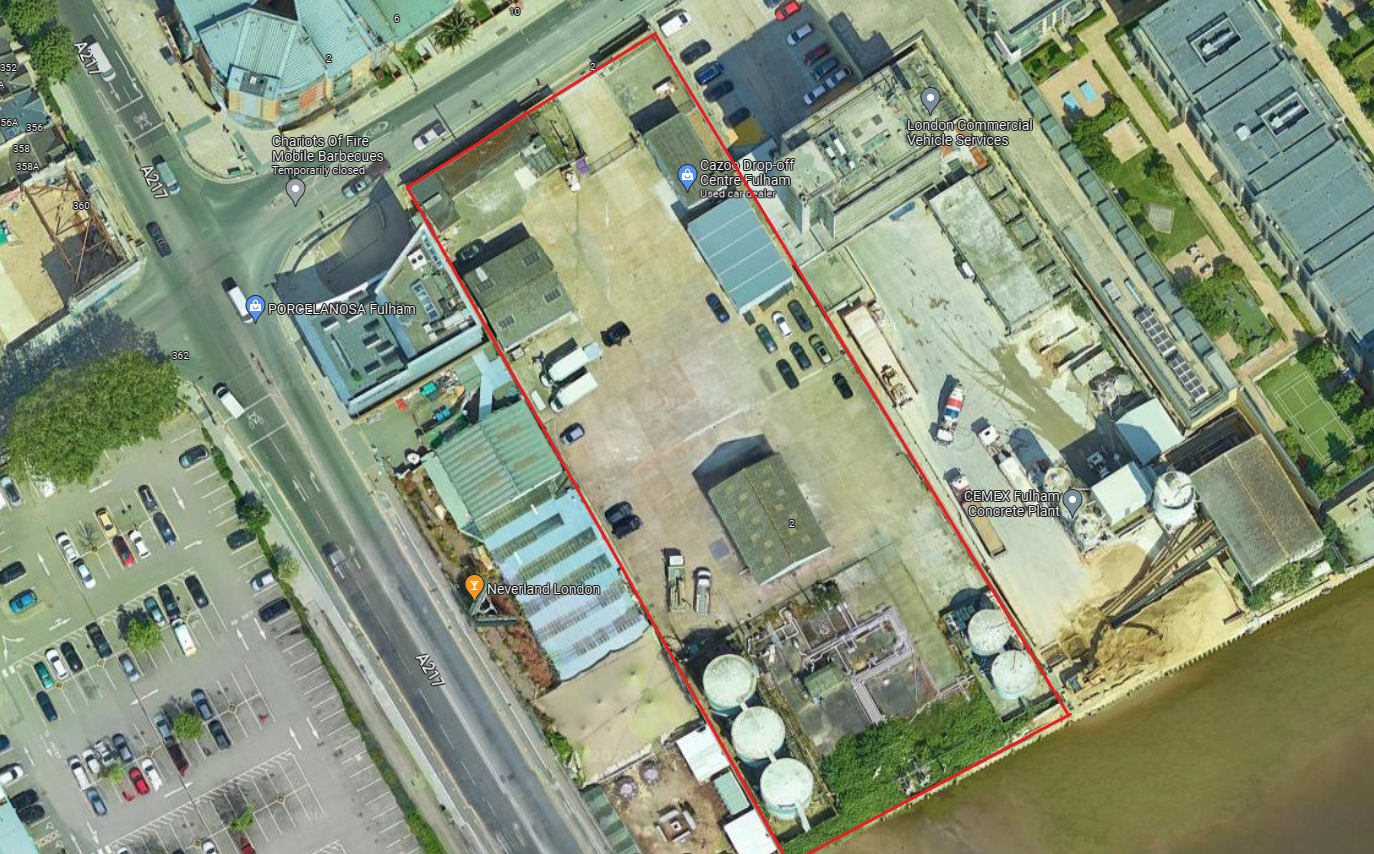


Swedish Wharf, London
1 Brooklands Road, Weybridge
6 Streatham Common, London
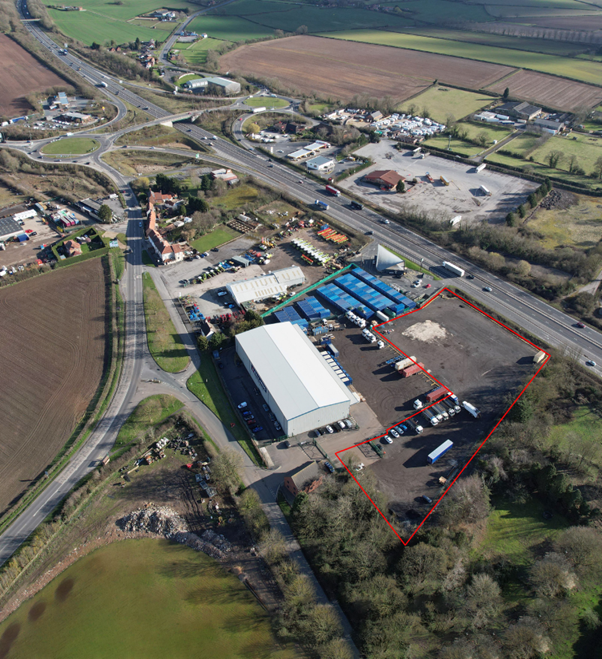
Markham Moor, Retford
Class (Matrix Score)
2 (72)
Details
Hardcore surface
Secure and fenced
Electricity, water, drainage
Size
2.03 acres
Quoting
£1.95 psf (£175,000 per annum)
Markham Moor, Retford, Nottinghamshire DN22 0TE

Class (Matrix Score)
2 (68)
Details
Concrete surface
Secure and fenced
Electricity, water, drainage
Size
0.73 acres
Quoting
£10.00 psf (£320,000 per annum)
6 Streatham Common, London, SW16 3BT

Class (Matrix Score)
1 (87)
Details
Concrete/ tarmac surface
Secure and fenced
Electricity, water, drainage
Size
8.6 acres
Quoting
£4.00 psf for concrete
£3.50 psf for tarmac
Hams Hall Distribution Park,
Coleshill, Birmingham B46 1AL

Class (Matrix Score)
1 (79)
Details
Concrete surface
Secure and fenced
Electricity, water, drainage
Size
1.4 acres
Quoting
£10.00 psf (£450,000 per annum)
Swedish Wharf, Townmead Road, London SW6 2SN

Class (Matrix Score)
1 (80)
Details
Concrete surface
Secure and fenced
Electricity, water, drainage
Size
1.35 acres
Quoting
£375,000 per annum
1 Brooklands Road,
Weybridge KT13 0TJ

Contact us
Email me

Archie Dupree
Lettings & Market Reports
+44 (0)7393 259922

Email me

Darren Shaw
Site & Development Acquisitions
+44 (0)7816 120706

Email me

Andrew Mitchell
Investment Acquisitions

Email me

Tom Bradley
Reviews & Renewals
+44 (0)7393 259 913

Email me

Ruobei Ding
Database Management & Assistant
+44 (0)7890 943482

Demand levels
Rental Trends
Investment Trends
Development Potential
Back to top

Back to top

Back to top

Back to top


Supply remains constrained, especially in major urban areas. As well as an overall shortage of sites, there is an imbalance in terms of the provision of high quality sites which are the focus of growth in the sector.
•
Figure 5: Open storage sites by region comapred with demand
Source: Carter Jonas, Agency Pilot, IAS
Proportion of open storage sites
Proportion of enquiries
•
•
•
•
Figure 8: Prime open storage rents, regional market
Source: Carter Jonas


Class
1
Details
Concrete surface
Secure and fenced
Electricity, water, drainage
Size
1.4 acres
Quoting
£10.00 psf (£450,000 per annum)
Swedish Wharf, Townmead Road, London SW6 2SN

Class
1
Details
Concrete surface
Secure and fenced
Electricity, water, drainage
Size
1.35 acres
Quoting
£375,000 per annum
1 Brooklands Road, Weybridge KT13 0TJ

Class
1
Details
Concrete surface
Secure and fenced
Electricity, water, drainage
Size
0.73 acres
Quoting
£10.00 psf (£320,000 per annum)
6 Streatham Common, London, SW16 3BT

Class
2
Details
Hardcore surface
Secure and fenced
Electricity, water, drainage
Size
2.03 acres
Quoting
£1.95 psf (£175,000 per annum)
Markham Moor, Retford, Nottinghamshire DN22 0TE

Email me

Andrew Mitchell
Investment Acquisitions
Email me

Darren Shaw
Site and Development Acquisitions
+44 (0)20 3940 9462
Email me

Tom Bradley
Reviews and Renewals
+44 (0)20 7062 3112
Email me

Archie Dupree
Lettings & Market Reports
+44 (0)20 7518 3306


Email me

Ruobei Ding
Database Management & Assistant
+44 (0)20 7298 1814


Explore each section of this report

New stock levels

Enquiry levels

Rents

Capital values

Yields

Click on the images to find out more
View full property listing
View full property listing
View full property listing
Minworth, Birmingham
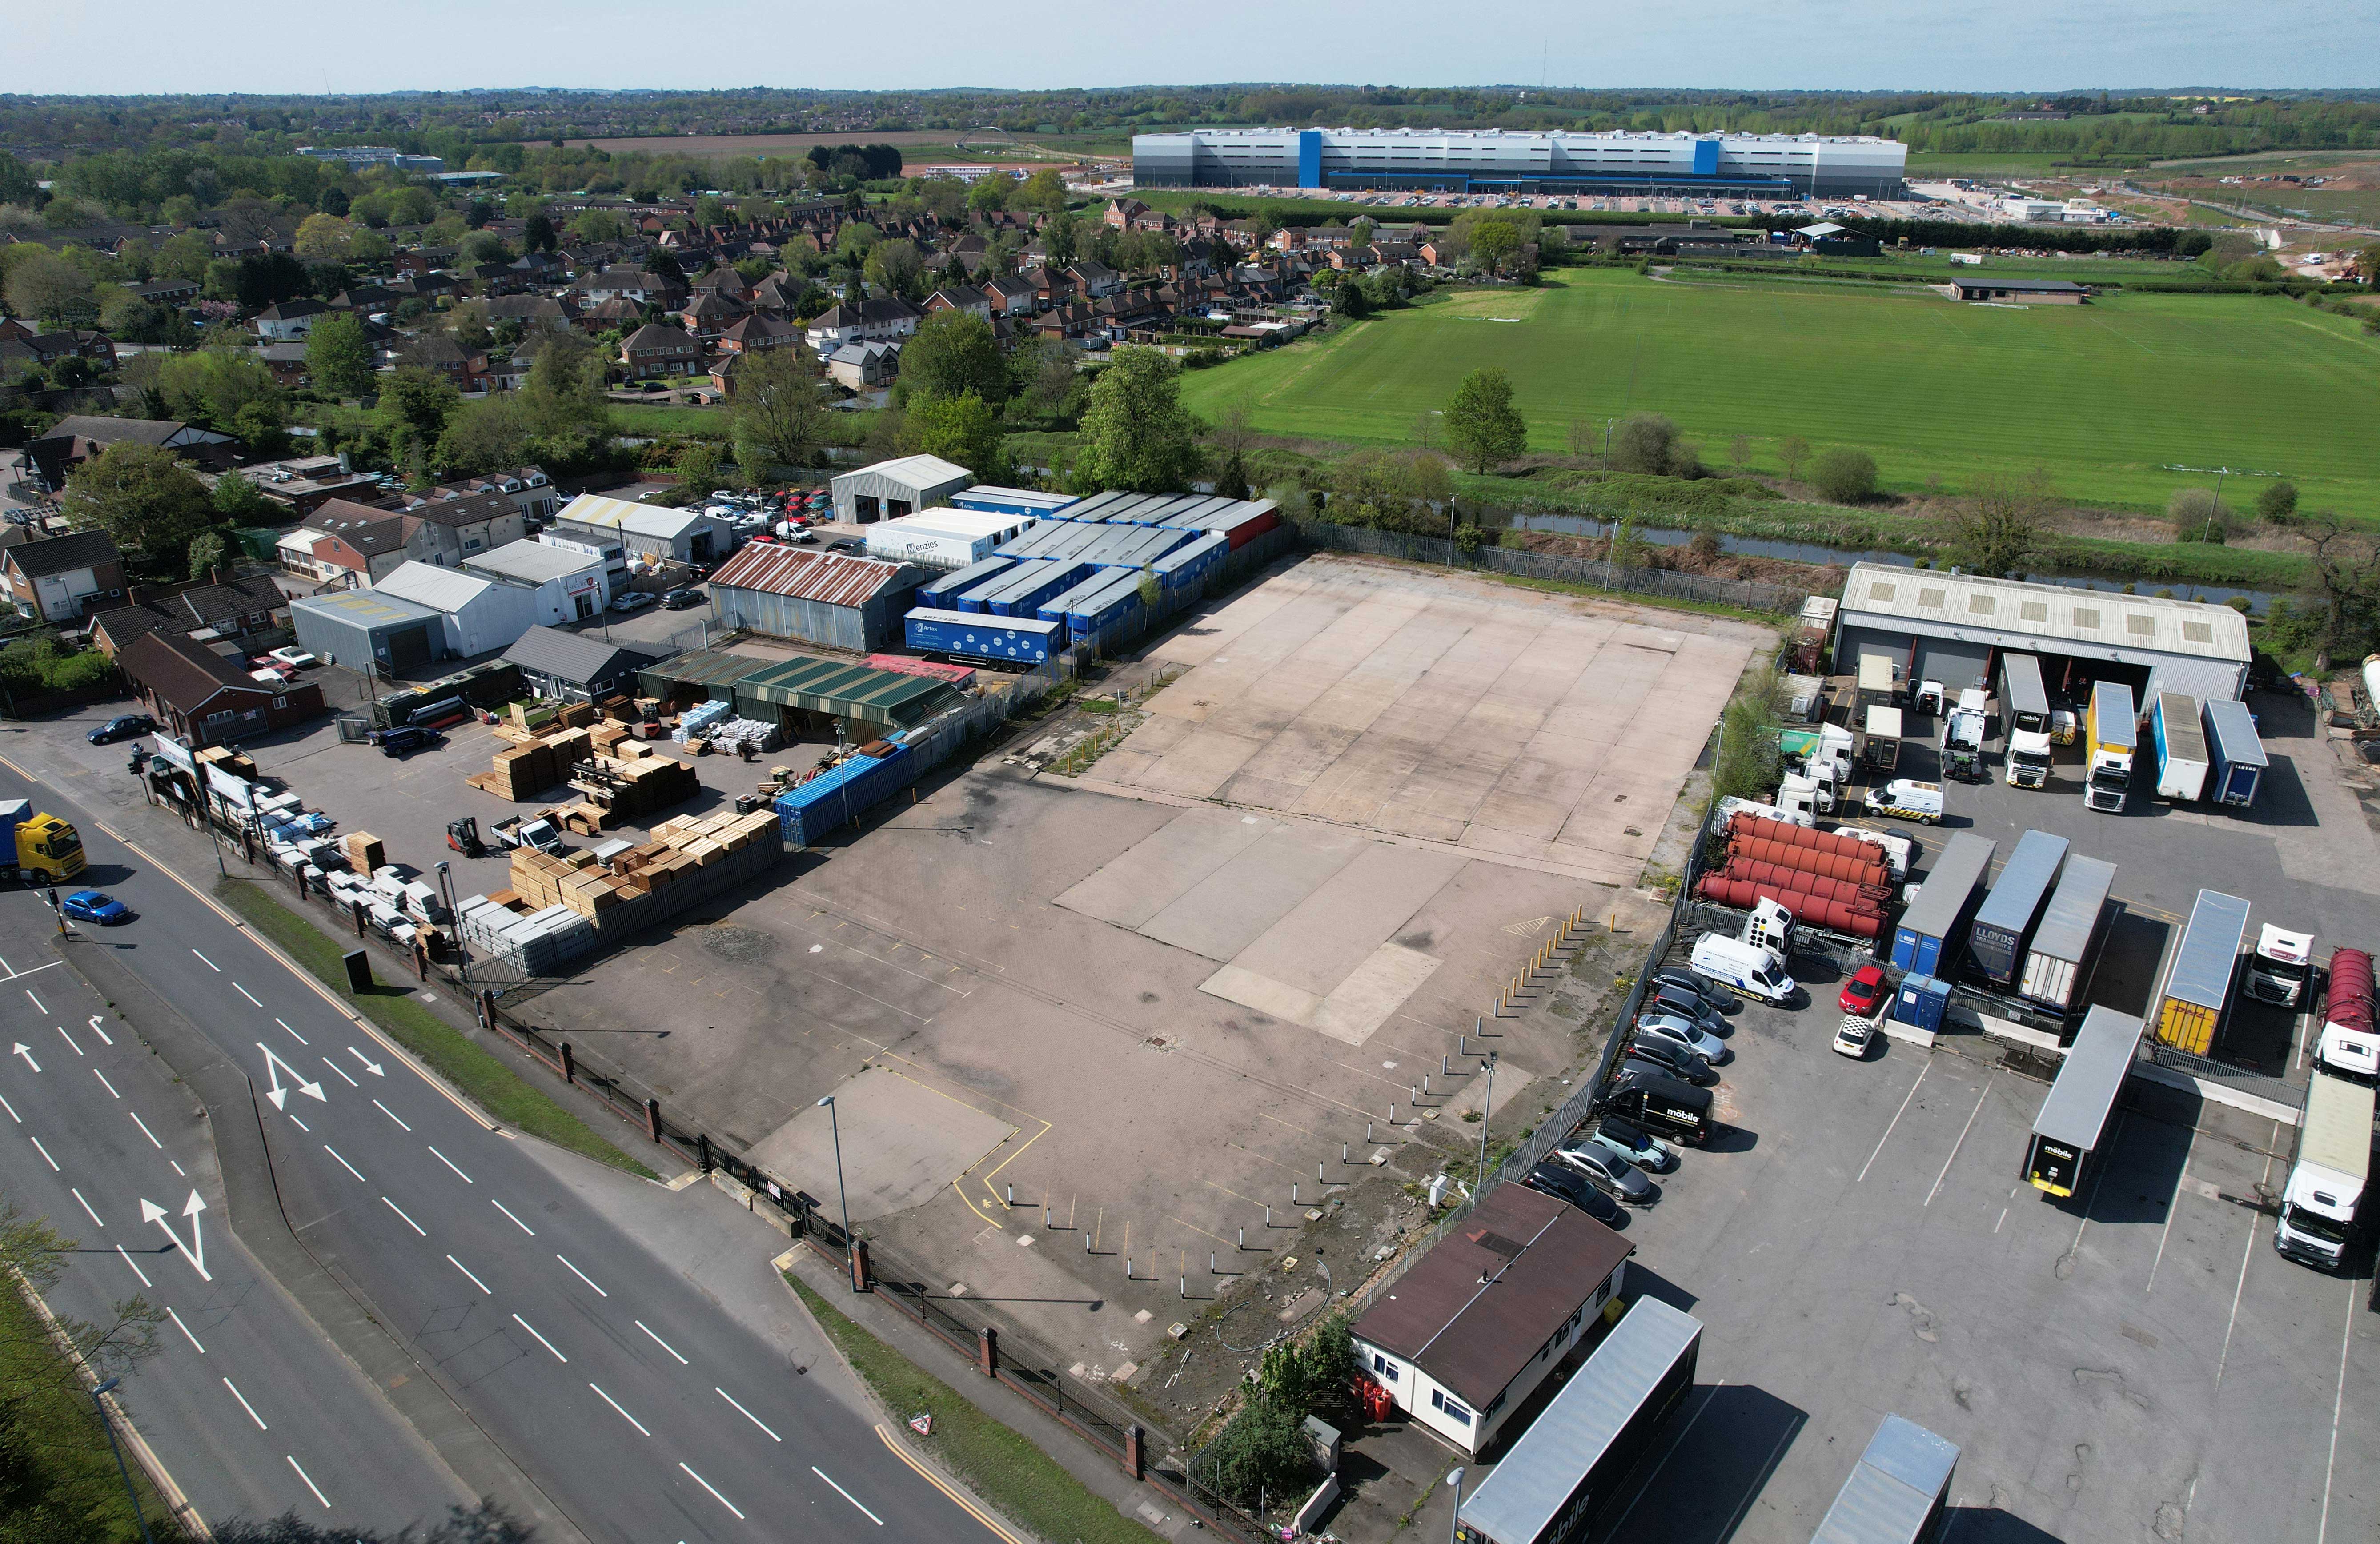
Class (Matrix Score)
1 (86)
Details
Block paving surface
Secure and fenced
Electricity, water, drainage
Size
1.5 acres
Quoting
£3.50 psf (£230,000 per annum)
Kingsbury Road, Minworth, Birmingham
B76 9DD

*image sourced from Google
*image sourced from Google
Class 1 (75 – 100)
Class 2 (50 – 74)
Class 3 (25 – 49)
Class 4 (0 – 24)
Class 1 (75 – 100)
Class 2 (50 – 74)
Class 3 (25 – 49)
Class 4 (0 – 24)
Class 1 (75 – 100)
Class 2 (50 – 74)
Class 3 (25 – 49)
Class 4 (0 – 24)
Class 1 (75 – 100)
Class 2 (50 – 74)
Class 3 (25 – 49)
Class 4 (0 – 24)
Class 1 (75 – 100)
Class 2 (50 – 74)
Class 3 (25 – 49)
Class 4 (0 – 24)
Class 1 (75 – 100)
Class 2 (50 – 74)
Class 3 (25 – 49)
Class 4 (0 – 24)
•
5
4
3
2
1
0
Email me

Lucy Groark
Open Storage Business Coordinator
+44 (0)7989 149209

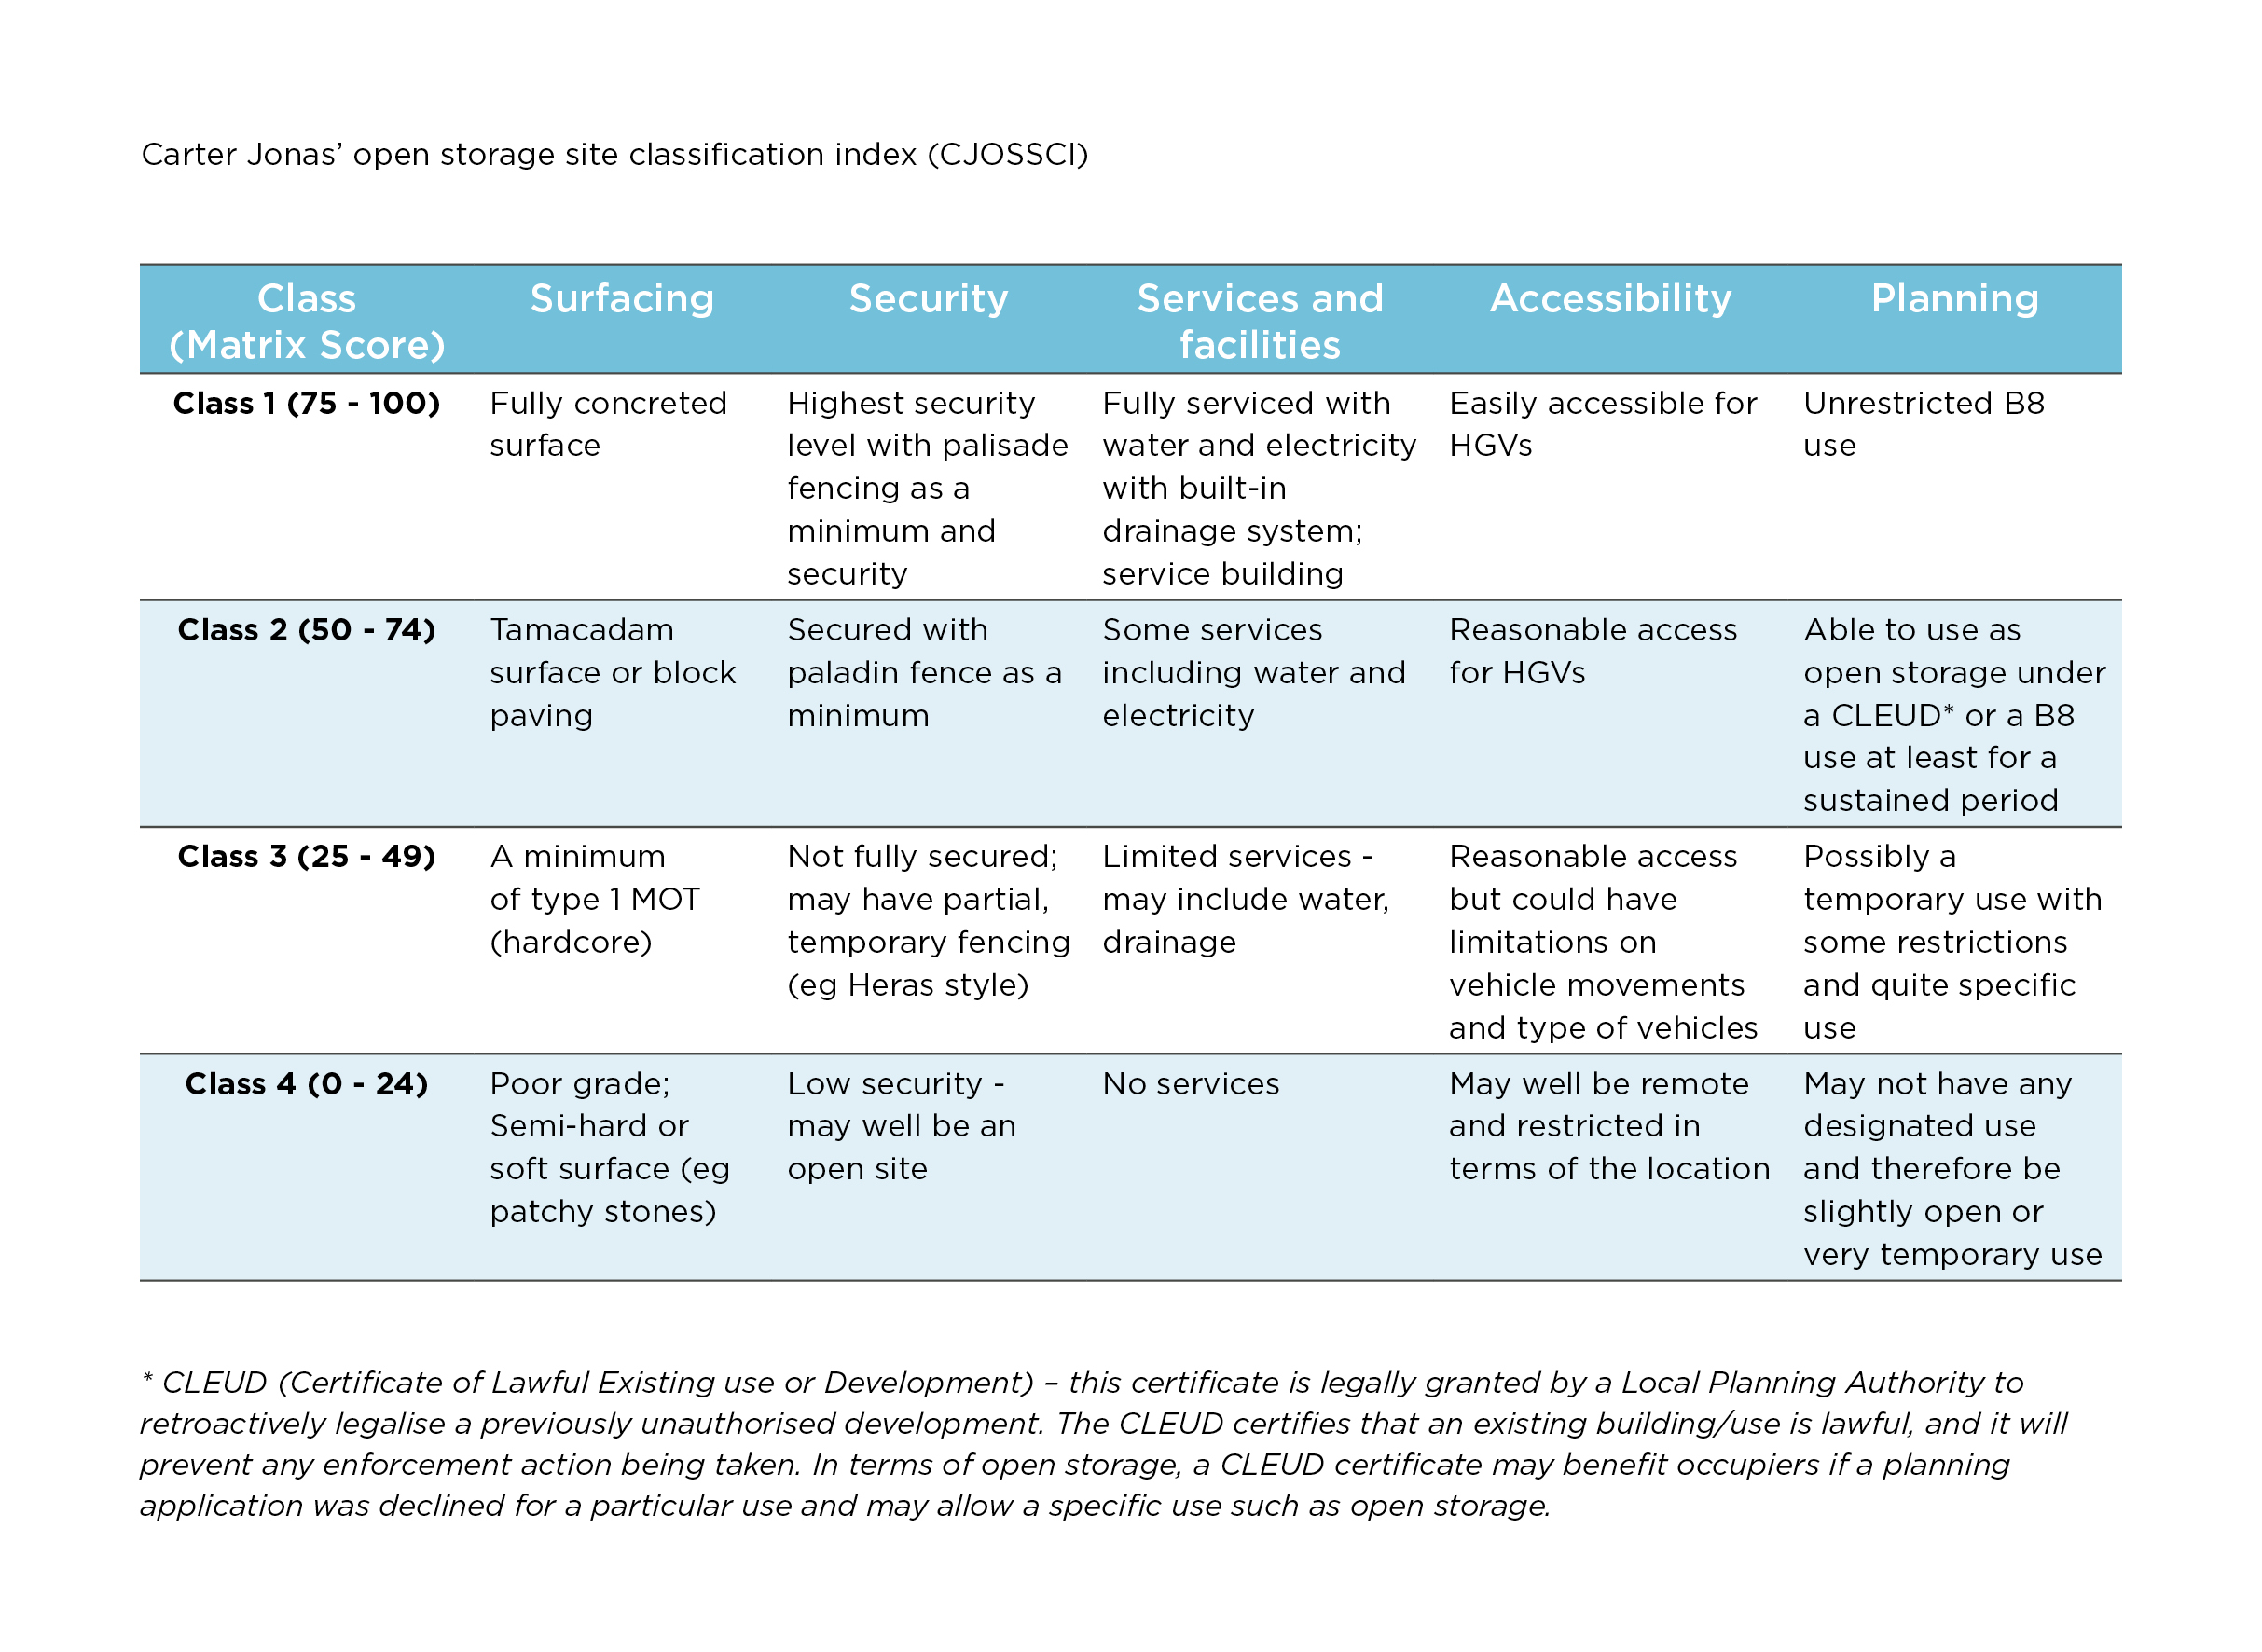
Table 1: Carter Jonas' open storage site classifiction index (CJOSSCI)


Email me

Daniel Francis
Head of Research
+44 (0)20 7518 3301


