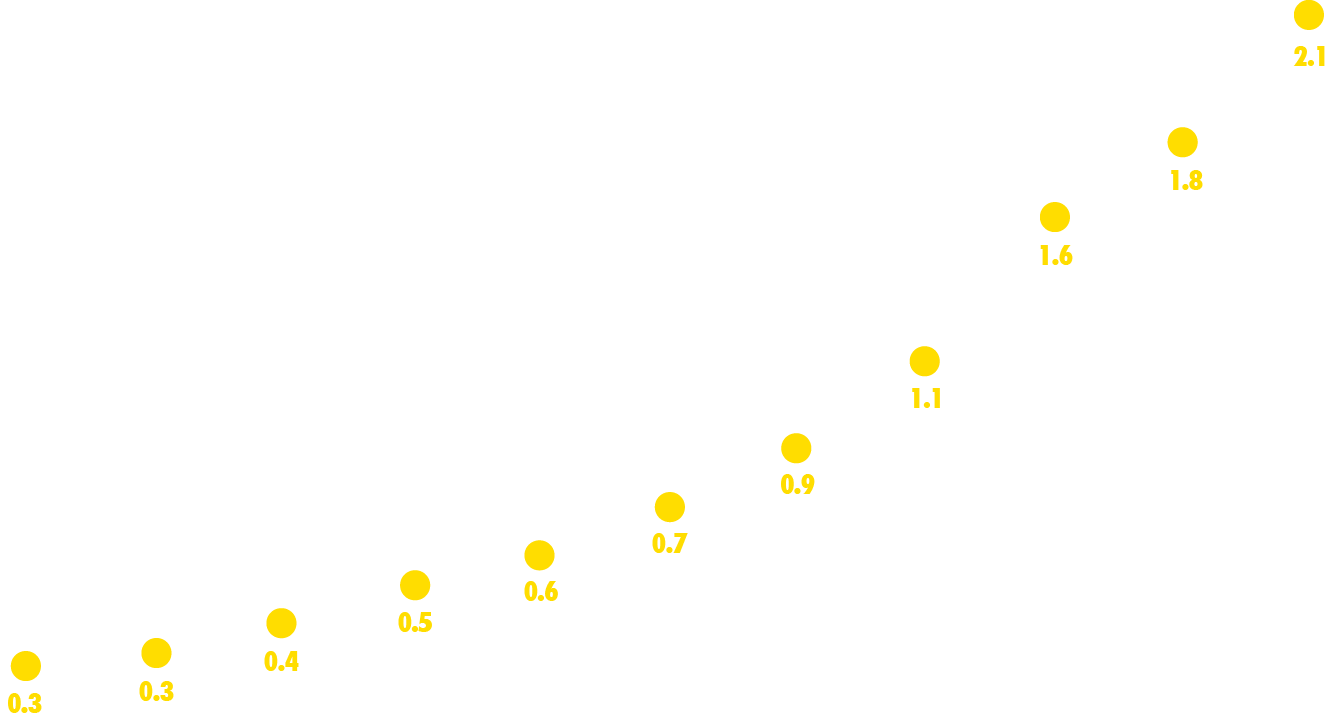
Note: Volume represents leased space and penetration represents flexible office as a percentage of overall office space across 40 markets in the U.S. *Forecasted as of year-end. Source: CBRE Research, Q2 2019.
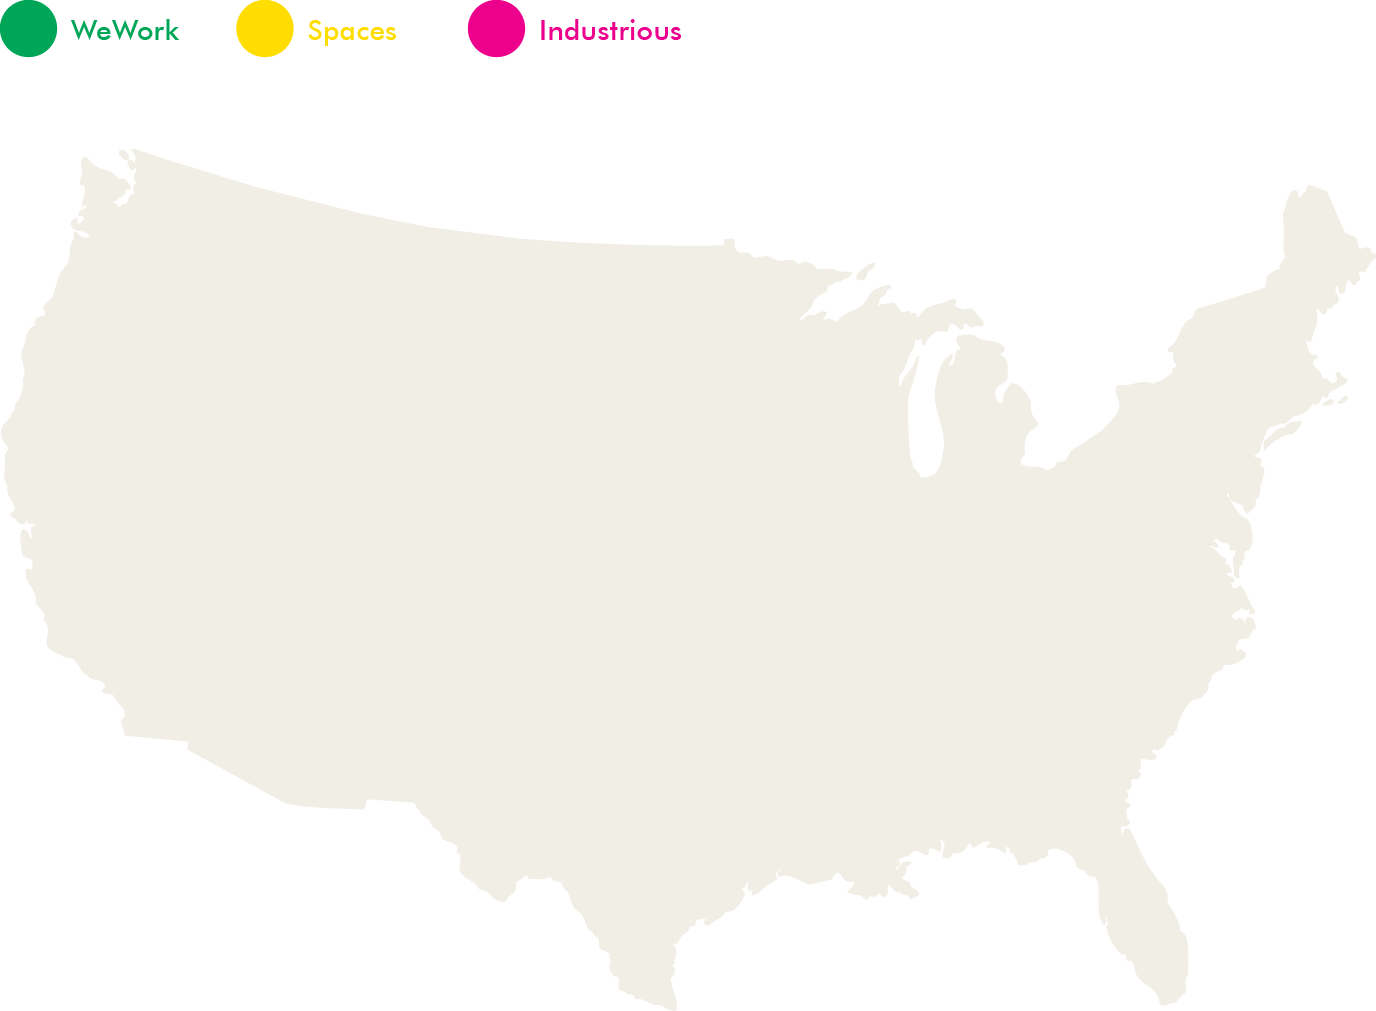
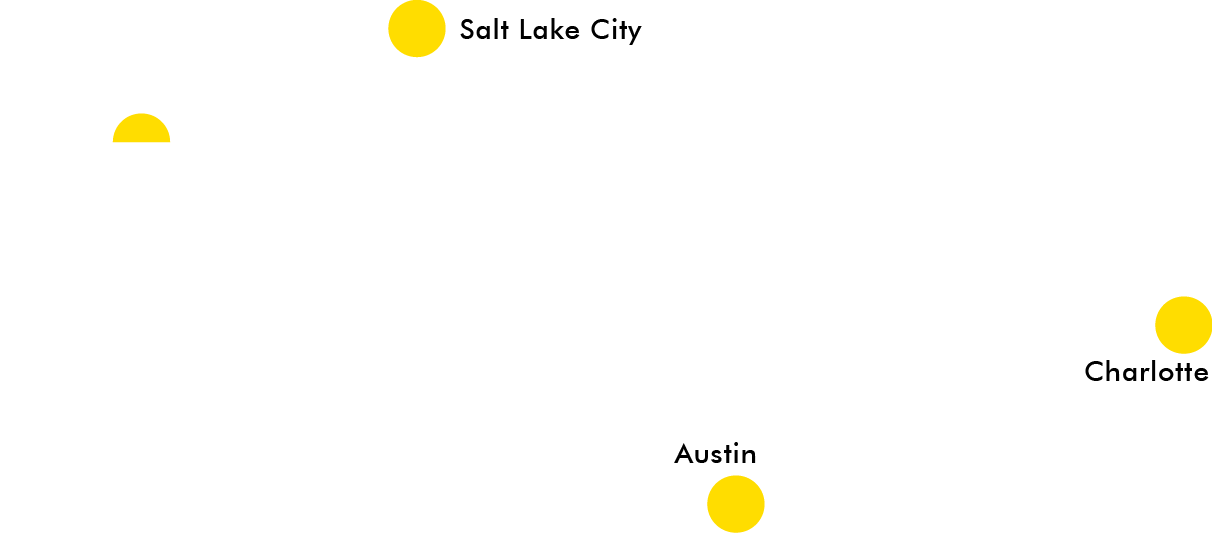
Source: CBRE Research, Q2 2019.
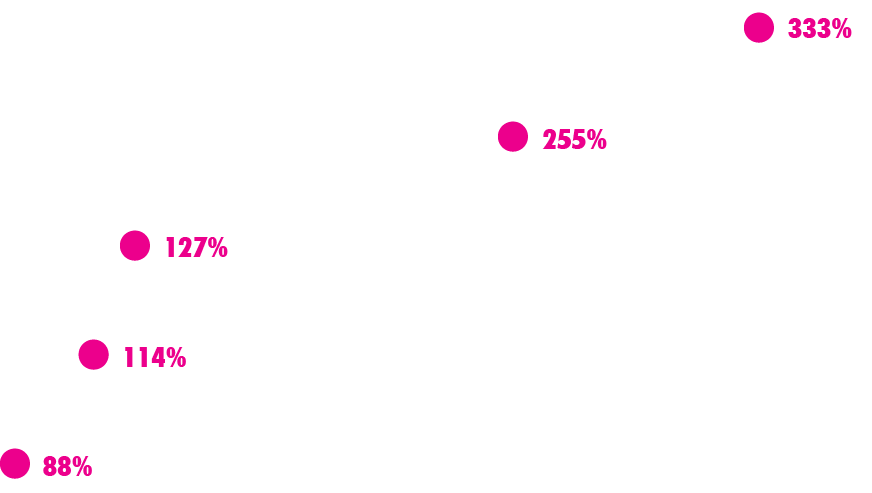
Note: Only includes markets that had existing space as of Q2 2018 and achieved 300k sq. ft. in increased footprint. Source: CBRE Research, Q2 2019.