Big-Box
Market Report
U.S. Research Report | 2022 Midyear Review & Outlook
North America

A variety of factors across North America have impacted demand for big-box industrial facilities. The surge of online shopping throughout the global COVID-19 pandemic increased demand for bulk industrial facilities, while economic uncertainty hindered consumer spending to some degree. Core markets including the Inland Empire, Dallas-Fort Worth, Atlanta, Chicago, Northern-Central New Jersey, Southern New Jersey-Eastern Pennsylvania and Toronto continue to be the destinations of choice for many occupiers, while emerging secondary markets that are near the fastest-growing population centers — and in close proximity to the most utilized logistics hubs in the region — continue to grow.
In this unique interactive report, we examine the North American big-box industrial market through the first half of 2022, which includes the seven core North American big-box markets and nine emerging secondary markets. We will highlight the fundamentals and look at demand factors, including demographics and logistics capabilities, and assess what lies ahead in the quarters ahead.
Introduction
Unless otherwise specified, all report data is through midyear 2022.
Download a PDF
Download a PDF
Supply chain delays and disruptions continued to impact the industrial sector and sparked immense change for occupiers of bulk product throughout North America. E-commerce growth has abated, but third-party logistics and manufacturing activity have surged, offsetting the dip in online retailers’ transactions. In fact, third-party logistics increased its market share of bulk transactions in the U.S. to 31.4% at midyear, up from 29.9% one year ago. A resurgence in U.S. manufacturing is also benefitting the industrial sector. This shift in occupancy resulted in more than 231.8 million square feet of occupancy gains at midyear, and nearly 92.5 million square feet of occupancy gains were recorded in the big-box market. This positive momentum in third-party logistics related to occupancy gains, is largely aided by more occupiers opting to outsource fulfillment and distribution.
Overview
North American
Building Inventory
Historical Data

200,000 - 499,999 SF
4,206
Big-box buildings
102
Fully vacant
1,105
Big-box buildings
36
Fully vacant
500,000 - 749,999 SF
976
Big-box buildings
23
Fully vacant
750,000+ SF


Northern California
Toronto
Northern-Central New Jersey
I-4 Corridor
Atlanta
Kansas City
Greater Phoenix
Dallas
Columbus
Cincinnati
Chicago
Indianapolis
Houston
Southern New Jersey
Inland Empire
Memphis
Robust demand for big-box product remained, however, bulk vacancy increased nominally to 0.7%, up from 0.4% year-over-year. The GTA maintains the second tightest big-box market with historically low vacancy and just three big-box facilities in the region that were fully vacant at midyear. Despite the slight rise in vacancy, industrial big-box average asking net rents in the GTA have set a new high mark, reaching $13.68 per square foot at the end of the first half of the year, a 12.5% increase year-over-year. While large blocks have historically attained pricing discounts, strong demand for all size ranges is leading to more unvaried lease rates. Tenants with immediate space requirements or who are nearing the end of their terms have no choice but to pay the current high-level rates.
View Properties
Download a PDF of the Report
A continued period of tightening and improving fundamentals is being exhibited across the greater Toronto area market. Larger buildings continue to be in limited supply and are hotly sought-after when they do become available for lease via new construction or backfill. E-commerce fulfillment companies are expanding their footprints at a rapid pace, along with the third-party logistics, food service, industrial supply and technology/pharmaceutical sectors, all seeing strong activity levels. Rapidly rising land and entitlement charges are pushing rents to higher and previously unrealized levels. Vacancy levels have remained low through 2021 into 2022 and are poised to remain low well into 2023."
"


Click each market for more information
Toronto
Canada

David Colley, SIOR
Senior Vice President,
Toronto West
Demand continues to outpace availability
View Properties
Download a PDF of the Report

547
Big-box buildings
2
Fully vacant
200,000 - 499,999 SF
51
Big-box buildings
1
Fully vacant
500,000 - 749,999 SF
55
Big-box buildings
0
Fully vacant
750,000+ SF

Building inventory
Historical data
For more U.S. research and analysis from Colliers International, visit U.S. Research.
Other Industrial Research Reports
- Q2 2022 U.S. Industrial Report
This document/email has been prepared by Colliers for advertising and general information only. Colliers makes no guarantees, representations or warranties of any kind, expressed or implied, regarding the information including, but not limited to, warranties of content, accuracy and reliability. Any interested party should undertake their own inquiries as to the accuracy of the information. Colliers excludes unequivocally all inferred or implied terms, conditions and warranties arising out of this document and excludes all liability for loss and damages arising there from. This publication is the copyrighted property of Colliers and /or its licensor(s). © 2022. All rights reserved. This communication is not intended to cause or induce breach of an existing listing agreement.
Historical data
Download a PDF
Download a PDF
Toronto
Canada
Southern New Jersey
Eastern Pennsylvania
New Jersey
Northern-Central
California
Northern
Memphis
Tennessee
Kansas City
Missouri
Inland Empire
California
Indianapolis
Indiana
I-4 Corridor
Florida
Houston
Texas
Phoenix
Arizona
Dallas
Texas
Columbus
Ohio
Cincinnati
Ohio
Chicago
Illinois
Atlanta
Georgia
Click on each market for more information

Historical data


On the heels of unprecedented absorption of 40 million square feet in 2021, Atlanta continues its heaping helping of big-box transactions with over 10.5 million square feet absorbed through Q2 2022. Atlanta’s vacancy is at historic lows, average rents are at all-time highs and climbing, and overall new construction is at record levels at more than 50 million square feet as tenant demand continues to outpace supply. Atlanta is poised for an epic year in 2022 with unrivaled growth, tenant demand, and asset valuation.
Ben Logue, SIOR
Senior Vice President & Principal,
Atlanta
"
View Properties
View Properties
Download a PDF of the Report
Download a PDF of the Report
Atlanta's bulk market bolstered its first quarter numbers by ending the first half of the year with more than five million square feet absorbed. Considering 2021 was a record year for occupancy gains, occupier demand remains high as year-to-date absorption still indicates a strong market in Atlanta. Transaction volume remains persistent as the first half of the year saw seven tenants move into space greater than 500,000 square feet. This has kept the overall vacancy rate for bulk product in Atlanta relatively low, at 4.4%, 190 basis points lower than the previous year.
Atlanta’s bulk market remains strong at midyear
Georgia
Atlanta
367
Big-box buildings
12
Fully vacant
200,000 - 499,999 SF
137
Big-box buildings
8
Fully vacant
500,000 - 749,999 SF
148
Big-box buildings
3
Fully vacant
750,000+ SF
Building inventory

Historical data


While demand for big-box product in Chicago dropped off during the first half of 2022 compared to the hyperactive demand witnessed during 2021, it was due to a lack of supply of available big-box buildings and record low vacancy. Over the coming quarters, developers will be making a big push to meet this demand, with a record amount of space breaking ground."
Jack Rosenberg, SIOR
National Director, Logistics and Transportation Group Principal,
Chicago
"
View Properties
View Properties
Download a PDF of the Report
Download a PDF of the Report
Through the first half of 2022, demand for Chicago’s big box industrial product persisted, as occupancy gains totaled 11.8 million square feet. A total of 5.1 million square feet was recorded during the second quarter and, while still strongly positive, it also represented the lowest quarterly total since the fourth quarter of 2020 and was nearly half of the record 9.7 million square feet recorded during the fourth quarter of 2021. The market, however, remains incredibly tight.
Developers pick up the pace in a tight big-box industrial market
Illinois
Chicago
505
Big-box buildings
7
Fully vacant
200,000 - 499,999 SF
106
Big-box buildings
2
Fully vacant
500,000 - 749,999 SF
95
Big-box buildings
2
Fully vacant
750,000+ SF
Building inventory

Historical data


The greater Cincinnati Industrial market has never experienced the level of demand seen during the first half of 2022. Year-to-date absorption figures set a record with 6.9 million square feet of total net absorption, a 109% increase year-over-year. The overall vacancy rate surpassed the first quarters record and fell to 2.3%. The last time the market experienced demand this strong during the first half of the year, was 2017 when demand was nearly 50% less. With the sixth-largest cargo airport in North America, an unparalleled geographic location, and limited supply of land, demand for bulk warehouse space is the driving force behind the exponential growth. Bulk warehouse space accounts for the majority of total net absorption and saw the sharpest decline in vacancy rates. With such strong demand, speculative construction activity is at an all-time high as well with more than eight million square feet of space currently under construction. A significant portion of which has already been pre-leased or sold. As strong demand continues to be sustained, the second half of 2022 will test the bulk industrial market. Millions of square feet of new supply will hit the market and it remains to be seen whether demand will remain at record levels into 2023. However, with over 1.5 million square feet of speculative supply being accounted for already, elevated activity will likely persist."
John B. Gartner III, SIOR
Senior Vice President & Principal, Cincinnati
"
View Properties
View Properties
Download a PDF of the Report
Download a PDF of the Report
The Cincinnati big-box market is particularly well-suited to meet the growing demand for faster delivery and the accompanying demand for warehousing and transportation. The year started off incredibly strong for the Greater Cincinnati industrial market as demand pushed the market past new heights. Cincinnati’s bulk market continued to post elevated occupancy levels as 5.1 million square feet of net absorption were recorded during the first half of 2022. This is nearly double the 2.6 million square feet recorded a year ago.
Bulk demand shatters
previous records
Ohio
Cincinnati
132
Big-box buildings
2
Fully vacant
200,000 - 499,999 SF
40
Big-box buildings
0
Fully vacant
500,000 - 749,999 SF
20
Big-box buildings
0
Fully vacant
750,000+ SF
Building inventory

Historical data


The Columbus market continues to see strong activity in warehouse space. However, we are at a point where new development, although record-breaking, cannot keep up with the demand that we're seeing. Moving forward, the region's strategic location will continue to attract top tenants and contribute to activity. Construction will also remain steady in coming years as developers try to keep up with demand from e-commerce and retailing companies."
Michael Linder, SIOR
Senior Executive Vice President,
Columbus
"
View Properties
View Properties
Download a PDF of the Report
Download a PDF of the Report
Strong momentum for the industrial big-box market continued at midyear for the Columbus market. Significant growth in third-party logistics has benefitted the Columbus big-box market as leasing activity increased 27% year-over-year. The largest leases of the year were signed by prominent retailers and third-party logistics companies, which continue to fuel activity in Central Ohio.
Columbus big-box activity continues to rise as strongdemand fuels the industrial sector
Ohio
Columbus
136
Big-box buildings
1
Fully vacant
200,000 - 499,999 SF
29
Big-box buildings
0
Fully vacant
500,000 - 749,999 SF
39
Big-box buildings
0
Fully vacant
750,000+ SF
Building inventory

Historical data


Dallas-Fort Worth continues to prove we can handle 45 million square feet of industrial development under construction, as we continue to be one of the leading cities in net absorption. As the fourth largest metropolitan area in the U.S., we are continuing to make strides to keep up with the continued growth. Across the entire country, we are only approximately 3.6% of total industrial inventory. With prime port markets facing supply shortages, the Dallas-Fort Worth market has benefited from being a prime e-commerce location. It’s a hot market and a hot city, but a great place to live."
Allyson Yost
Vice President,
Dallas
"
View Properties
View Properties
Download a PDF of the Report
Download a PDF of the Report
The Dallas-Fort Worth big-box market posted records in all major categories in 2021 which will be incredibly difficult to follow in 2022. Occupancy gains, while not as strong as a year ago, are still on pace to achieve an above-average year. However, with the continuation of the area’s population boom, there is no shortage of labor and developable land sites are abundant throughout the metroplex. Infill development sites, however, are in short supply as companies aim to relocate closer to the end customer and these coveted locations are difficult to acquire.
Construction activity
is still red hot
Texas
Dallas
465
Big-box buildings
17
Fully vacant
200,000 - 499,999 SF
128
Big-box buildings
9
Fully vacant
500,000 - 749,999 SF
92
Big-box buildings
4
Fully vacant
750,000+ SF
Building inventory

Historical data


Houston’s big-box market has seen continued positive absorption and new construction growth in 2021 and early 2022. Houston’s port saw its busiest year ever in 2021. Year-over-year, the port surpassed its previous high-water mark for total loaded twenty-foot equivalent unit volume increased 7%. Material shortages, increased consumer demand and labor shortages in other port markets are all contributing factors to the record growth. The massive e-commerce growth we saw in 2021 has seemed to temper a bit, but that has not stopped the absorption in the port market. Home Depot and Walmart have continued the rapid expansion of their distribution networks in the Houston MSA and across the U.S. 2021 retail sales were estimated at roughly $4.5 trillion. Within that total is e-commerce (non-store) sales, which have grown nearly 20% to a range of $1.09 to $1.13 trillion. Developers continue to deliver new product and seek viable land positions in Houston’s east and southeast submarkets to service this ever-expanding port activity. What remains to be seen is if land sellers and developers can find common ground in this rapidly changing market. The 100 basis point swing in cap rates will not allow a developer to pay the same amount for land that they could have just four months ago. In certain instances, developers are seeking up to a 30% price reduction in order to make their underwriting pencil."
Robert Alinger, SIOR
Principal & Director, Houston
"
View Properties
View Properties
Download a PDF of the Report
Download a PDF of the Report
Following a record year of construction deliveries, new supply took a noticeable dip at the start of 2022 as just 2.9 million square feet was delivered in the Houston area at midyear. This is in stark contrast to the 7.4 million square feet delivered last year at this time. The largest facility built in Houston thus far is an 800,000-square-foot distribution center for California-based plastics resin logistics company, Plastics Express, in Baytown. With fewer deliveries and increased occupancy, Houston’s big-box vacancy plummeted to 5.5%, down from 14.0% last year at this time.
Houston's industrial big-box market continues to grow in 2022
Texas
Houston
256
Big-box buildings
15
Fully vacant
200,000 - 499,999 SF
45
Big-box buildings
2
Fully vacant
500,000 - 749,999 SF
28
Big-box buildings
0
Fully vacant
750,000+ SF
Building inventory

Historical data


The record year we achieved in 2021 on the I-4 Corridor continues in 2022. National tenant demand remains robust, vacancy rates are at all time lows and the development pipeline has surpassed 10 million square feet. As the populations of Orlando and Tampa continue to merge into a megatropolis, the I-4 Corridor will be the beneficiary of this unprecedented growth."
David Wilson
Managing Director,
Orlando
"
View Properties
View Properties
Download a PDF of the Report
Download a PDF of the Report
The availability of big-box facilities remains low in the I-4 Corridor as there are only five existing facilities fully available in the region. The lack of 500,000-plus-square-foot product, especially, combined with growing demand for this size range from e-commerce and 3PL tenants, has created a significant opportunity for speculative development. A total of 5.5 million square feet remained under construction at midyear, including a 1.2-million-square-foot distribution center for Lowe’s (scheduled to be delivered by year-end), and a 1.2-million-square-foot speculative warehouse in the Orlando market.
Record activity continues
in Central Florida
Florida
I-4 Corridor
72
Big-box buildings
3
Fully vacant
200,000 - 499,999 SF
13
Big-box buildings
0
Fully vacant
500,000 - 749,999 SF
16
Big-box buildings
1
Fully vacant
750,000+ SF
Building inventory

Historical data


The Indianapolis Motor Speedway isn’t the only place where records are being shattered. The Indianapolis big-box market is on track to break last year’s historic leasing activity and construction levels. Even with all that new product hitting the market, tenants are finding it challenging to secure a space for any immediate needs. Developers are clamoring to keep up and stake their positions. We expect tenant demand in central Indiana to stay on pace through the back half of 2022."
Cam Kucic, SIOR
Senior Vice President, Indianapolis
"
View Properties
View Properties
Download a PDF of the Report
Download a PDF of the Report
The Indianapolis big-box market continued its rapid rate of growth at midyear. The market achieved 11.0 million square feet of leasing activity and is on-track to surpass the record-high 12.7 million square feet reached in 2021. Third-party logistics providers and packing companies are dominating this activity. In the last 24 months, they accounted for more than half of all new modern bulk transactions, including the largest five deals of Q2 2022. Investors and occupiers will continue to choose Indianapolis at a greater pace than other Midwest markets because of its strong labor force, pro-business environment and a plethora of logistics advantages. All of this translates to robust leasing, positive absorption, increased development and more investor interest in the region for the foreseeable future.
Record-high leasing volume
leading to new development
Indiana
Indianapolis
137
Big-box buildings
8
Fully vacant
200,000 - 499,999 SF
69
Big-box buildings
3
Fully vacant
500,000 - 749,999 SF
46
Big-box buildings
4
Fully vacant
750,000+ SF
Building inventory

Historical data


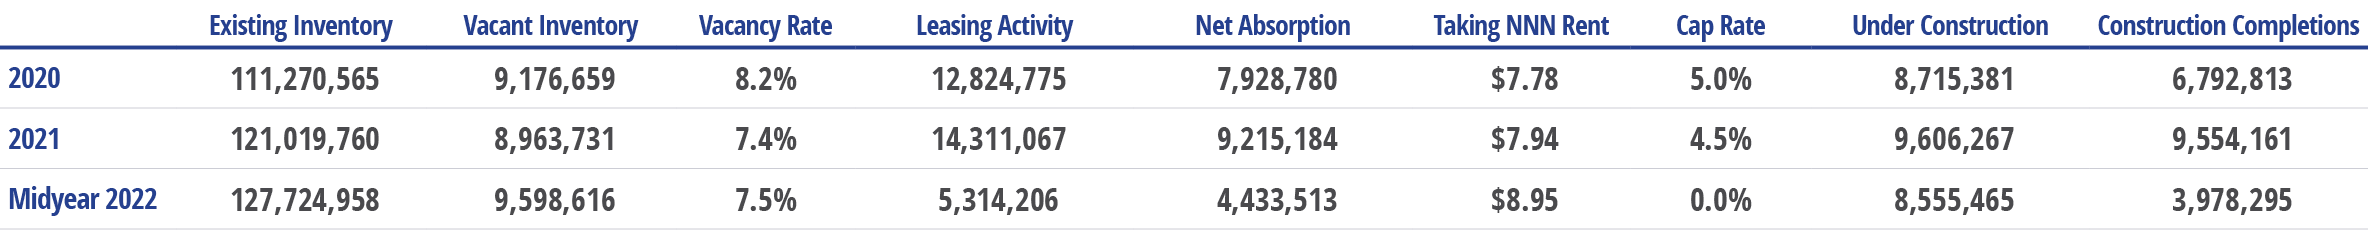
In the face of rising inflation and the rise in cost of energy, the Fed has been raising interest rates to put the brakes on what most fear, which is stagflation and a looming recession. If you view any type of media outlet, this is being pumped in your face daily. There have been some definite changes to the industrial real estate markets, most notably on the front of valuations. The cost of debt, volatility of the cost of debt and what that’s done to valuation underwriting has definitely impacted the markets. Cap rates, exit cap rates and backing down on rental rate escalation trends have adjusted the soaring valuations of assets and land. All that said, the sheer fundamentals of the Inland Empire industrial real estate market have been solid. Overall vacancy is 0.3% and buildings over 500,000 square feet is 0%. Buildings currently under construction are at an all-time high of 29.9 million square feet with 5.3 million square feet of completions year-to-date which is still not providing enough inventory to hold up the Inland Empire’s prior absorption levels. Currently, gross absorption is 15.6 million square feet and net absorption is 4.3 million square feet. We’ve now achieved our 52nd straight quarter of positive net absorption. With these fundamentals in place and tenant demand remaining strong, rental rates have increased 35% year-over-year on average. Overall predictions for the remainder of the year is that absorption will remain constant, vacancy will remain low and rental rates will still continue to increase beyond what most investors are underwriting."
Mark Zorn, SIOR
Vice Chair,
Inland Empire
"
View Properties
View Properties
Download a PDF of the Report
Download a PDF of the Report
Leasing activity in the Inland Empire totaled 10.2 million square feet, while net absorption plummeted year-over-year to 4.3 million square feet due to the lack of vacant existing space. Construction completions totaled 5.4 million square feet with most buildings leased prior to completion. These totals, while nowhere near record-level activity, remain impressive given the lack of available big-box options in the Inland Empire. This lack of available space caused overall vacancy to plummet to a historic low of 0.3%, making the Inland Empire the only bulk market in the U.S. with vacancy lower than 1.0%. There are no fully-vacant buildings above 500,000 square feet available in the Inland Empire.
Vacancy hits historic low as rents continue to soar
California
Inland Empire
486
Big-box buildings
2
Fully vacant
200,000 - 499,999 SF
143
Big-box buildings
0
Fully vacant
500,000 - 749,999 SF
126
Big-box buildings
0
Fully vacant
750,000+ SF
Building inventory

Historical data


The Kansas City market continues to be a thriving industrial market with robust activity. E-commerce activity continues to push new industrial development to previously unseen levels throughout the metro. Kansas City’s low vacancy rates and strong market fundamentals continue to be the driving force for future speculative construction. Industrial users look to place their operations in Kansas City as a result of ideal geography, established infrastructure and steady supply of speculative development."
Ed Elder
President,
Kansas City
"
View Properties
View Properties
Download a PDF of the Report
Download a PDF of the Report
Bulk industrial activity in Kansas City remains active as more occupiers look to place operations within the market. By midyear, the overall vacancy rate for big-box facilities increased to 9.4%, up over the 8.0% recorded one year ago, largely due to the number of speculative projects that delivered vacant. Occupancy gains totaled 4.5 million square feet, up 17.6% over midyear 2021. Absorption totals are expected to increase further in the second half of the year based on the timing of several new industrial buildings slated to be delivered in Q3 and Q4 2022. Current industrial real estate demand is a direct result of distribution growth and expanding e-commerce traffic. Occupiers are striving to modernize and expand existing supply chains to accommodate the accelerating pace of the market.
E-commerce activity continues to drive new industrial development
Missouri
Kansas City
90
Big-box buildings
2
Fully vacant
200,000 - 499,999 SF
34
Big-box buildings
2
Fully vacant
500,000 - 749,999 SF
15
Big-box buildings
1
Fully vacant
750,000+ SF
Building inventory

Historical data


Building on momentum from 2021, Memphis has continued to see new development activity across all submarkets. Record setting big-box absorption of 5.9 million square feet at the mid-year point has set the tone for this year and driven continued new specualtive development. In the first half of 2022, there have been eleven new deals over 100,000 square feet, totaling 6.7 million square feet. This velocity has spurred new development of 12.9 million square feet under construction. The second half of 2022 will continue to see positive absorption and robust rate growth due to the continued demand of big-box uers across mulitple sectors, including medical, e-commerce and 3PLs."
Tim Mashburn
Senior Vice President & Principal, Memphis
"
View Properties
View Properties
Download a PDF of the Report
Download a PDF of the Report
Memphis’ big-box industrial market continued its healthy pace of growth at midyear. Significant growth in distribution and third-party logistics firms has benefitted the Memphis bulk market as occupancy gains increased 21.4% over this time last year and totaled 5.9 million square feet. Third-party logistics firms supporting the retail and e-commerce industries accounted for more than half of all big-box absorption, with companies including Medtronic Logistics, K Power Logistics, FedEx and Advanced Warehouse all taking bulk space during the first half of the year. Leasing activity also remained elevated and totaled 14.2 million square feet. 11 transactions greater than 100,000 square feet were signed by midyear, totaling 6.7 million square feet.
Big-box momentum soars to new highs
Tennessee
Memphis
108
Big-box buildings
7
Fully vacant
200,000 - 499,999 SF
52
Big-box buildings
0
Fully vacant
500,000 - 749,999 SF
64
Big-box buildings
3
Fully vacant
750,000+ SF
Building inventory
Historical data


Northern California continues to prosper at a sustainable rate despite speculation of a looming recession. Headwinds created by increased construction costs, supply chain disruption, interest rate hikes, lack of labor, and runaway inflation have softened pre-leasing activity and construction starts from last year’s record pace, however, market fundamentals remain strong. Demand for big-box space continues to outpace supply, keeping vacancy rates low and putting continued upward pressure on rental rents. The momentum in Northern California shows very few signs of slowing with no drastic changes expected in the foreseeable quarters, but market activity will likely moderate from the record run of the last two years."
Tommy Ponder, SIOR
Executive Vice President, Sacramento
"
View Properties
View Properties
Download a PDF of the Report
Download a PDF of the Report
Strong demand across Northern California continued with 4.4 million square feet of year-to-date net absorption only 5% below 2021’s record pace. As demand still outpaces supply, asking rents continue to rise across all markets. The regional vacancy rate ticked up 20 basis points from year-end 2021 to 7.5% but is still 120 basis points below Q4 2020’s vacancy rate. Williams Sonoma leased 1.1 million square feet in Tracy at Prologis’ International Park of Commerce in a Colliers-brokered transaction. The state-of-the-art cross-docked building located 46 miles from the Port of Oakland features a 50-foot clear height with 194 dock-high doors. Modular homebuilder Veev subleased 507,000 square feet from Amazon in the East Bay submarket of Hayward. In addition, future demand in the Central Valley could come from companies in the Inland Empire, where vacancy sits at 0.5% and rents have doubled in the last two years.
Market fundamentals remain strong despite economic headwinds
California
Northern California
204
Big-box buildings
9
Fully vacant
200,000 - 499,999 SF
57
Big-box buildings
2
Fully vacant
500,000 - 749,999 SF
32
Big-box buildings
1
Fully vacant
750,000+ SF
Building inventory

Historical data


With a dearth of availability in New Jersey, developers continue to break ground on industrial projects as the state currently has 13.9 million square feet under construction, a 17.5% increase year-over-year, as 3.2 million square feet was delivered through the first half of 2022. The addition of the new inventory where just 1.6% of the inventory is available for lease, provides opportunities for occupiers that did not previously exist. New Jersey though has experienced a slowdown in pre-leasing as developers have held off on leasing buildings under construction to achieve higher rents upon completion. Pricing for new construction in the Port and Meadowlands submarkets continue to achieve taking rents above $20 per square foot, while pricing guidance in the Exit 8A and 7A submarkets are north of $13 per square foot."
Doug Bansbach
Executive Managing Director, Woodbridge
"
View Properties
View Properties
Download a PDF of the Report
Download a PDF of the Report
New Jersey's industrial market continued to show remarkable market fundamentals amid supply constraints which resulted in a reduction of the square footage leased during the first half of the year. Leasing activity totaled 6.8 million square feet through the first two quarters of 2022, a 51.4% decrease year-over-year. Despite a slowdown in leasing activity, positive net absorption continued in New Jersey at 2.4 million square feet, as occupancy gains continued to be driven by occupied new deliveries. Bulk occupiers contributing to absorption at midyear included Volkswagen, Keurig, FedEx and List Logistics.
Leasing volume falls amid supply constraints
New Jersey
Northern-Central
206
Big-box buildings
3
Fully vacant
200,000 - 499,999 SF
49
Big-box buildings
1
Fully vacant
500,000 - 749,999 SF
43
Big-box buildings
2
Fully vacant
750,000+ SF
Building inventory

Historical data


Historical data

"

The Phoenix big-box industrial market is setting records and continues to impress investors and developers alike. 2021 was another banner year for absorption and 2022 is shaping up to be even more impressive. Phoenix rents continue to escalate and new construction starts will exceed 36 million square feet in 2022. The Loop 303 corridor in the Southwest Valley offers regional users the logistics necessary to serve the entire Southwest with larger footprints exceeding one million square feet.
We expect 2022 occupancy gains to exceed 25 million square feet, and that is up almost 10% over last year’s record of 23 million square feet. We may have headwinds in capital market transactions, but so long as rents continue to accelerate, Phoenix industrial will stay on everyone’s radar."
Don MacWilliam
Executive Vice President, Phoenix
"
View Properties
View Properties
Download a PDF of the Report
Download a PDF of the Report
Phoenix's industrial activity remains strong as more occupiers relocate to the market. At midyear, the overall vacancy rate for big-box facilities plummeted to just 3.3%, down from 12.1% one year ago. This marks the lowest recorded vacancy rate for bulk product in Phoenix. The big-box market in Phoenix was largely fueled by retailers and third-party logistics companies, with companies including Amazon, Funko, Best Buy, and Cornerstone Shared Services all occupying more than 700,000 square feet each in the first half of the year. As a result, occupancy gains totaled 8.3 million square feet, a 64% increase over the previous year and the market has already absorbed more inventory than all of 2021.
Construction is not stopping
Arizona
Phoenix
129
Big-box buildings
3
Fully vacant
200,000 - 499,999 SF
31
Big-box buildings
1
Fully vacant
500,000 - 749,999 SF
21
Big-box buildings
1
Fully vacant
750,000+ SF
Building inventory

As occupiers work to resolve global supply chain issues, demand will likely continue at its record-setting pace. Demand continues to outpace supply despite the high level of new construction. This imbalance will exert upward pressure on rental rates for the foreseeable future. Large amounts of capital chasing fewer sale offerings have resulted in record-high building sale prices and low capitalization rates. Strong competition for infill land sites along the I-95 corridor has caused FAR prices to skyrocket."
Mark V. Chubb
Senior Managing Director & Principal, Conshohocken
"
View Properties
View Properties
Download a PDF of the Report
Download a PDF of the Report
Bulk vacancy levels plummeted year-over-year to 2.1%, down from 6.9% the previous year as increased occupancies and new pre-leased speculative product continues to be delivered. 11.6 million square feet of new supply added 1.8 million square feet of vacant product. Robust occupier demand and limited availability also fuel construction activity in this market. A total of 39.8 million square feet remained under development at the end of the second quarter. Occupier demand persists in this region and companies continue to modernize their omnichannel approach. As such, a lack of large-format vacancies (greater than 750,000 square feet) is driving the development boom in this market.
Record high occupier demand has driven vacancy to the lowest level in a decade
Eastern Pennsylvania
Southern New Jersey
366
Big-box buildings
9
Fully vacant
200,000 - 499,999 SF
121
Big-box buildings
1
Fully vacant
500,000 - 749,999 SF
136
Big-box buildings
1
Fully vacant
750,000+ SF
Building inventory