Growth potential, guaranteed income
Zone Income™ | Client Guide
Planning for your future doesn’t have to be intimidating. CUNA Mutual Group helps take
the risk out of retirement

See how we do it
The retirement landscape
Risk control
Zone income
Our value
Disclosure: CUNA Mutual Group Zone Income Annuities are issued by MEMBERS LIFE INSURANCE COMPANY, a stock life insurance company. Not a deposit • Not guaranteed by any bank or credit union • May lose value. Not FDIC insured • Not insured by any federal government agency.
Financial markets
Personal factors
The retirement landscape
Growth with risk control and access to income are key components to achieving a comfortable, confident retirement
Market volatility
Interest rates
We’re part of a growing global investment marketplace that seems wildly unpredictable.
Market volatility
Yahoo Finance, https://finance.yahoo.com/quote, January 2020. Past performance is no guarantee of future results. You may not invest directly in an index.
Over time, the markets go in cycles — sometimes up, sometimes down. There are both day-to-day fluctuations and long-term trends.
U.S. Department of the Treasury and Ibbotson/Morningstar Fundamentals for Investors, 2018.
There generally is an inverse relationship between bonds and interest rates. Bond yields tend to rise when interest rates fall and vice versa. In a rising interest rate environment, bond returns can lag other investment options.
Interest rates can impact so-called “safe” investments like bonds and CDs, and that may make it difficult to earn a reasonable return.
Interest rates
Longevity
Rising costs
Longevity is one of the biggest risks faced by those planning retirement. How much money do you need, and for how long?
Most of us are living longer, more active lives, but often without the pension plans of the past
Longevity
Chance that a 60-year-old couple will have one person live to age 80
1


87%
Adults in the U.S. will require long-term care during their lives, requiring more health care savings
2


7 in 10
The longer you spend in retirement, the harder your money has to work to counter the effects of inflation.
Inflation steadily reduces the purchasing power of a retirement nest egg
Rising costs
Sources
First Class postage
$0.243
$0.554
2019
1987
$1.584
$2.384
$10,2304
$36,7186
$236,5007
$82,1829
$0.653
$0.893
$3,1905
$10,3052
$92,0007
$13,8668
One dozen eggs
Gallon of gas
1 year college tuition
New car
New house
1 year nursing home
Life expectancy calculations are based on mortality data from the Society of Actuaries Retirement Participant 2014 Table.
US National Library of Medicine, ncbi.nlm.nih.gov, An Empirical Study of Chronic Diseases in the United States: A Visual Analytics Approach to Public Health, March 1, 2018.
The People History, “1987,” 2019.
The People History, “Our Price Basket,” 2019.
CNBC, “Here’s how much more expensive it is for you to go to college than it was for your parents,” 2017.
CNBC, "Car prices are increasing—here’s how that can hurt Americans," October 22, 2019.
U.S. Census Bureau, “Median and Average Sales Prices of New Homes Sold in United States,” 2019.
U.S. National Library of Medicine, National Institutes of Health, “Trends in Nursing Home Expenses, 1987 and 1996,” 2013.
SeniorLiving, “Nursing Home Costs,” 2019.
Avoiding risk altogether offers no chance for growth, and many growth-oriented investments don’t offer the opportunity for income. CUNA Mutual Group Zone Income Annuity provides an innovative approach to market-linked risk control combined with income for life.
Traditional investment diversification doesn’t offer protection
Risk control
With Zone Income, you’re in control
You can set your downside limit — called a floor — along with a corresponding cap on the upside.
Once the floor is set, you can’t lose more than that, no matter what happens in the markets, while still enjoying the potential for attractive market growth.
Plus, Zone Income adds powerful protection against living longer than your assets.
Zone Income lets you enjoy growth opportunities, without the worry of catastrophic loss.
Learn more about our approach to risk control
Set your comfort zone with an income guarantee
Index-linked performance, with limits on loss
The power of
risk control
Missing best and worst days linked to S&P 500
Lock in the gain, lock
out the loss
Your investment allocation
Risk vs. reward
When you purchase Zone Income, you decide how much of your payment to allocate to the annuity’s allocation options. Three options link performance to a market index and one invests at a declared rate.
The Zone Income Annuity is an insurance contract that offers index-linked returns, a limit on market losses and lifetime income
Set your comfort zone with an income guarantee.
The Secure Account has a declared rate cap and a 0% floor. These dollars are safe from market downturns and receive modest growth potential.
The Growth Account has a higher declared cap and a -10% floor. These dollars can experience limited losses if the market is down, but when it’s up they have more room to grow.
Your risk control allocations are not an investment in any underlying fund portfolio. Instead, interest and guarantees are based on your contract with MEMBERS Life Insurance Company and its claims paying ability.
1.
2.
For allocations linked to an index, you then choose how much to place into two risk control accounts, each with its own range of possible investment performance.
In addition to blending your allocation between allocation options, you set a risk/reward zone for each index by allocating between the secure and growth accounts — your upside potential and the level of protection you’re comfortable with on the downside. Plus, you can reallocate between allocation options and risk control accounts each year, to adjust as needs change.
Dollars allocated to receive a declared rate earn that rate on each contract anniversary. For dollars linked to an index, earnings lock in based on the annual point-to-point change in the index, from one contract anniversary to the next.
Your annuity receives interest linked to the performance of one or more market indexes or a declared rate account
Index-linked performance, with limits on loss.
Allocation options
S&P 500
Russell 2000
MSCI EAFE
Declared rate
Hover to reveal more information
This equity index tracks changes in market value for 500 large U.S. companies and generally represents the performance of the U.S. stock
This index measures the performance of roughly 2,000 smaller capitalization U.S. companies and provides a barometer of how “small-cap” stocks are performing.
This international equity index measures the performance of developed markets outside the U.S. and Canada, including those in Europe, Australia and Southeast Asia.
This account is credited with an annual declared rate of interest, guaranteed for the duration of the allocation option period.
Risk control protects the growth potential of your investments
The power of risk control.
Risk control protects
Risk control in action
Hypothetical examples are for illustrative purposes only and do not guarantee or predict actual performance. The example above assumes 100% allocation to the Growth Account.
Disclosure
You may not invest directly in an index. The S&P 500 Index is a product of S&P Dow Jones Indices LLC (“SPDJI”), and has been licensed for use by CMFG Life Insurance Company (CMFG Life), the parent company of MEMBERS Life Insurance Company (MEMBERS Life). Standard & Poor’s®, S&P® and S&P 500® are registered trademarks of Standard & Poor’s Financial Services LLC (“S&P”); and these trademarks have been licensed for use by SPDJI and sublicensed for certain purposes by CMFG Life. This product is not sponsored, endorsed, sold or promoted by SPDJI, S&P, their respective affiliates, and none of such parties make any representation regarding the advisability of investing in this product nor do they have any liability for any errors, omissions or interruptions of the S&P 500 Index. The S&P 500 Index does not include dividends paid by the underlying companies.
Source
All guarantees are based on the claims-paying ability of the issuing company.
Investment strategies that include risk control can protect you from drastic market dips and provide confidence as you work toward your retirement goals. Index-linked risk control accounts let you set a “comfort zone” based on how much you’re potentially willing to lose. That guaranteed1 limit on loss can:
Offer potentially stabler long-term returns.
Free you from trying to “time” your investment strategy
Keep you invested in the markets during good times and bad
If the index goes up, you’re credited the percentage increase, up to each risk control account’s rate cap.
If the index goes down, value in the Growth Account is reduced by the percentage decrease, but only down to the maximum rate floor of -10%. Value in the Secure Account — because it has a 0% floor — remains the same.
Missing best and worst days linked to S&P 500.
A risk-control strategy for a portion of your assets that means you miss the market’s lows — and even some of its highs — can offer real benefits to your long-term bottom line
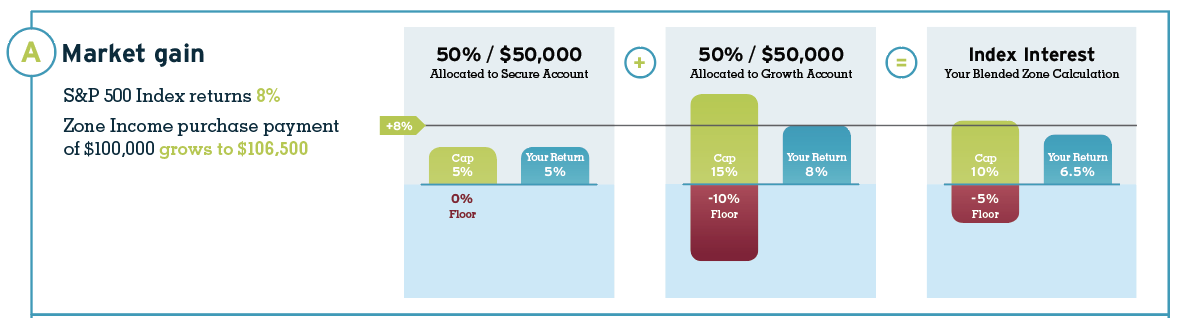
Scenario A: Market gain
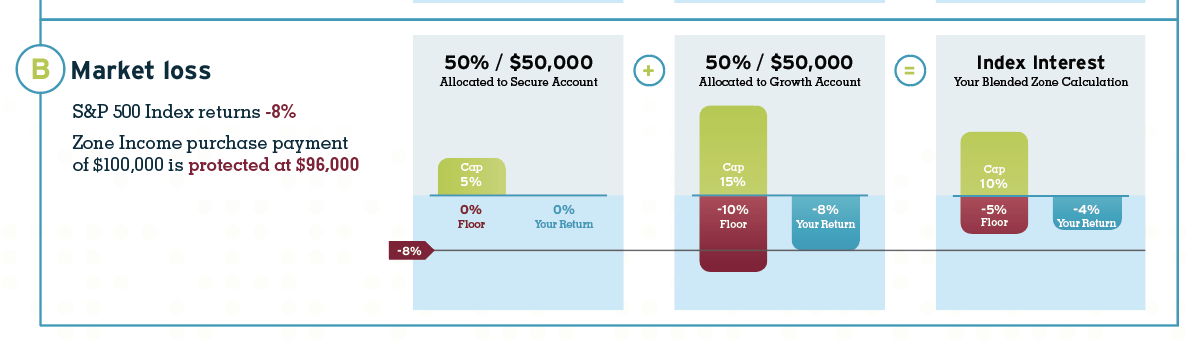
Scenario B: Market loss
Zone Income purchase payment of $100,000 grows to $106,500
S&P 500 Index returns 8%
Lock in the gain, lock out the loss.
See how your choice of zone and the performance of an index determine interest credited for a given year
In these two scenarios, rate caps are 5% for the S&P 500 Secure Account and 15% for the S&P 500 Growth Account. A 50/50 allocation means a blended comfort zone with 10% upside potential and -5% downside protection.
In scenario A, the index is up 8% for the year. In scenario B, it’s down 8%. Hypothetical values show how it all comes together to help you lock in gains when times are good, and lock out losses outside your comfort zone when times are bad.
Zone Income purchase payment of $100,000 is protected at $96,000
S&P 500 Index returns -8%
Guaranteed income with growth potential.
Your Zone Income allows you to combine risk-controlled, market-based growth opportunities with lifetime income you can count on
Americans are living longer than ever — good news, but a long life can amplify all the other risks you face in retirement. Longevity requires more savings for expenses like health care and to protect you against inflation. Having a nest egg you can count on is essential both to your financial security and confidence in retirement.
What you need to know:
The benefit base is initially equal to your purchase payment and will increase to your contract value every anniversary that the contract valueis greater than the current benefit base.
Guaranteed Lifetime Withdrawal Benefit
Your lifetime income is calculated based on a benefit base and a withdrawal rate, both of which have the potential to grow to increase your income. This is referred to as Guaranteed Lifetime Withdrawal Benefit, or protected income.
Your protected income will never decline — it only has the potential to increase, even after you’ve started taking income.
Additionally, the withdrawal rate increases 0.3% every year you hold your contract before starting income, up to a maximum of 10 years.
Learn more about our approach to risk control
Put time on
your side
Confidence through market cycles
Performance driven income growth
Zone Income
in action
Helping secure
a legacy
Disclosure
An excess withdrawal impacts your income benefit base and lifetime income
payment amount. Please see Zone Income prospectus for further information
about excess withdrawals and how they impact your benefits.
Put time on your side.
Save today and build income for tomorrow. With Zone Income, getting a head start can result in a larger income stream down the road
Dollars allocated to receive a declared rate earn that rate on each contract anniversary. For dollars linked to an index, earnings lock in based on the annual point-to-point change in the index, from one contract anniversary to the next.
Performance-driven income growth.
How do potential market growth and a deferral bonus impact your future income?
Confidence through market cycles.
Zone Income’s combination of risk-controlled growth and protected income can help smooth out the bumps of market ups and downs over time, while giving you the certainty of an income you can never outlive
The “comfort zone” you choose lets you participate in the market the way you want, with as little or as much risk exposure as you’re comfortable with.
But your benefit base will never decrease, even if your contract value declines.
Each year, your benefit base
may be adjusted based on your contract value. If your contract value has gone up, your benefit base could rise, too.
Plus, your withdrawal rate — which determines your income — receives a deferral bonus of 0.3% each year you wait to take income, up to a maximum of 10 years.
21-44
2.0%
2.3%
Year 1
At issue
2.8%
3.8%
4.3%
4.8%
5.4%
5.8%
2.5%
3.5%
4.0%
4.5%
5.1%
5.5%
45
50
55
60
63
65
6.0%
6.3%
6.8%
7.3%
5.7%
6.0%
6.5%
7.0%
67
70
75
80+
Issue Age
2.6%
2.9%
Year 3
Year 2
3.4%
4.4%
4.9%
5.4%
6.0%
6.4%
3.1%
4.1%
4.6%
5.1%
5.7%
6.1%
6.6%
6.9%
7.4%
7.9%
6.3%
6.6%
7.1%
7.6%
3.2%
Year 4
3.7%
4.7%
5.2%
5.7%
6.3%
6.7%
6.9%
7.2%
7.5%
8.2%
3.5%
3.8%
Year 6
Year 5
4.3%
5.3%
5.8%
6.3%
6.9%
7.3%
4.0%
5.0%
5.5%
6.0%
6.6%
7.0%
7.5%
7.8%
8.3%
8.8%
7.2%
7.5%
8.0%
8.5%
4.1%
4.4%
Year 8
Year 7
4.9%
5.9%
6.4%
6.9%
7.5%
7.9%
4.6%
5.6%
6.1%
6.6%
7.2%
7.6%
8.1%
8.4%
8.9%
9.4%
7.8%
8.1%
8.6%
9.1%
4.7%
Year 9
5.2%
6.2%
6.7%
7.2%
7.8%
8.2%
8.4%
8.7%
9.2%
9.7%
5.0%
Year 10+
5.5%
6.5%
7.0%
7.5%
8.1%
8.5%
8.7%
9.0%
9.5%
10.0%
1
3
2
4
Withdrawal percentage at purchase (joint life base withdrawal percentage is
0.5% lower).
Withdrawal percentage increases 0.3% each year income is deferred up to a maximum
of 10 years
Five-year wait to take income results in a 1.5% higher withdrawal percentage; this translates to a 27% higher protected payment.
Ten-year wait to take income results in a 3.0% higher withdrawal percentage; this translates to a 55% higher protected payment.
If elected at age 65, but you waited 10 years before taking payments, your withdrawal % rises from 5.5% to 8.5%. 55% increase to the Protected Payment.
Sources
1
Disclosure
Initial Withdrawal Rates increase 0.20% for each age between age ranges 45-50 and 60-65 (i.e. 5.10% is the withdrawal % for age 63).
Initial Withdrawal Rates increase 0.10% for each age between age ranges 55-60 and 65-80 (i.e. 5.70% is the withdrawal % for age 67).
The longer you wait to tap into income, you receive a withdrawal deferral bonus, which boosts your withdrawal percentage rate when you do decide to take income.
1
Sources
An excess withdrawal impacts your income benefit base and income payment amount. Please see Zone Income prospectus for further information about excess withdrawals and how they impact your benefits.
Disclosure
This example uses a variety of gross investment returns with floor and assumes 100% account allocation to the S&P 500 Growth Option with a cap rate of 15% and floor of -10%.
The chart below shows how hypothetical market performance and deferring the start of income can significantly impact the payment you’ll receive, even over six years. In this scenario, your payment amount would more than double over that period.
Disclosure
Assume no withdrawals and GLWB payments have not begun. Hypothetical situation example does not reflect actual history. This example uses a variety of gross investment returns with 100% allocation to Growth account and hypothetical cap rates of 15%. Account value includes contract and GLWB fee deductions. Cap rates are assumed flat throughout the period.
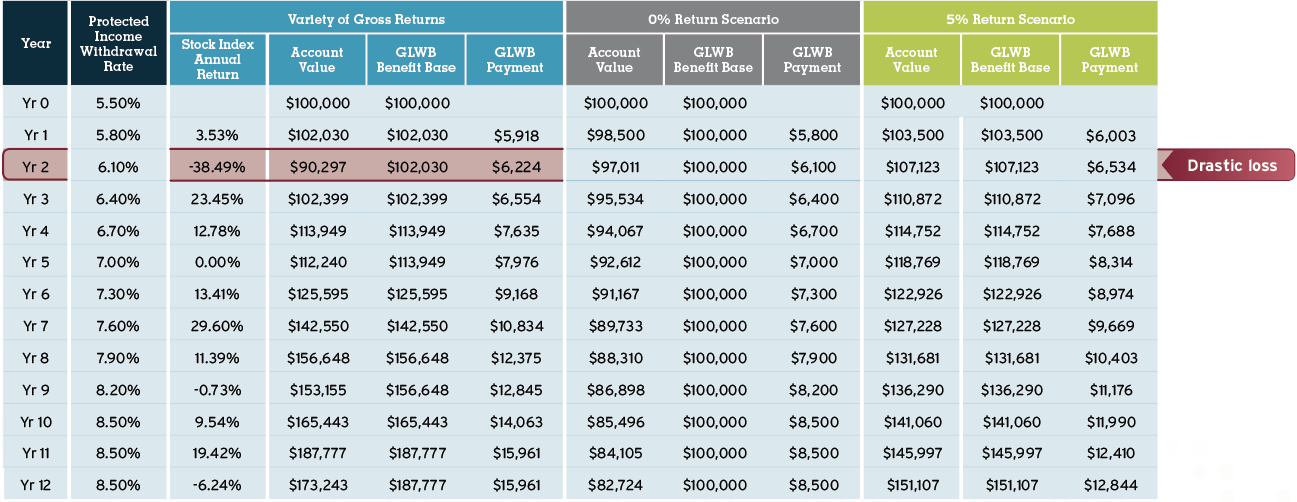
Zone Income in action.
How Zone Income actually performs depends on how you set your “comfort zone” — your personal exposure to market ups and downs — and how long you wait to start taking income, which impacts your deferral bonus
The chart below shows potential payments based on three hypothetical scenarios:
Disclosure
*Hypothetical situation example does not reflect actual history. This example uses a variety of gross investment returns with 100% allocation to the Growth account with hypothetical cap rates of 15%. Account value includes contract and GLWB fee deductions. Cap rates are assumed flat throughout the period.
0% Return
5% Return
Hypothetical examples may not be used to project or predict investment results. No one knows what the future holds, but Zone Income has the potential to deliver higher returns through market cycles, combined with guaranteed income for life.
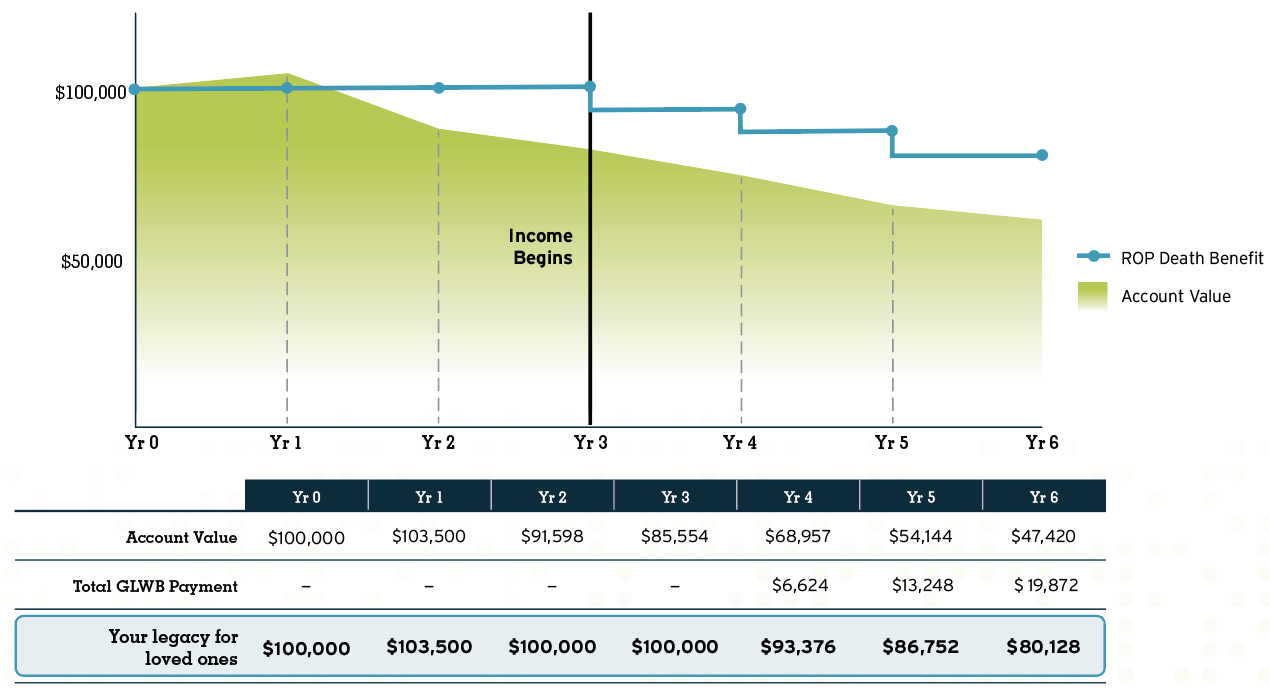
Helping secure a legacy.
Zone Income’s Return of Premium (ROP) death benefit ensures your named beneficiaries will receive a sum equal to your original purchase payment, minus withdrawals you made during your lifetime
It’s a dollar-for-dollar benefit for protected payments, ensuring your heirs receive an amount equal to what you paid in — minus withdrawals — which may be more or less than your account value at the time of death.
Disclosure
Hypothetical situation example does not reflect actual history. This example uses a variety of gross investment returns with floor and fees deducted. Assumes 100% account allocation to the S&P 500 Growth option with a cap rate of 15% and floor of -10%. Assumes only GLWB payments taken after income and no excess withdrawals taken. Assumes GLWB payment in year 6 was paid prior to death
More value, all in one place.
Zone Income brings you a protected source of income you can’t outlive, essential to a more secure retirement
A long-term promise
As a result, annuities are designed to be held at least until the end of the initial allocation period. If needs arise, you can withdraw up to 10% of last anniversary value annually without penalty.
Purchasing an annuity represents an important step — your commitment to retirement planning and our promise to protect your investment for the future.
Reallocation and rebalancing
Each year, you can reallocate between allocation options and reset the zone for each index by reallocating between risk control accounts. If you don’t reallocate, accounts automatically rebalance on anniversary to maintain your allocations and zones.
Reallocation and rebalancing
Health
hardships
A long-term promise
Health hardships
You have total access to contract valuein times of critical need, including confinement to a nursing home or hospital, or diagnosis of a terminal illness.
After the initial allocation period, only a market value adjustment will apply to withdrawals in excess of the 10%.
Withdrawals in excess of 10% are assessed
a surrender charge and market value adjustment during the initial allocation period. Refer to the fact sheet for these charges.
You have total access to your contract value on every allocation option maturity date.
The GLWB rider fee pays for your protected lifetime income and the contract fee pays for everything else. The result is a total “all-in” fee that lets you protect your future.
Zone Income is designed to deliver risk control for a reasonable price.
Zone Income is issued by MEMBERS Life Insurance Company (MEMBERS Life), a
subsidiary of CMFG Life Insurance Company (CMFG Life) and part of CUNA Mutual Group
As of December 31, 2019, financial records of CMFG Life’s parent, CUNA Mutual Holding Company, a Fortune 1000 company, indicated.
$24.6 billion
Highly rated, highly respected.
in assets
in liabilities
$20.5 billion
in policyholder surplus
$4.1 billion
Recognition
A.M. Best Company, Moody’s Investors Service and S&P Global are credit rating organizations serving the insurance and other financial services industries Ratings reflect the opinion of the relative financial strength and operating performance of the company. These ratings are subject to change. Investors should monitor ratings and financial strength of MEMBERS Life Insurance Company while they hold a contract.
We're proud of our financial strength ratings. They're a sign of our long-term ability to deliver on our commitments.*
Disclosure
Availability and benefits vary by state.
Withdrawals before age 591⁄2 may be subject to a 10% federal tax penalty. Consult your financial advisor and tax professional regarding the impact of any withdrawals.
*Ratings apply to CMFG Life I and its subsidiaries, MEMBERS Life, and CUMIS Insurance Society, Inc.
Take control of your retirement journey.
Contact us
Annuities are long-term insurance products designed for retirement purposes. Many registered annuities offer four main features: (1) a selection of investment options, (2) tax-deferred earnings accumulation, (3) guaranteed lifetime payout options, and (4) death benefit options. Before investing, consider the annuity’s investment objectives, risks, charges and expenses. The prospectus contains this and other information. Please read it carefully. This brochure must also be accompanied by a fact sheet for the selected initial index period. To obtain a prospectus and fact sheet, contact your advisor, log on to cmannuities.com, or call 888.888.3940.
This material is informational only and is not investment advice. If you need advice regarding your financial goals and investment needs, contact a financial advisor.
All guarantees are backed by the claims-paying ability of MEMBERS Life Insurance Company (MEMBERS Life) and do not extend to the performance of the underlying accounts which can fluctuate with changes in market conditions. Past performance is no guarantee of future results. All hypothetical examples are for illustrative purposes only and do not guarantee or predict actual performance.
Annuity contract values, death benefits and other values fluctuate based on the performance of the investment options and may be worth more or less than your total purchase payment when surrendered. Withdrawals may be subject to surrender charges, and may also be subject to a market value adjustment (MVA). The MVA can have a positive or negative impact on contract values, depending on how interest rates have changed since the contract was issued. Surrender charges range from 0% to 9% during the initial index period.
Hypothetical examples do not represent any specific annuity contract and may not be used to project or predict investment results. You may not invest directly in an index. Rate caps vary by index and by risk control account and can be adjusted annually on risk control account anniversary, subject to a minimum rate cap of 1% and a bailout provision. A bailout rate is set for each risk control account. If the rate cap for a given year is declared below that rate, you may withdraw value from that risk control account without surrender charge or MVA. You’ll have 30 days after your risk control account anniversary to make this withdrawal.
Withdrawals of taxable amounts are subject to ordinary income tax, and if taken before age 591⁄2 may be subject to a 10% federal tax penalty. If you are considering purchasing an annuity as an IRA or other tax-qualified plan, you should consider benefits other than tax deferral since those plans already provide tax-deferred status. MEMBERS Life does not provide tax or legal advice. Contact a licensed professional.
The CUNA Mutual Zone Income, the “Product”, has been developed solely by CUNA Mutual Group. The “Product” is not in any way connected to or sponsored, endorsed, sold or promoted by the London Stock Exchange Group plc and its group undertakings (collectively, the “LSE Group”). FTSE Russell is a trading name of certain of the LSE Group companies.
The S&P 500 Index is a product of S&P Dow Jones Indices LLC (“SPDJI”), and has been licensed for use by CMFG Life Insurance Company (CMFG Life), the parent company of MEMBERS Life Insurance Company (MEMBERS Life). Standard & Poor’s,® S&P® and S&P 500® are registered trademarks of Standard & Poor’s Financial Services LLC (“S&P”); and these trademarks have been licensed for use by SPDJI and sublicensed for certain purposes by CMFG Life. This product is not sponsored, endorsed, sold or promoted by SPDJI, S&P, their respective affiliates, and none of such parties make any representation regarding the advisability of investing in this product nor do they have any liability for any errors, omissions or interruptions of the S&P 500 Index. The S&P 500 Index does not include dividends paid by the underlying companies.
This product is not sponsored, endorsed, issued, sold or promoted by MSCI, and MSCI bears no liability with respect to this product or any index on which it is based. The prospectus contains a more detailed description of the limited relationship MSCI has with CMFG Life and any related products.
All rights in the Russell 2000 Index (the “Index”) vest in the relevant LSE Group company which owns the Index. “Russell,®” “FTSE Russell,®” and “Russell 2000® Index” are trade mark(s) of the relevant LSE Group company and are used by any other LSE Group company under license.
The Index is calculated by or on behalf of the LSE Group company or its affiliate, agent or partner. The LSE Group does not accept any liability whatsoever to any person arising out of (a) the use of, reliance on or any error in the Index or (b) investment in or operation of the product. The LSE Group makes no claim, prediction, warranty or representation either as to the results to be obtained from the Product or the suitability of the Index for the purpose to which it is being put by MEMBERS Life Insurance Company.
CUNA Mutual Group is the marketing name for CUNA Mutual Holding Company, a mutual insurance holding company, its subsidiaries and affiliates. Annuities are issued by CMFG Life and MEMBERS Life and distributed by their affiliate, CUNA Brokerage Services, Inc., member FINRA/SIPC, a registered broker/dealer and investment advisor, 2000 Heritage Way, Waverly, IA, 50677. CMFG Life and MEMBERS Life are stock insurance companies. MEMBERS® is a registered trademark of CMFG Life. Investment and insurance products are not federally insured, may involve investment risk, may lose value and are not obligations of or guaranteed by any depository or lending institution. All contracts and forms may vary by state, and may not be available in all states or through all broker/dealers. Base policy forms 2018-RILA, 2018-RILA-GLWBRDR and 2018-RILA-DRAEND.
CZIA-3376081.1-1220-0123
© 2021 CUNA Mutual Group


1
Withdrawal Rate (Age 65, 0 and 5 year deferral shown)
2
Benefit base step up due to Account Value growth
Benefit base step ups continue after starting income due to Account Value growth
3


2

Variety of Gross Returns

1
2
1
2
An excess withdrawal impacts your income benefit base and income payment amount. Please see Zone Income prospectus for further information about excess withdrawals and how they impact your benefits.
Initial Withdrawal Rates are established based on the age of the youngest covered person on the issue date.
2
That risk-controlled growth potential provides a way to maximize your income, which can only rise, never decline.
1
1
2
1
1
2
3
4
5
6
7
8
9
1

1
1
1
S&P 500 Index 1997-2019
1
12/21/96
ASIAN FINANCIAL CRISIS
3/24/00
+106%
-57%
-49%
10/7/07
+101%
3/9/09 GLOBAL ECONOMIC
crisis
1997
2002
2009
2020
CYCLE
CYCLE
CYCLE
10/9/02
DOT COM
COLLAPSE
1/31/20
+377%


Rising interest rates
CYCLE 1953-1981
Average annual
return on bonds = 2.48%
1

Interest

Bond

Interest
Bond

CYCLE 1998-2017
Average annual
return on bonds = 6.7%
2
Falling interest rates
Upside Potential
Downside
Protection
0%
Zone
Risk Control


Secure
Narrow
Wide
Rate cap: 15%
Rate floor: -10%
ZONE

0%
If the S&P goes down 30%, and your rate is -10%, you will only lose 10%
If the S&P 500 goes up 18%, and your rate cap is 15%, you will be credited 15%.
Return on $100,00 Investment
Growth of $100,00 Investment (1994-2014)
1
in the market
$339,335
100%
9.5% Increase
$371,784
Miss
Best and
Worst Days
10
17.8% Increase
$399,974
Miss
Best and
Worst Days
20
23.2% Increase
$418,387
Miss
Best and
Worst Days
30
23.4% Increase
$418,998
Miss
Best and
Worst Days
40
See how we do it
Take this information with you
A
Market gain
S&P 500 Index returns 8%
Zone Income purchase payment of $100,00 grows to $106,500
0%
Floor
Cap
5%
Your Return
5%
50% / $50,000
Allocated to Secure Account
Cap
5%
-10%
Floor
Your Return
5%
50% / $50,000
Allocated to Secure Account

Cap
10%
-5%
Floor
Your Return
6.5%
Index Interest
Your Blended Zone Calculation
+8%
B
Market loss
S&P 500 Index returns -8%
Zone Income purchase payment of $100,00 protected at $96,000
Your Return
0%
0%
Floor
Cap
5%
50% / $50,000
Allocated to Secure Account
Cap
15%
-10%
Floor
Your Return
-8%
50% / $50,000
Allocated to Secure Account
Cap
10%
-5%
Floor
Your Return
-4%
Index Interest
Your Blended Zone Calculation
-8%
Yr 0
Yr 1
Yr 2
Yr 3
Yr 4
Yr 5
Yr 6
Yr 7
Yr 8
Yr 9
Yr 10
Yr 11
Yr 12
5.5%

7.0%
Income Begins
Benefit base
Account Value

Your benefit base
A protected income benefit that never decreases.
$12,000
$10,000
$8,000
$6,000
$4,000
$2,000
$0
Yr 0
Yr 1
Yr 2
Yr 3
Yr 4
Yr 5
Yr 6
Stock Index Annual Return
29.60%
11.39%
-0.73%
9.54%
19.42%
-6.24%
Net Investment Return
13.50%
9.89%
-2.23%
8.02%
13.50%
-7.74%
Protected Payment Growth Due to Benefit Base Growth
$-
$742
$1,394
$1,394
$1,842
$3,033
$3,033
Protected Payment Growth Due to Deferreal Bonus Increase
$-
$341
$715
$1,089
$1,484
$1,933
$2,381
Protected Payment Start Value
$,500
$5,500
$5,500
$5,500
$5,500
$5,500
$5,500
Total Protected Payment
$5,500
$6,583
$7,608
$7,982
$8,826
$10,466
$10,914
98% increase to the protected payment
Performance driven Income
Ending protected Income payment $10,914


Year
Protected Income Withdrawal Rate
Variety of Gross Returns
Stock Index Annual Return
Account Value
GLWB Benefit Base
GLWB Payment
0% Return Scenario
Account Value
GLWB Benefit Base
GLWB Payment
5% Return Scenario
Account Value
GLWB Benefit Base
GLWB Payment

Drastic loss
Yr 0
5.50%
$100.000
$100.000
$100.000
$100.000
$100.000
$100.000
Yr 1
5.80%
3.58%
$102.030
$102.030
$5.918
$95.500
$100.000
$5.800
$103.500
$103.500
$6.003
Yr 2
6.10%
-38.49%
$90.297
$102.030
$6.224
$97.011
$100.000
$6.100
$107.123
$107.123
$6.534
Yr 3
6.40%
23.45%
$102.399
$102.399
$6.554
$95.534
$100.000
$6.400
$110.872
$110.872
$7.096
Yr 4
6.70%
12.78%
$112.949
$113.949
$7.635
$94.067
$100.000
$6.700
$114.752
$114.752
$7.688
Yr 5
7.00%
0.00%
$112.240
$113.949
$7.976
$92.612
$100.000
$7.000
$118.769
$118.769
$8.314
Yr 6
7.30%
13.41%
$125.595
$125.595
$9.168
$91.167
$100.000
$7.300
$122.926
$122.926
$8.974
Yr 7
7.60%
29.60%
$142.550
$142.550
$10.834
$89.733
$100.000
$7.600
$127.228
$127.228
$9.669
Yr 8
7.90%
11.39%
$156.648
$156.648
$12.375
$88.310
$100.000
$7.900
$131.681
$131.681
$10.403
Yr 9
8.20%
-0.73%
$153.155
$156.648
$12.845
$86.898
$100.000
$8.200
$136.290
$136.290
$11.176
Yr 10
8.50%
9.54%
$165.443
$165.443
$14.063
$85.496
$100.000
$8.500
$141.060
$141.060
$11.990
Yr 11
8.50%
19.42%
$187.777
$187.777
$15.961
$84.105
$100.000
$8.500
$145.997
$145.997
$12.410
Yr 12
8.50%
-6.24%
$173.243
$187.777
$15.961
$82.724
$100.000
$8.500
$151.107
$151.107
$12.844
$100.000
$50.000
Yr 0
Yr 1
Yr 2
Yr 3
Yr 4
Yr 5
Yr 6
Income Begins
ROP Death Benefit
Account Value
Yr 0
Yr 1
Yr 2
Yr 3
Yr 4
Yr 5
Yr 6
Account Value
$100.000
$103.500
$91.598
$85.554
$68.957
$54.144
$47.420
Total GLWB Payment
-
-
-
-
$6.624
$13.248
$19.872
Your legacy for Loved Ones
$100.000
$103.500
$100.000
$100.000
$93.376
$86.752
$80.128

Yr 0
Yr 1
Yr 2
Yr 3
Yr 4
Yr 5
Yr 6
21-44
2.0%
2.3%
Year 1
At issue
Issue Age
2
2.8%
3.8%
4.3%
4.8%
5.4%
5.8%
2.5%
3.5%
4.0%
4.5%
5.1%
5.5%
45
50
55
60
63
65
6.0%
6.3%
6.8%
7.3%
5.7%
6.0%
6.5%
7.0%
2.6%
Year 2
3.1%
4.1%
4.6%
5.1%
5.7%
6.1%
6.3%
6.6%
7.1%
7.6%
67
70
75
80+
1
Withdrawal percentage at purchase (joint life base withdrawal percentage is
0.5% lower).
2
Withdrawal percentage increases 0.3% each year income is deferred up to a maximum
of 10 years
21-44
Issue Age
2
45
50
55
60
63
65
2.9%
Year 3
3.4%
4.4%
4.9%
5.4%
6.0%
6.4%
6.6%
6.9%
7.4%
7.9%
3.2%
Year 4
3.7%
4.7%
5.2%
5.7%
6.3%
6.7%
6.9%
7.2%
7.5%
8.2%
3.5%
Year 5
4.0%
5.0%
5.5%
6.0%
6.6%
7.0%
7.2%
7.5%
8.0%
8.5%
67
70
75
80+
3
Five-year wait to take income results in a 1.5% higher withdrawal percentage; this translates to a 27% higher protected payment.
21-44
Issue Age
2
45
50
55
60
63
65
3.8%
Year 6
4.3%
5.3%
5.8%
6.3%
6.9%
7.3%
7.5%
7.8%
8.3%
8.8%
4.1%
4.4%
Year 8
Year 7
4.9%
5.9%
6.4%
6.9%
7.5%
7.9%
4.6%
5.6%
6.1%
6.6%
7.2%
7.6%
8.1%
8.4%
8.9%
9.4%
7.8%
8.1%
8.6%
9.1%
67
70
75
80+
21-44
Issue Age
2
45
50
55
60
63
65
4.7%
Year 9
5.2%
6.2%
6.7%
7.2%
7.8%
8.2%
8.4%
8.7%
9.2%
9.7%
5.0%
Year 10+
5.5%
6.5%
7.0%
7.5%
8.1%
8.5%
8.7%
9.0%
9.5%
10.0%
67
70
75
80+
4
Ten-year wait to take income results in a 3.0% higher withdrawal percentage; this translates to a 55% higher protected payment.
Year
Protected Income Withdrawal Rate
Variety of Gross Returns
Stock Index Annual Return
Account Value
GLWB Benefit Base
GLWB Payment
Drastic loss
Yr 0
5.50%
$100.000
$100.000
Yr 1
5.80%
3.58%
$102.030
$102.030
$5.918
Yr 2
6.10%
-38.49%
$90.297
$102.030
$6.224
Yr 3
6.40%
23.45%
$102.399
$102.399
$6.554
Yr 4
6.70%
12.78%
$112.949
$113.949
$7.635
Yr 5
7.00%
0.00%
$112.240
$113.949
$7.976
Yr 6
7.30%
13.41%
$125.595
$125.595
$9.168
Yr 7
7.60%
29.60%
$142.550
$142.550
$10.834
Yr 8
7.90%
11.39%
$156.648
$156.648
$12.375
Yr 9
8.20%
-0.73%
$153.155
$156.648
$12.845
Yr 10
8.50%
9.54%
$165.443
$165.443
$14.063
Yr 11
8.50%
19.42%
$187.777
$187.777
$15.961
Yr 12
8.50%
-6.24%
$173.243
$187.777
$15.961
Year
Protected Income Withdrawal Rate
0% Return Scenario
Account Value
GLWB Benefit Base
GLWB Payment
Yr 0
5.50%
$100.000
$100.000
Yr 1
5.80%
$95.500
$100.000
$5.800
Yr 2
6.10%
$97.011
$100.000
$6.100
Yr 3
6.40%
$95.534
$100.000
$6.400
Yr 4
6.70%
$94.067
$100.000
$6.700
Yr 5
7.00%
$92.612
$100.000
$7.000
Yr 6
7.30%
$91.167
$100.000
$7.300
Yr 7
7.60%
$89.733
$100.000
$7.600
Yr 8
7.90%
$88.310
$100.000
$7.900
Yr 9
8.20%
$86.898
$100.000
$8.200
Yr 10
8.50%
$85.496
$100.000
$8.500
Yr 11
8.50%
$84.105
$100.000
$8.500
Yr 12
8.50%
$82.724
$100.000
$8.500
Year
Protected Income Withdrawal Rate
5% Return Scenario
Account Value
GLWB Benefit Base
GLWB Payment
Yr 0
5.50%
$100.000
$100.000
Yr 1
5.80%
$103.500
$103.500
$6.003
Yr 2
6.10%
$107.123
$107.123
$6.534
Yr 3
6.40%
$110.872
$110.872
$7.096
Yr 4
6.70%
$114.752
$114.752
$7.688
Yr 5
7.00%
$118.769
$118.769
$8.314
Yr 6
7.30%
$122.926
$122.926
$8.974
Yr 7
7.60%
$127.228
$127.228
$9.669
Yr 8
7.90%
$131.681
$131.681
$10.403
Yr 9
8.20%
$136.290
$136.290
$11.176
Yr 10
8.50%
$141.060
$141.060
$11.990
Yr 11
8.50%
$145.997
$145.997
$12.410
Yr 12
8.50%
$151.107
$151.107
$12.844