HEADLINES
OCCUPIER MOVES
INTRODUCTION
OCCUPIER ACTIVITY
OCCUPIER MOVEMENT
KEY IMPLICATIONS
CONCLUSION
LONDON�MOVES
The who, what, where and why of office relocations across the UK capital.
Established companies
comprises all occupiers that already have an office�in Central London
MOVER
An occupier who has moved offices within Central London
STAYER
an office move within the same Central London submarket as�the previous office
RELOCATOR
an office move into a new Central London submarket
an office expansion, either within the�existing office location or a secondary/�tertiary location in Central London
EXPANSION
comprises all occupiers that have relocated their office from outside Central London or are a new occupier
NEW�ENTRANTS
comprises all education & medical occupiers who have taken office space in Central London - not included in the relocations data
EDUCATION & MEDICAL
comprises all flexible workspace providers who have taken a traditional lease or signed a management agreement in Central London - not included in the relocations data
FLEXIBLE WORKSPACE


125 deals in cbd submarkets�in 2025
total space leased of�1.8 million sq. ft�in 2025
23% of cbd leasing in 2025
(by size) was for less
than 10,000 SQ. FT
RELOCATORS AND STAYERS DRIVE BULK OF�CBD ACTIVITY
1.1 KILOMETRES�AVERAGE�DISTANCE MOVED
average cbd lease size was
14,370 sq. ft in 2025
(1% higher than 2024)
RELOCATORS CONCENTRATED
INTO TRADITIONAL CORE
AND SOUTH DOCKS

HOVER ON EACH BOX TO LEARN MORE

This was 5% below the 2024 count but remained in line with the 10-year average. There were 26 transactions signed by Flexible Workspace operators, equating to 610,000 sq ft – identical to the prior year in terms of count and 3% higher on the quantum of space leased. Despite deals numbers for Education & Medical occupiers reducing from 20 in 2024 to 14 in 2025, the quantum of space increased by 27% year-on-year to 460,000 sq ft – the highest leased space on record.
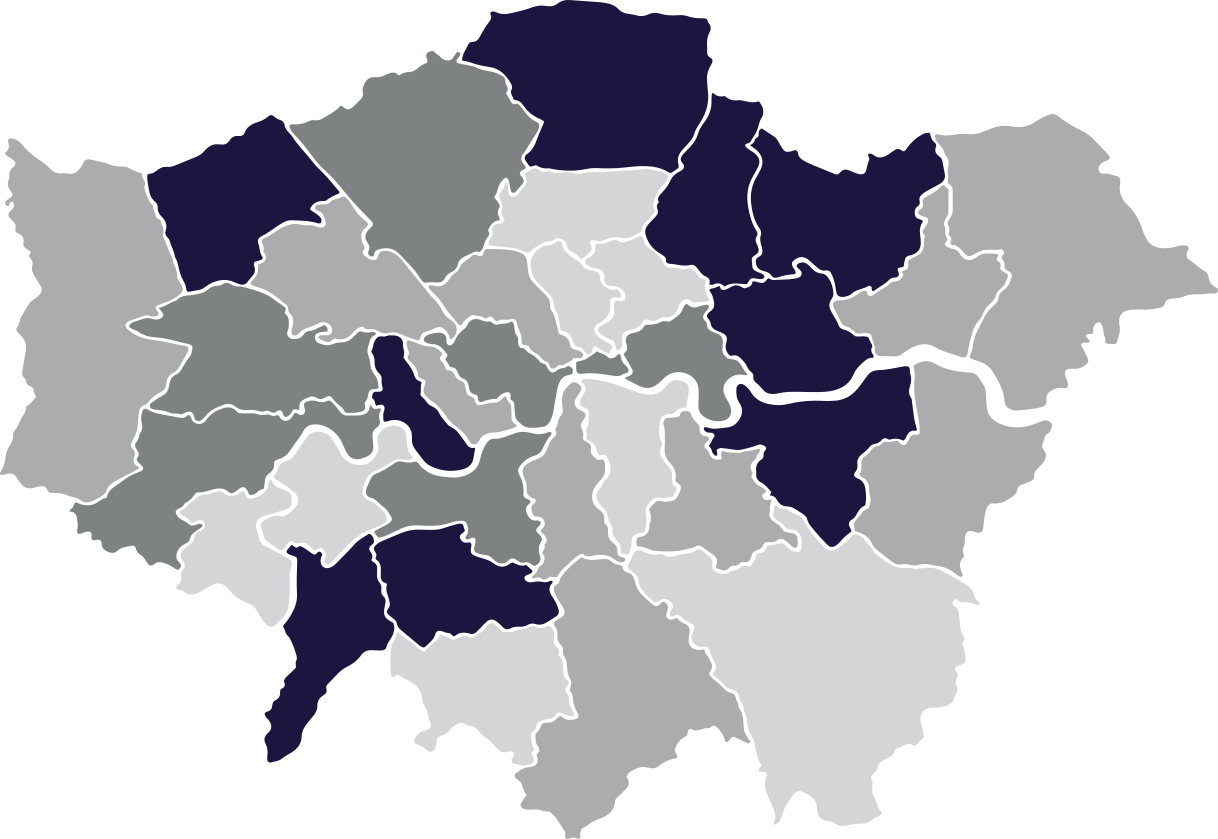
CENTRAL LONDON MARKETS
MAP SAMPLE FOR PLACEMENT ONLY
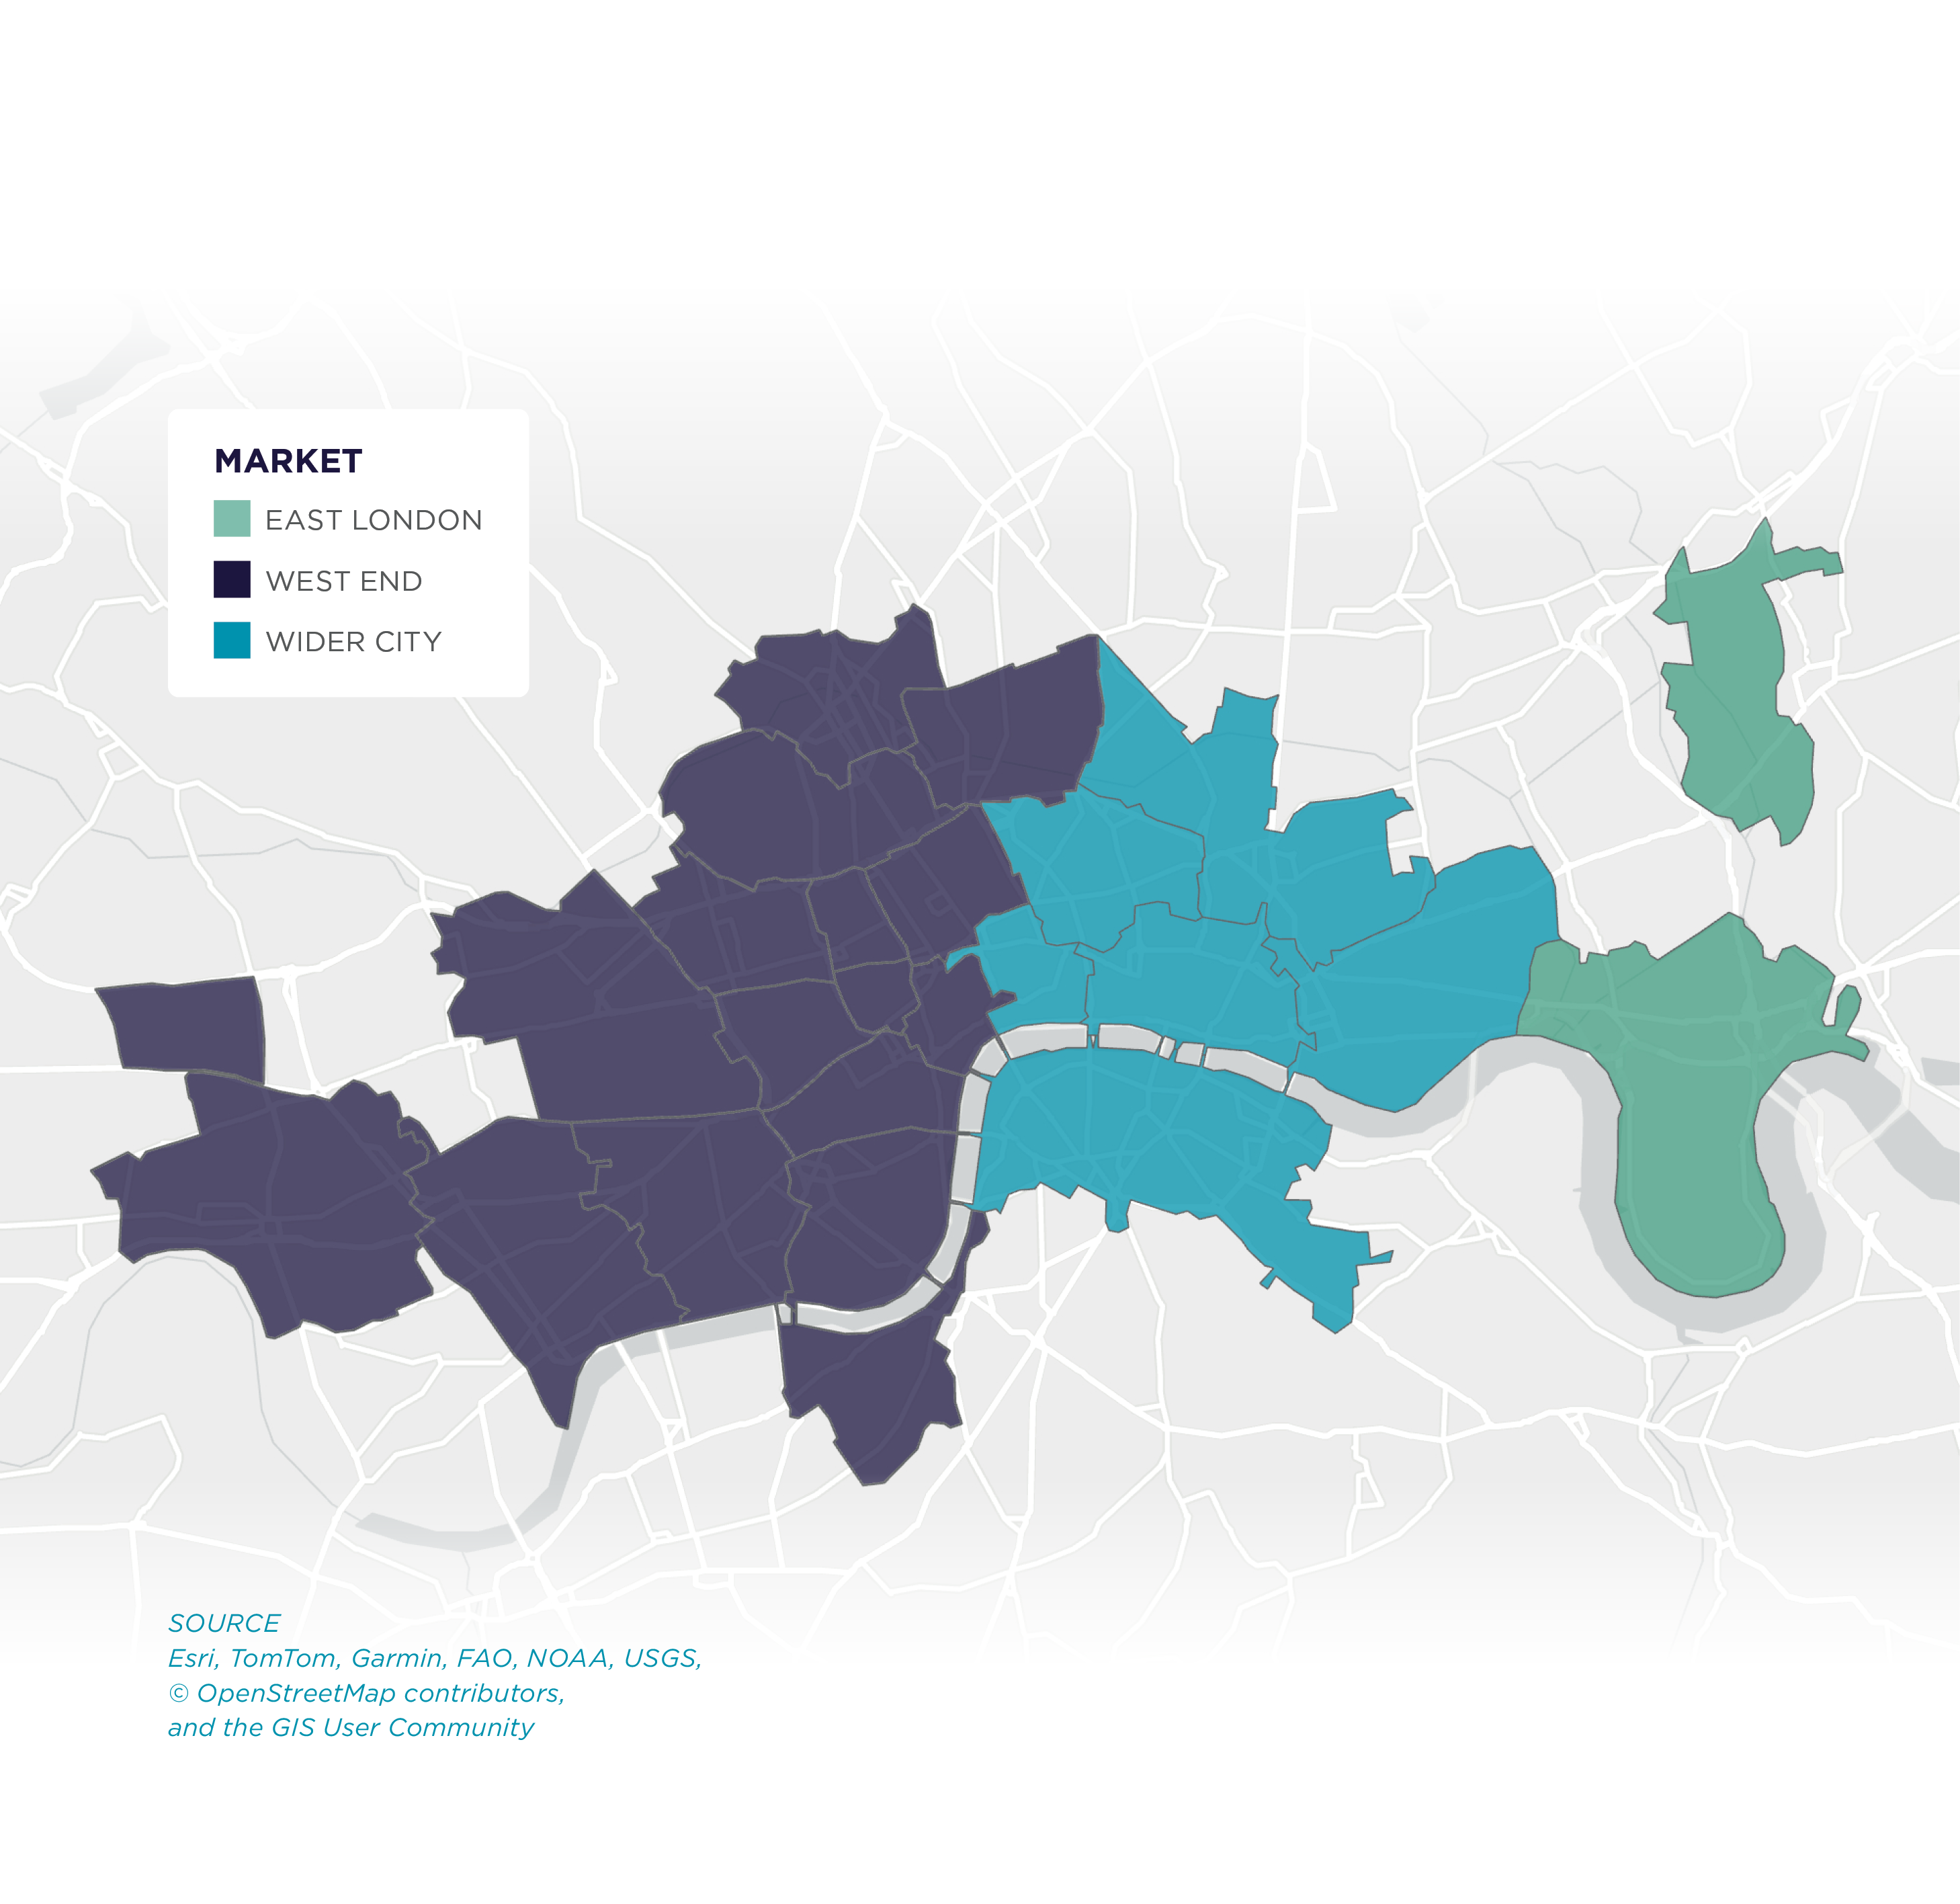
The West End overtook the Wider City market in attracting new entrants –�the first time since 2020 – with 25 deals totalling 231,000 sq ft.
This compares with 20 deals in the Wider City (174,000 sq ft) with 1 new occupier taking 9,500 sq ft in East London. The City Core continues to be the most sought after location for new market entrants, with 12 occupiers leasing space in 2025, equating to 97,000 sq ft, and 57 over the past five years (633,000 sq ft). Clerkenwell and Southbank follow, each attracting 22 occupiers since 2021 and equating to 304,000 sq ft and 204,000 sq ft respectively.
�Professional Services and Technology businesses continue to be the most active sectors for new entrants, with 16 and 14 occupiers leasing space in Central London, respectively, and both surpassing the 10-year average. While the Technology sector came in second, they are ahead in terms of the 5- and 10-year average number of new entrants, a trend that is expected to continue as AI businesses in particular, continue to be active in leasing space. All the other sectors saw the 2025 number of new entrants fall behind their respective�5 and 10-year averages. �
London continues to attract new occupiers and 2025 was no different, with 46 new entrants across Central London, made up of both new occupiers and those who have relocated from outside of Central London into the market.
This was ahead of the 43 recorded in 2024 and one more than the 10-year average. This equated to 415,000 sq ft of take-up – a 27% year-on-year reduction, despite being ahead by 3 occupiers. A large reason for this is due to the average deal�size falling to 9,018 sq ft, falling by 32% year on year and�by 27% on the 10-year average deal size of 12,385 sq ft.
Of the 46 new entrants, 27 were new businesses taking their first office space in Central London, equating to 255,000 sq ft – both the number and quantum of space increasing by 50% and 25% respectively on 2024. The 19 new entrants who relocated from outside of Central London leased 160,000 sq ft – both�at their lowest levels since 2020.
Central London continues to be an expansionary market for occupiers,�with net expansion of 3.82 million sq ft recorded for movers and businesses taking additional space in 2025. This was up by 16% on 2024 and is the highest net expansion figure recorded since 2019.

ABOUT CUSHMAN & WAKEFIELD
Cushman & Wakefield (NYSE: CWK) is a leading global commercial real estate services firm for occupiers and investors with approximately 53,000 employees in over 350 offices and nearly 60 countries. In 2025, the firm reported revenue of $10.3 billion across its core service lines of Services, Leasing, Capital markets, and Valuation and other. Built around the belief that Better never settles, the firm receives numerous industry and business accolades for its award-winning culture.
For additional information, visit www.cushmanwakefield.com.





To allow us to better analyse occupier movement activity across Dublin’s CBD, all office moves have been grouped into a set of defined categories based on the nature of the move.
This classification helps distinguish between�genuine new demand, internal churn within the market,�and space expansions, allowing for a more nuanced interpretation of leasing activity.


NEW�ENTRANTS
Classification
of Occupier Moves
HEADLINES

Constrained grade A supply across some West End submarkets is one of the main reasons why overall movers reduced in 2025; however, there were some exceptions.
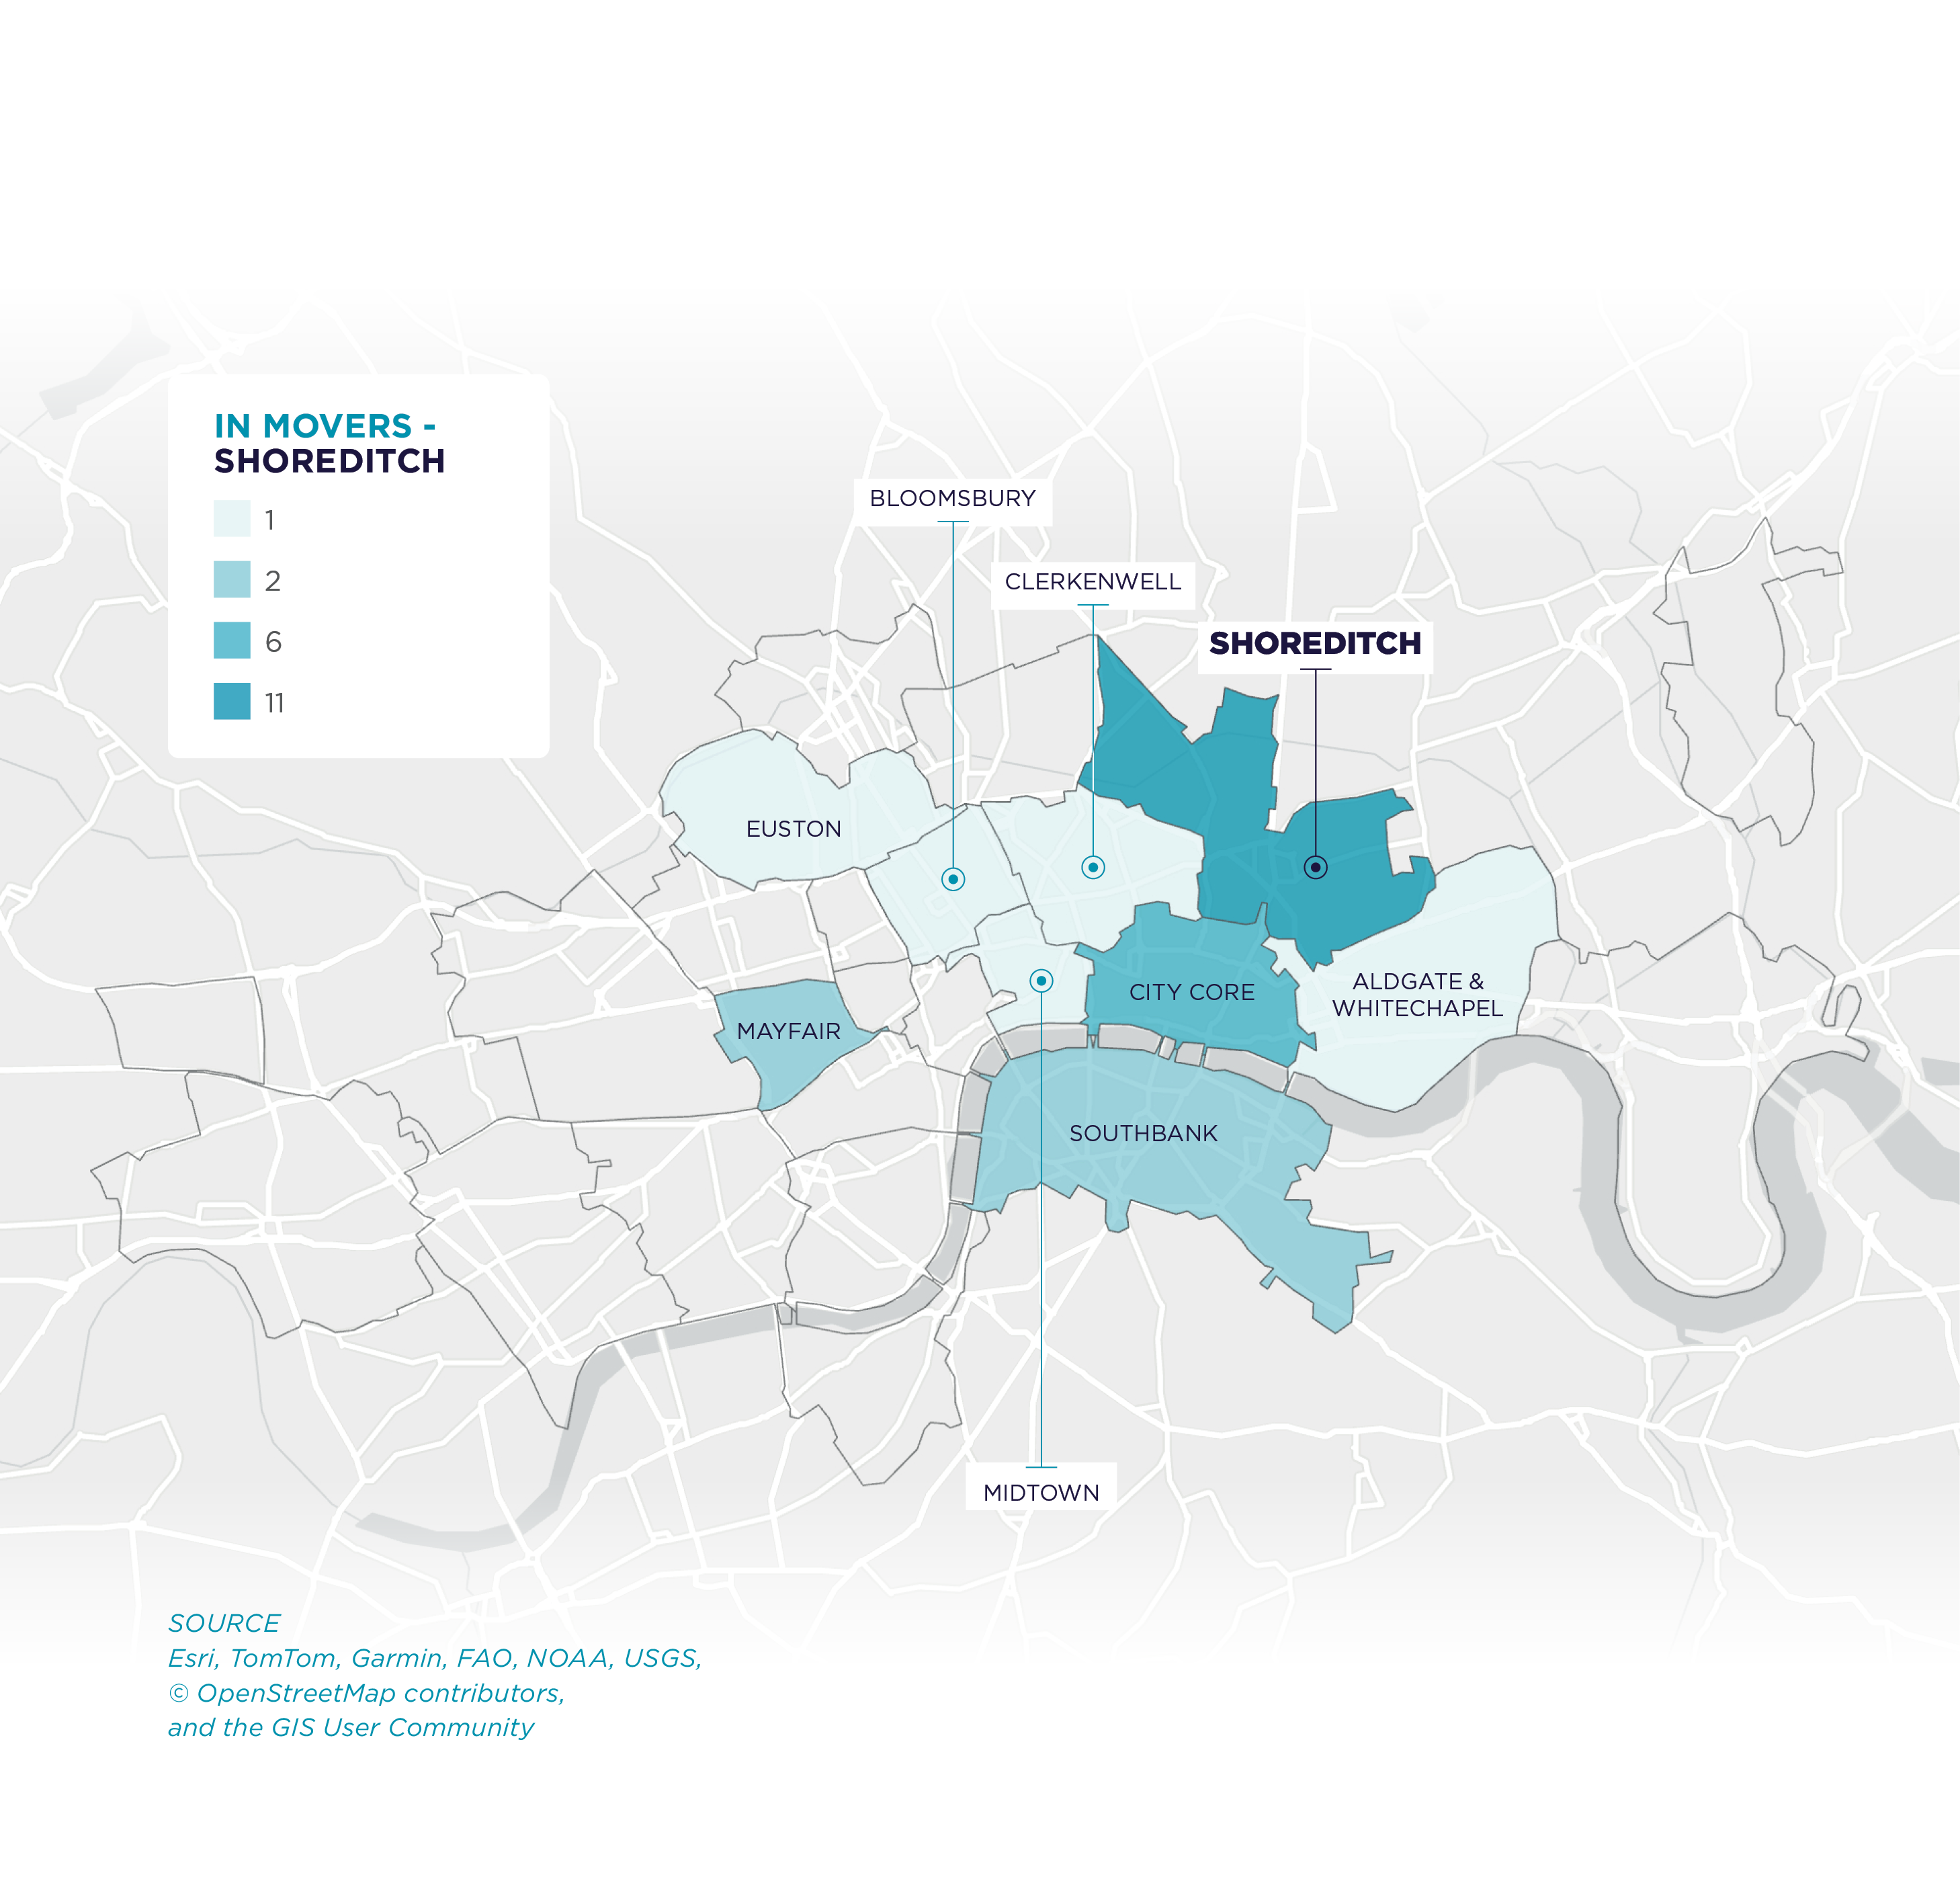
Movers into North of Oxford Street (14), Covent Garden (14) and King’s Cross (9) increased year-on-year, from 8,�8 and 0 respectively. In North of Oxford Street, four pre-lets across four different developments led to not only the increase in the number of movers, but also the quantum of spaced they leased, by 18% to 351,000 sq ft. This was also the largest volume of leased spaced by movers across all of the West End submarkets, followed by Mayfair where the 6 movers recorded leased�274,000 sq ft.
Activity in Mayfair and St James’s continued to be hindered by the availability of grade A space, with just 10 combined movers recorded in 2025 – the lowest number since 2014. Of those that did move, just one came�from the City Core – McDermott Will Emery who pre-let the entirety of 7 Brook Street.
All these occupiers relocated from within the West End, equating to just under 80,000 sq ft with technology businesses leading the way.
In East London, 6 movers were recorded, all of which were to Canary Wharf – 3 were stayers and 3 relocated. The largest was Visa’s relocation from Paddington to 1 Canada Square – also the second largest deal for|�Central London and second largest distance moved�by an occupier in 2025.
King’s Cross has historical seen limited activity, with an average of 3 movers a year recorded between 2013 and 2024, however that changed in 2025 with 9 occupiers relocating into the area –�a record high.
Occupier Movement Patterns and Leasing Dynamics in 2025
Chart 6 breaks down 2025 leasing activity�by the occupier categories outlined earlier, analysing both the number of moves�and the volume of space taken.
Relocations and Stayers Drive the Bulk of CBD Activity
OCCUPIER MOVEMENT
Workday’s relocation to College Square in the Traditional Core—having moved from Dockline and the King’s Building, Smithfield—was the largest relocation of the year, totalling approximately 38,700 square metres (416,000 square feet). Other notable relocations included Intertrust, which secured approximately 2,000 square metres (21,580 square feet) at the Sidings and PartnerRe which took approximately 1,800 square metres (19,200 square feet) at the Exchange Building in the North Docks �
The majority of activity during the year was driven by stayers and relocators. While these two groups recorded a broadly similar number of transactions, relocators accounted for�a disproportionately large share of take-up, representing 38% of total CBD space leased.
PROFESSIONAL SERVICES – LARGEST MOVES
There were four relocations over 100,000 sq ft in this sector group, including the largest leasing transaction�of the year, Squarepoint’s 404,000 sq ft pre-let at 65 Gresham Street in the City Core, a relocation from approximately 100,000 sq ft at 1 Ropemaker, also in the City Core. Visa’s commitment to 300,000 sq ft followed, a relocation that will take them from Paddington to Canary Wharf and expand by 100,000 sq ft. State Street’s pre-let of 100 New Bridge Street in the City depicted a significant contraction of space, downsizing from 350,000 sq ft to 195,000 sq ft, however this reflects leased space and actual occupied space is believed to have been lower; and finally Ares committed to 128,000 sq ft in Mayfair, future expansion space�when the business moves in in 2028.
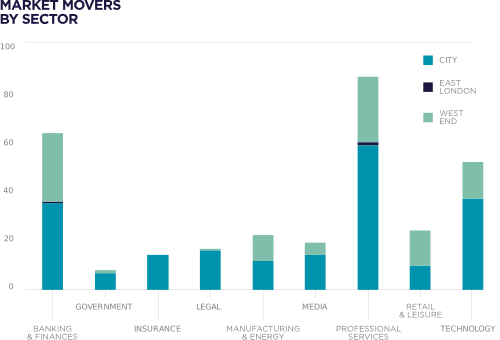
Banking & Finance occupiers were also active in 2024, with 84 recorded movers totalling 2.55 million sq ft – this was the highest number of movers since 2019. Continuing on from 2024, there were more movers into the Wider City for this sector (47) than in the West End (34), with the remaining 3 taking place in Canary Wharf.
The shortage of office space, particularly around Elizabeth Line and mainline train stations (with 3+ connections), is expected to intensify over the next five years with the development pipeline getting more and more constrained.

The drivers of this centre around not only the cost of relocating and fitting out office space – which according to our latest UK Fitout Cost Guide is averaging £243 per sq ft in London but in reality could be much higher – but also because of the undersupply of grade A office space around mainline stations, the options of which�are depleting at a fast rate, in large due to the cost�of construction and rents required in order to make a scheme viable. As such, the stay put option has been favoured by some occupiers, who are essentially pushing their requirement further down the line in the hope�that the marketplace for relocating will improve.
Of the 3.65 million sq ft of transactions conducted by Cushman & Wakefield’s Tenant Representation Team in 2024 and 2025, 42% were lease renewals or regears (not included in the London Moves dataset), up from the 28% recorded in 2022 and 2023 combined. While the quantum of space for renewals and regears increased, the deal count reduced by 30%.
Staying put has been a key option for many occupiers during 2024 and 2025, with renewals and regears rising during this period.
This means that despite elevated renewals and regears, a large volume of occupiers continue to relocate, evident in the market movers count of 296 deals in 2025 being in line with the 5-year average of 298 deals and ahead of the 10-year average of 285 deals.
With supply centred around key transport nodes depleting, occupiers who do not renew or regear are faced with having to look in alternative locations for grade A space – the spillover impact. The key Elizabeth Line submarkets of Mayfair, Canary Wharf, City Core and King’s Cross are all among the locations with the lowest grade A vacancy rates, as at Q4 2025, and this has seen other adjacent benefit indirectly from Elizabeth line connectivity.
Southbank is the clear spillover winner benefiting from undersupply of core grade A space in the City Core, with movers increasing from just 18 in 2024 to 29 in 2025, as well as elevated movers in 2014, 2015 and 2016 when City Core grade A vacancy rates were at similar levels to Q4 2025. The market is also benefitting from some West End overspill, given its transport connections, with 7 in-moves in 2025, up from just 3 in 2024. However, grade A supply needs to be available, and in prior years this has not been the case and has resulted in few relocations. Midtown has also seen a consistent number of movers, despite contending with its own grade A supply constraints.
��
Historically, Fitzrovia has been a prime spillover submarket, although in recent years, it has seen a more steady flow of movers, which continued in 2025.
�The desirability of Canary Wharf as an office and retail destination saw activity surge over the past four years, and remains centred around the Elizabeth line station. However, the low grade A vacancy rate of 3.75% at the end of 2025 has seen occupiers targeting other destinations along the entire route, which as mentioned above is scarce. This is expected to intensify as future supply over the next five years remains low with no developments currently under construction and around 760,000 sq ft expected to come through should construction begin within the next�12 months.
In the West End, the undersupply across Mayfair and St James’s has resulted in activity increasing in nearby, and also constrained, submarkets such as Marylebone/North of Oxford Street, which saw movers increase from 8 in 2024 to 14 in 2025.
WHERE ARE�THEY MOVING?
HOW FAR ARE THEY MOVING?
WHO IS MOVING?
THE�EXPANDERS
THE�CONTRACTORS


GET IN TOUCH

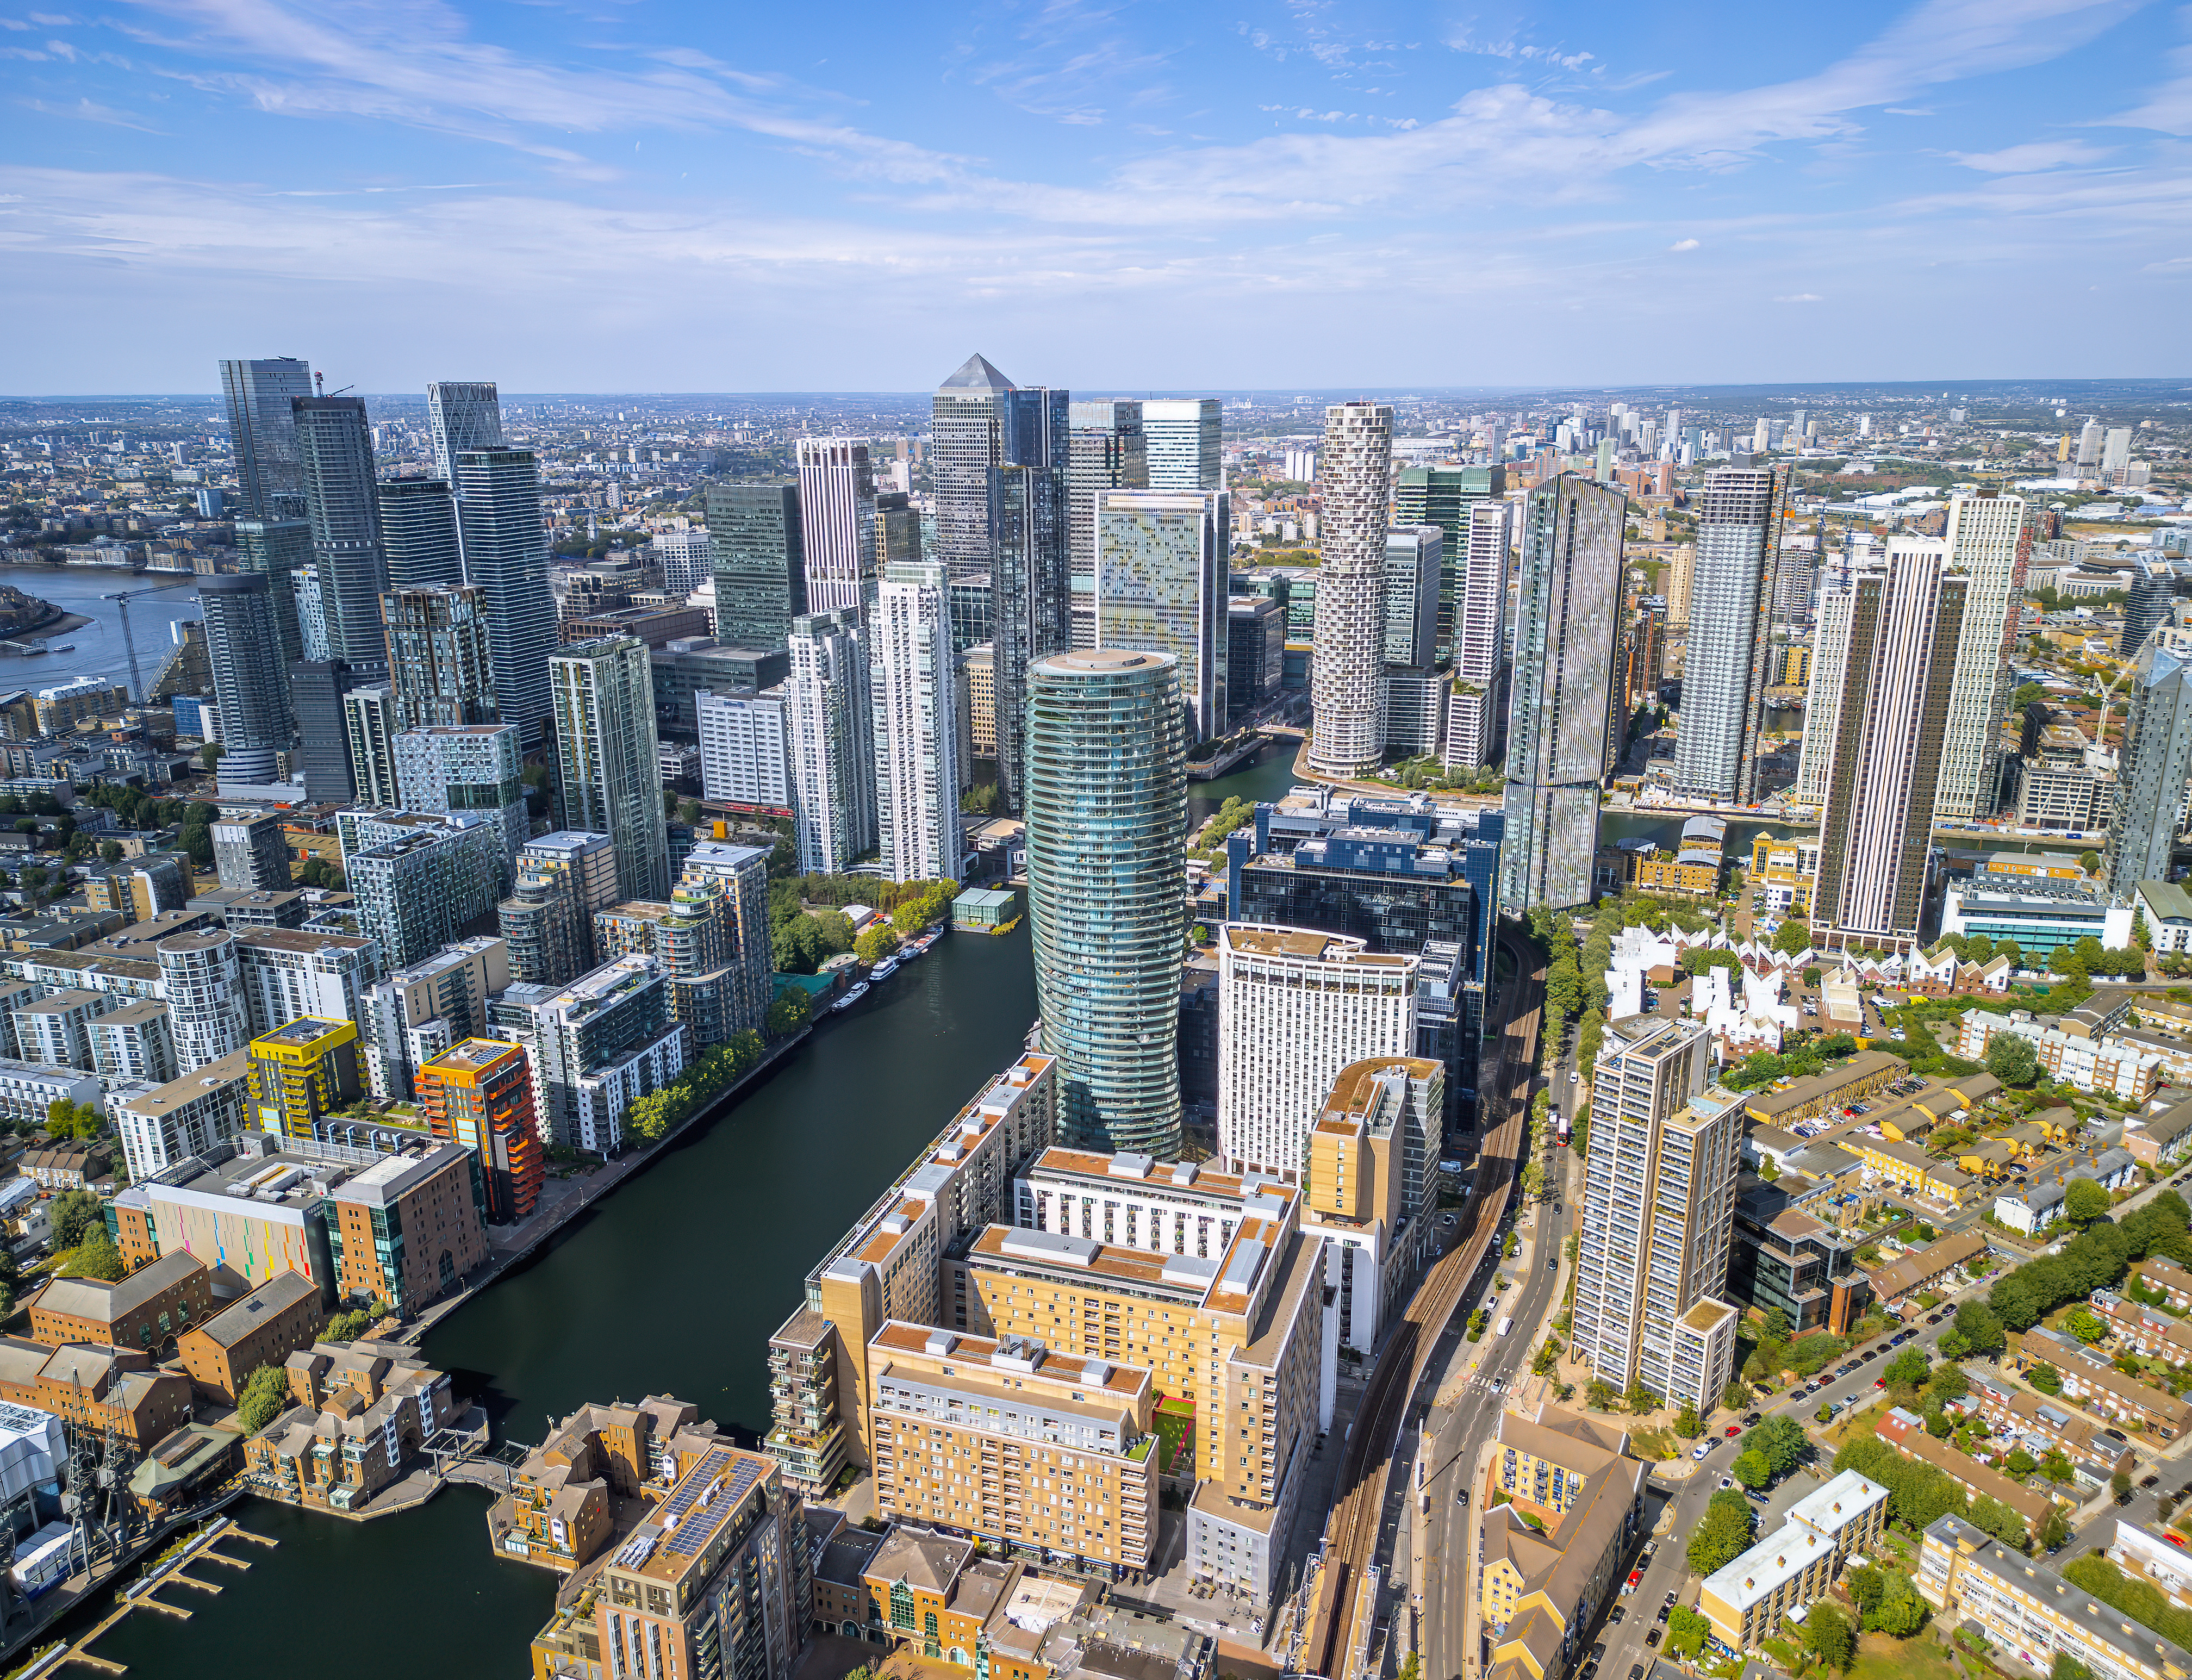


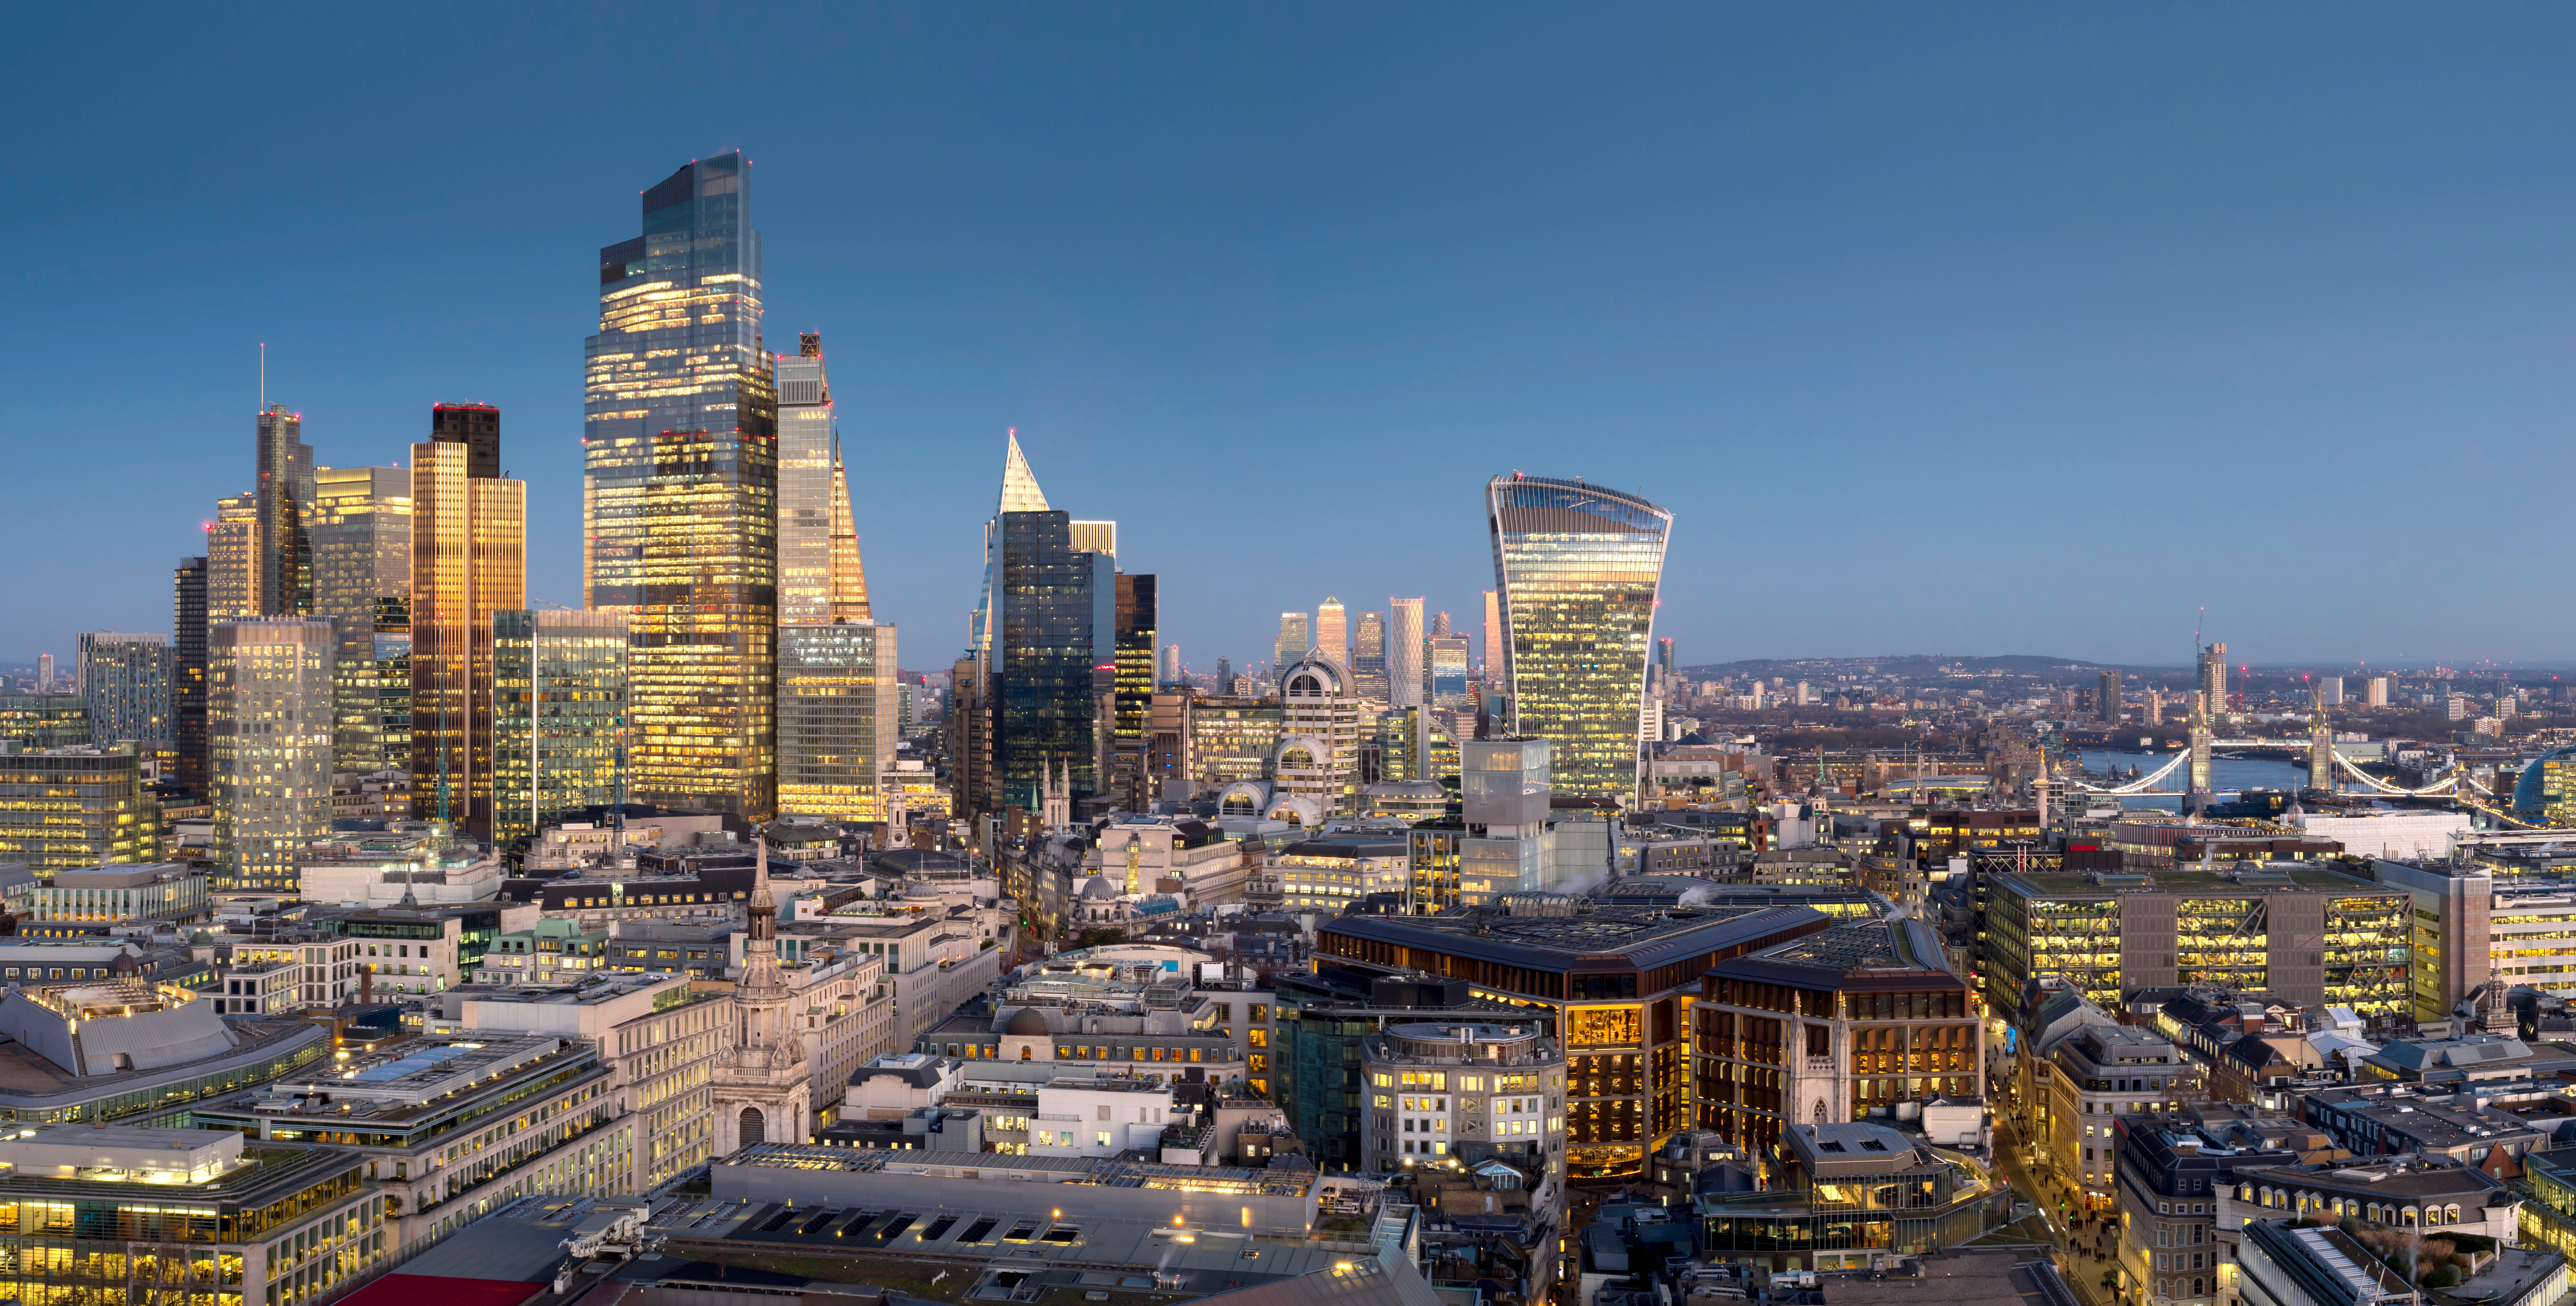
Credits: ADOBE STOCK


SCROLL�TO EXPLORE


THE CONTRACTORS
THE NET EFFECT
�This was reinforced by overall contraction of 656,000 sq ft recorded for the year – the third consecutive decline�and the lowest level since 2020.
While the Wider City was the dominant market for expansions, it was also where the most contractions occurred, with 57 businesses reducing their Central London footprint through relocation by 553,000 sq ft. A large proportion of these were�in the City Core, where 30 occupiers reduced by a total of 416,000 sq ft. In the West End, 17 businesses contracted by 90,000 sq ft and just 2 occupiers reduced their footprint by 13,200 sq ft in East London.
The number of businesses reducing theIR office footprint reduced from 88 in 2024 to 76 in 2025 as occupiers continue to be less bearish on their office requirements than they were three years ago.
This equated to a loss of 126,000 sq ft and 368,000 sq ft, respectively. Just one contractor recorded a loss of more�than 100,000 sq ft of space, State Street relocating to 100�New Bridge Street, with all other contractors reducing�by less than 35,000 sq ft.
Of the 76 contractions, 64 leased space between 5,000 to 25,000 sq ft, equating to a loss of 327,000 sq ft and making up half of the total volume of space reduced. Looking at deals over 100,000 sq ft, with just the one recorded contraction�by State Street, on a net basis, this size band was overall expansionary by 1.19 million sq ft – the second strongest�year on record, behind 2018.
The Professional Services and Banking & Finance sectors were remained as the prominent contractors, with 23 and 19 companies reducing their office footprints in 2025.
THE EXPANDERS
THE NET EFFECT
�This included both business who acquired an additional office space or those that relocated and leased more space than their previous office. This accounted for total take-up of 6.62 million sq ft, and total expansion of 4.47 million sq ft for the year.
The majority of the expansionary activity occurred in the Wider City market, where 185 of the 244 established occupiers expanded by 2.44 million sq ft. This was primarily led by the City Core submarket, where three of the top 10 expansion deals across Central London were located, including the largest; Squarepoint’s relocation to 65 Gresham Street, which will see them increase their Central London footprint by 300,000 sq ft. Canary Wharf was also a submarket with 3 significant expansions, including; Visa’s relocation from Paddington where they are expanding by 100,000 sq ft and HSBC committing to 170,000 sq ft and adding to their existing portfolio of Central London assets.
In 2025, 313 existing Central London occupiers added to their office footprint, below the 321 that was recorded for 2024 but in line with the 5-year average.


NEW�ENTRANTS
THE�NET EFFECT
THE�SPILLOVER�IMPACT
Projecting the long-term grade A average take-up forward for the next five years, the market is expected�to be in a supply deficit of 7.40 million sq ft by 2030�as a base case, with the inclusion of pipeline probable schemes an optimistic view, adding even more upward pressure to rental values in the sought-after, transport rich submarkets of Central London. Excluding the pipeline probable category, the low volumes of under construction space creates a far more challenging environment. The next spillover is not necessarily�where there is space or development, it is where�demand has already proven it wants to go.
Taking all of this into account, and looking at the supply and demand dynamics, this supply squeeze is expected to intensify over the next five years.

The demand from AI businesses in Central London has accelerated rapidly over the past 12-18 months. In 2025, 15% of take-up from the Technology sector was from AI-focused businesses, defined as organisations where artificial intelligence is core to the product and its primary competitive advantage.
NEW�ENTRANTS
ACCELERATION�OF AI DEMAND


A further 15 maintain a smaller presence below the size threshold. Among these are those we would class as large diversified technology businesses, those focused on AI infrastructure and those that are fundamentally AI-first. The regional origins reinforce London’s status as a global AI hub – of the 46 substantial occupiers, 72% are US headquartered. This reflects the importance of London as the default European HQ for US technology firms seeking access to the region’s talent, capital and enterprise client base, enabling them to develop their products further.
Taking these 46 occupiers, our forecast models yields a base case of 1.3 million sq ft of additional office demand in Central London for the next three year, with an upside of 2.8 million sq ft projected. These figures represent the net new space required by the 46 established companies, driven by potential headcount growth against current occupied areas.
In order to understand the future scale and size of demand, we have looked globally at all AI companies valued over $1 billion – 117 businesses that represent $32 trillion in aggregate enterprise value. Of these, 46 substantial occupiers already operate in London offices over 10,000 sq ft, with their aggregate London footprint estimate at approximately 1.3 million sq ft today.
This is one example of an AI business grown elsewhere�and looking to expand their footprint – a source of future occupational demand for the sector. Anthropic followed, announcing their expansion into 160,000 sq ft in 1 Triton Square, increasing headcount from 200 to 800 as they look to expand their research capabilities across Europe. Furthermore, Databricks’ pre-let of 135,000 sq ft at 10. Howland Street on a 15-year lease in Q1 2026 – the largest single-building AI-sector commitment�in London – demonstrates the long-term confidence of a well-funded and rapidly growing AI platform company in London.�The main potential drivers for these moves centre around London acting as a stable base out of the US, offering access�to top-tier talend and a robust AI research ecosystem.
April 2026 saw the announcement of OpenAi securing its first permanent London office, taking 88,000 sq ft in King’s Cross – this was expansion space driven by the firms plans to make London its largest research hub outside of the US.
While still to play out, there are a number of areas where this AI boom period may differ. Firstly, at present, AI businesses typically employ fewer people than traditional technology firms, but they have been known to generate higher revenue per employee allowing these firms to operate at a higher office density per employee.
Another differentiator between the Technology and AI boom periods is around motivation for growth – the expansion of the Technology sector was largely driven by increasing headcount and as a result, increasing office footprints. BY CONTRAST, THE CURRENT AI BOOM IS MORE RESEARCH DRIVEN, THEREFORE THE NEED FOR FLEXIBLE AND HIGH SPECIFICATION WORKSPACES ARE REQUIRED, ALTHOUGH�THIS DIFFERS FOR THE DIFFERENT AI VERTICALS.
The final key difference is the broader market environment. The Technology boom of the 2010s was during the post-GFC recovery period, whereby new office supply was higher and therefore there was less competition for prime space, and locality to transport hubs was less significant. The environment today is markedly different – a desire for grade A space in core locations, which is constrained due to a shrinking development pipeline because of viability challenges – and this will continue to impact the growth of this emerging sector, but also traditional sectors too.
TECH-BOOM�VERSUS AI-BOOM
ACCELERATION�OF AI DEMAND
Between 2000-2010, the Technology sector typically accounted for 15-20% of total Central London take-up, but during its boom period from 2011 through to 2019, that market share averaged 45% - peaking at 69% in 2014. This was driven by acquisitions from key tenants including Google, Meta, Apple and Amazon, among others. In fact, the four aforementioned tenants leased over 4.5 million sq ft across 35 transactions during that period.
�
The trajectory of the AI sector broadly follows that of the Technology sector in the 2010s, but more in its intensity than its scale.
TOP DOWN
ACCELERATION�OF AI DEMAND

Scoring each of these on a nine-component model that evaluates factors including current UK presence, publicly stated expansion plans and recent fundraising activity, the forecast model suggests a base case of 305,000 sq ft, which doubles to 610,000 sq ft in the upside case, with the latter reflecting a possibility of those with a low probability in the base case converting to active requirements as the AI sector’s growth trajectory encourages more aggressive global expansion strategies. Understanding the plans of these businesses is the most difficult to ascertain, and if anything our estimations may be on the conservative side.
Examples of pipeline companies include CoreWeave, who are expanding European operations with a London hub for enterprise sales and technical support; Cohere has identified London as its primary European base; and xAI – a venture by Elon Musk – and Helsing both with significant potential London requirements.
Beyond these established companies, our�top down analysis identifies 71 pipeline companies with a meaningful probability�of establishing, or substantially expanding, a London office over the next three years.


Annualised, this represents 467,000 sq ft per year under the base case and 1.0 million sq ft under the upside, figures that would represent a significant addition to London’s annual office take-up.
Combined, these 320 businesses are projected to yield a base case demand projection of 1.4 million sq ft and an upside of 3.1 million sq ft over the three-year period.
Many start-ups begin their journey in Central London by taking smaller units of space, either on a traditional lease or flexible workspace agreement, and with rapid expansion of investment and employment for some of these businesses, the sector is in need of more space in the capital.
We have identified 320 active, venture-capital backed AI companies across the UK, of which 57% are concentrated in London, including well-known scale-ups such as Wayve and Synthesia and fast growth enterprises like PolyAI and Darktrace. The 320 companies span 13 distinct AI verticals, each with different demand characteristics, growth trajectories and submarket preferences.�
While the large AI occupiers will ultimately turn the dial on leasing activity, London’s office market is equally shaped by the hundreds of smaller, fast-growing companies emerging from the UK’s�own AI ecosystem.
BOTTOM UP
ACCELERATION�OF AI DEMAND


As the AI sector continues to evolve, the demand for office space in Central London is forecast to increase by up to 2.1 million sq ft per year over the next three years – not quite at the levels of growth seen across San Francisco, where office demand has been exponential, and not to the extent of the tech sector boom of the 2010’s.

The global AI businesses captured by the top-down model generate large, landmark requirements in core markets and for best-in-class space. The scale-ups captured by the bottom-up model generate distributed demand: typically 5,000 to 30,000 sq ft with flexible lease terms and in more cost-effective locations. This means that the combined demand picture is perhaps less concentrated than it might appear, and is likely to spread across Central London’s submarkets, where supply is available. Landlords and developers who understand this distribution can position their assets accordingly and will be best placed to capture the structural tailwind that AI represents for London’s office market through the remainder of this decade.
The most important insight from the combined analysis is that the top-down and bottom-up demands are structurally different in company type, floorspace requirements, submarket preferences and lease structure. This is in addition to traditional technology sector take-up.
While the acceleration of office demand from AI businesses in Central London shares the growth momentum and broad clustering dynamics of the Technology boom,�this sector is more mature�and selective in its expansionary phase, shifting from quantity�to quality and from scale�to specialist requirements.
�
THE WHOLE�PICTURE
ACCELERATION�OF AI DEMAND


While the upside scenario is ambitious, it is not unreasonable and requires a conjunction of favourable market conditions, rapid expansion by leading global AI businesses, a supportive UK policy environment and adequate supply in target submarkets. Even in the base case of approximately 1.0 million sq ft per year, this represents a transformational shift in the projected tenant composition of London’s office market, with expected take-up still high enough to be classified as a sector in its own right.
TOP�DOWN
BOTTOM-UP
THE WHOLE�PICTURE


The Professional Services sector came second by count, with 72 occupiers expanding by 416,000 sq ft. However, when looking at the sectors by quantum of total expansion, the Technology sector came second, increasing floorspace by 479,000 sq ft across 53 occupiers. Of the 12 deals over 100,000 sq ft in 2025, 11 expanded on their Central London footprint, including the two largest deals of the year – Squarepoint and Visa. Small to medium sized businesses remain the drivers of expansion, with the 266 businesses occupying less than 25,000 sq ft increasing their office floorspace by 1.98 million sq ft, outstripping the 25,000-100,000 sq ft market, where 36 businesses increased their footprint by 1.16 million sq ft.
The Banking & Finance sector was the most active for expansions in 2025, with 94 businesses taking additional space across London – 48 in the West End, 38 in the City and 8 in East London – with total net expansion of 1.70 million sq ft.


This equated to 114,000 sq ft but nevertheless made up just 1%�of total Central London take-up. Q1 2026 however has seen activity surge – 230,000 sq ft was transacted in the first three months of the year, making up 50% of total Technology sector activity and 12% of Central London leasing, the highest proportions recorded. A further 250,000 sq ft from AI-focused businesses has already completed in April (Q2) and if this momentum continues throughout the year, the total quantum leased by this sector group would be the highest volume on record. However, the reality is that we are still at the beginning of the cycle with regards to the sector’s occupational demand, and in order to best understand the potential for growth, we have looked at this from both a top down and a bottom up perspective.
AI Enterprise Software is the largest vertical, comprising 87 companies and generating a base case demand estimate of 341,000 sq ft and an upside of 695,000 sq ft over the next three years. Whilst their space requirements are individually modest, when combined they have the potential to drive AI take-up substantially. These businesses are likely to cluster around King’s Cross, Shoreditch, Clerkenwell and the fringes of the City where tech-friendly building stock, transport connections and the creative neighbourhood atmosphere supports talent attraction.
AI FinTech and Financial Services, though comprising only 24 companies, punches dramatically above its weight in terms of demand potential. Its base case of 402,000 sq ft an upside of 968,000 sq ft makes it the single largest demand-generating vertical on a per-company basis. This is reflective of the unique characteristics that define this group: they tend to be better funded than the average AI startup and they require office space in close proximity to Banking & Finance and Insurance clients, which make up a significant proportion of London’s office footprint. Target locations for this cohort is likely to be spread across London submarkets, where rents are higher but the client adjacency justifies the premium.
TAKE NOTE�THE CHART�WILL HAVE ADD VALUE LIKE�CONSISTENCY AND READABILITY NEXT VERSION
TAKE NOTE�THE CHART�WILL HAVE ADD VALUE LIKE�CONSISTENCY AND READABILITY NEXT VERSION
TAKE NOTE�THE CHART�WILL HAVE ADD VALUE LIKE�CONSISTENCY AND READABILITY NEXT VERSION
TAKE NOTE�THE CHART�WILL HAVE ADD VALUE LIKE�CONSISTENCY AND READABILITY NEXT VERSION
TAKE NOTE�THE CHART�WILL HAVE ADD VALUE LIKE�CONSISTENCY AND READABILITY NEXT VERSION
TAKE NOTE�THE CHART�WILL HAVE ADD VALUE LIKE�CONSISTENCY AND READABILITY NEXT VERSION
TAKE NOTE�THE CHART�WILL HAVE ADD VALUE LIKE�CONSISTENCY AND READABILITY NEXT VERSION
TAKE NOTE�THE CHART�WILL HAVE ADD VALUE LIKE�CONSISTENCY AND READABILITY NEXT VERSION
TAKE NOTE�THE CHART�WILL HAVE ADD VALUE LIKE�CONSISTENCY AND READABILITY NEXT VERSION
CHART�IN-PROGRESS
WILL ADD�ANIMATION�ONCE APPROVED
PLEASE PROVIDE�IMAGERY
PLEASE PROVIDE�IMAGERY
PLEASE PROVIDE�IMAGERY
PLEASE PROVIDE�IMAGERY
PLEASE PROVIDE�IMAGERY
PLEASE PROVIDE�IMAGERY
PLEASE PROVIDE�IMAGERY

As a result, occupiers are faced with two choices – stay put�for a period or relocate to bordering submarkets where choice�is available. So what does this mean for London’s office geography?
PLEASE�PROVIDE�IMAGERY
PLEASE�PROVIDE�IMAGERY
PLEASE�PROVIDE�IMAGERY
TECH-BOOM�VS AI BOOM
talent and a robust
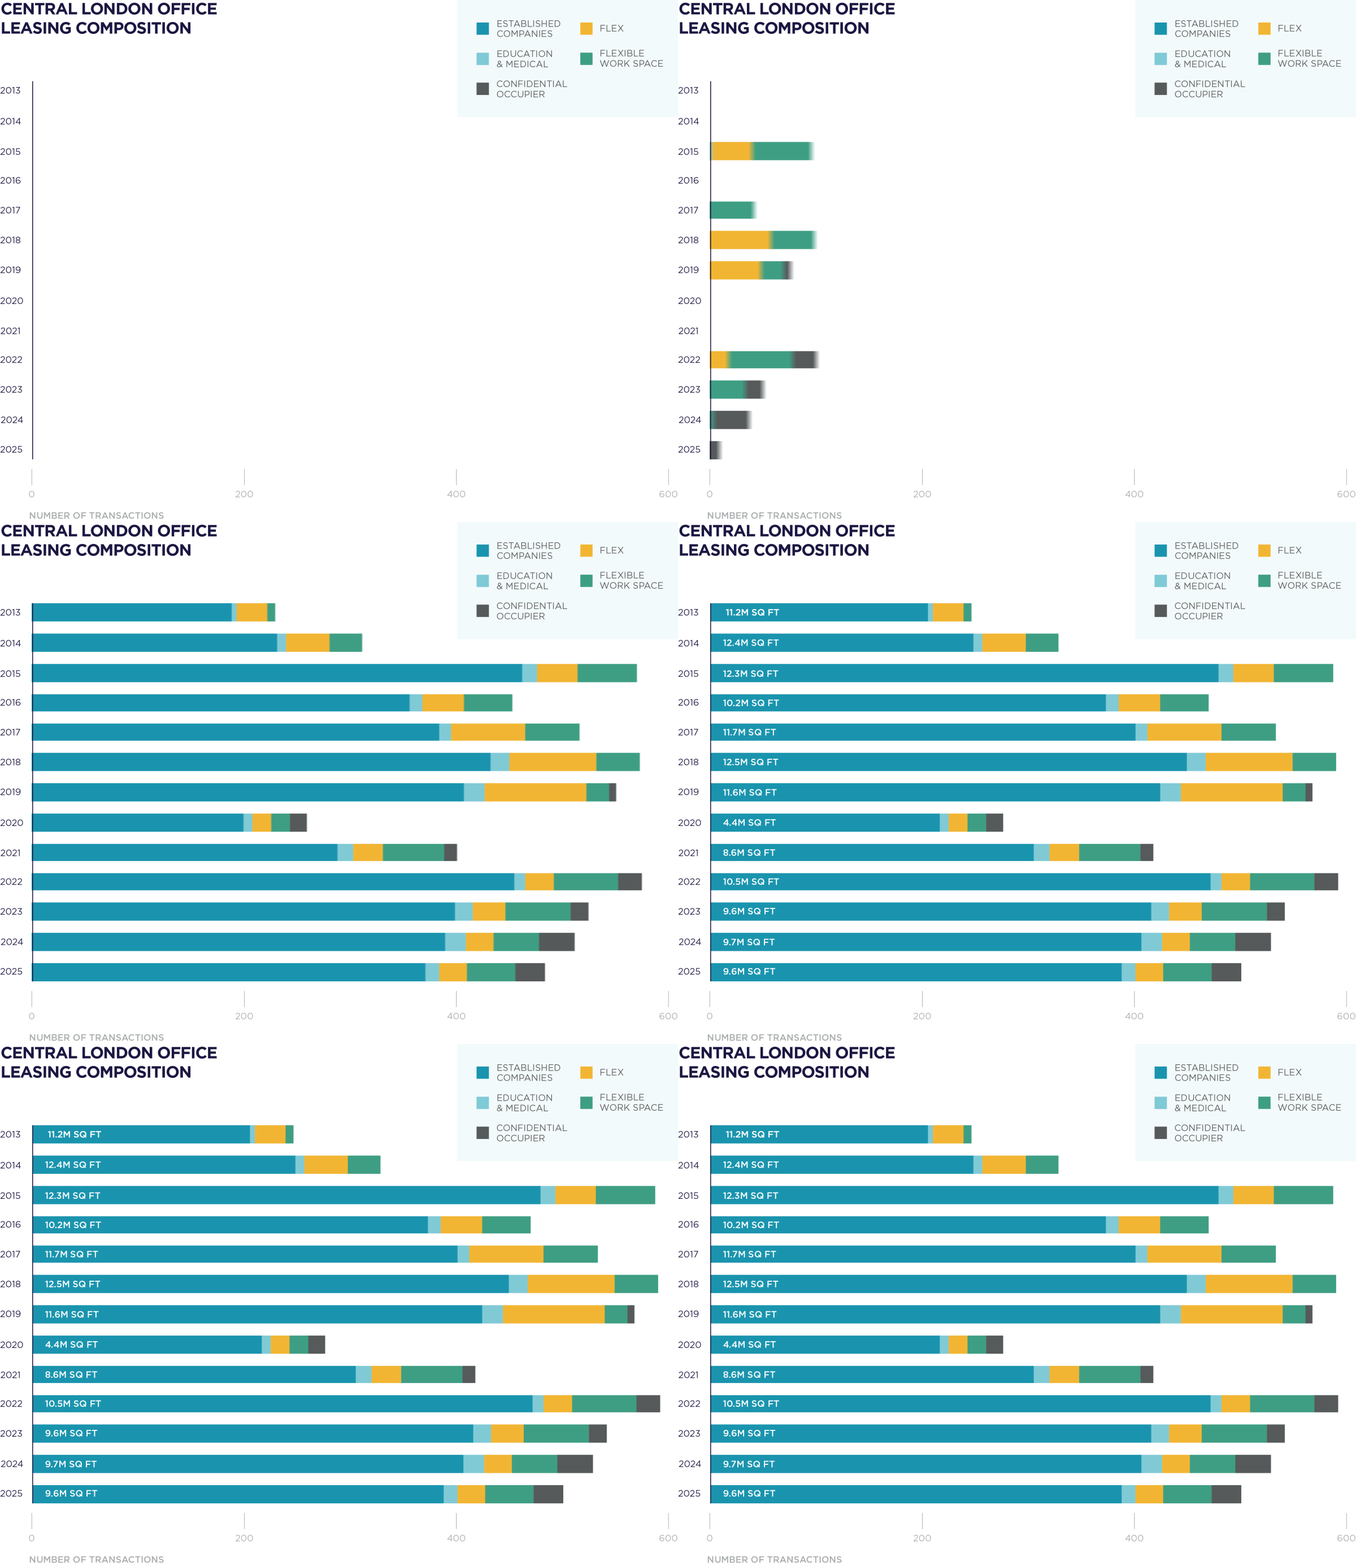
The remaining 390 transactions were signed by established Central London occupiers, down by 5% on 2024 but 1% ahead of the 10-year average. ��A large proportion of the deals occurred in the Wider City where 296 leases were signed, equating to a 59% market share – slightly ahead of the 57% market share recorded over the last 10 years. The West End reported 181 transactions, just two deals shy of the previous year, while 27 transactions were recorded in East London. This equated to 5.6 million sq ft in the Wider City, 2.9 million sq ft in the West End and 1.1 million sq ft in East London.
Of the established companies, 94 expand their current Central London footprint by adding an additional office space to their existing portfolio, equating to 1.65 million sq ft of take-up. The remaining 296 occupiers relocated to a new office in Central London, a marginal 3% reduction on 2024.�
A further 46 deals were transacted by new market entrants either new businesses or those relocating from outside Central�London while 28 deals remained confidential.
MAP SAMPLE FOR PLACEMENT ONLY
CENTRAL LONDON MARKETS
This was 5% below the 2024 count but remained in line with the 10-year average. There were 26 transactions signed by Flexible Workspace operators, equating to 610,000 sq ft – identical to the prior year in terms of count and 3% higher on the quantum of space leased. Despite deals numbers for Education & Medical occupiers reducing from 20 in 2024 to 14 in 2025, the quantum of space increased by 27% year-on-year to 460,000 sq ft – the highest leased space on record.
Across Central London, there were 504 lease transactions reported in 2025, equating to 9.6 million sq ft.
OVERVIEW
Credits: ADOBE STOCK


stayers
An occupier moving office within the same Dublin CBD submarket�as the previous office
RELOCATORS
An office expansion, either within the existing office location or a secondary/tertiary location in�Dublin CBD
EXPANDERS
flexible workspace
The West End overtook the Wider City market in attracting new entrants –�the first time since 2020 – with 25 deals totalling 231,000 sq ft.
This sub‑market has become a focal point for multinational corporates and technology-led occupiers, benefitting from best‑in‑class Grade �A developments and a dense mix of residential, leisure and waterfront amenities. Extending �north of the River Liffey, the IFSC and North Docks, largely within Dublin 1, represent Dublin’s modern financial and commercial quarter, �defined by larger floorplates, high sustainability credentials and strong connectivity via the Luas light rail and mainline rail networks. �On the fringe of this submarket, we also capture activity in the North City area close by.
Further south and east, Ballsbridge, firmly anchored in Dublin 4, is considered part of the wider CBD for office market purposes, offering highly prestigious office accommodation close to embassies, hotels and green spaces. Together, these interconnected sub‑markets form�a compact yet diverse CBD geography.
The geography�of Dublin’s CBD
NEW�ENTRANTS
MAP SAMPLE FOR PLACEMENT ONLY
CENTRAL LONDON MARKETS
This was 5% below the 2024 count but remained in line with the 10-year average. There were 26 transactions signed by Flexible Workspace operators, equating to 610,000 sq ft – identical to the prior year in terms of count and 3% higher on the quantum of space leased. Despite deals numbers for Education & Medical occupiers reducing from 20 in 2024 to 14 in 2025, the quantum of space increased by 27% year-on-year to 460,000 sq ft – the highest leased space on record.
“Dublin Moves" examines which sectors are driving mobility, the types of buildings attracting relocation demand, the strategic motivations behind moving decisions and the specific CBD sub‑markets benefitting most from renewed momentum. As future development pipelines remain constrained relative to long‑term�demand, understanding relocation patterns will�be critical to anticipating the next phase of Dublin’s�office cycle—one increasingly defined by competition for high‑quality, well‑located space in the heart�of the city.
INTRODUCTION

Credits: ADOBE STOCK
The inaugural edition of “Dublin Moves” provides a comprehensive analysis of the who, what, why and where of office relocations across Dublin’s Central�Business District (CBD) in 2025.
Our report explores the dynamics of moves in the Dublin market at a pivotal juncture. The Dublin office market has experienced a strong improvement in office take‑up since
early 2023, culminating in 2025 delivering the strongest annual performance since 2019.
Dublin’s CBD as illustrated (see graphic),�broadly spans the historic core of the city and its adjoining docklands, forming the primary focus Of office occupier demand.
The Traditional Core sits mainly within Dublin 2, encompassing areas such as St Stephen’s Green, Kildare Street , Merrion Square and�the central spine of Harcourt Street and�Dawson Street. This area is characterised by established office stock, premium retail�and hospitality amenities, and proximity to key transport hubs, making it particularly attractive to professional services, legal and financial occupiers.
South of the river, the CBD continues east into the South Docks, spanning parts of Dublin 2 and Dublin 4, including areas such as Grand Canal Dock�and the South Quays.


DUBLIN CBD AREAS
2025
A BETTER YEAR
FOR OCCUPIER
ACTIVITY
As noted earlier, 2025 marked a much stronger year for activity in the Dublin office market.
Within the CBD we saw a total of 125 deals last year amounting to approximately 167,000 sq.m (1.80 million sq.ft) of space taken. This was a marked increase compared to 2024 where we saW 98 deals and approximately 129,600 sq.m�(1.39 million sq. ft) of space taken.

Comprising all occupiers that have relocated their office from outside Dublin CBD or are a new occupier in the CBD market
NEW ENTRANTS
HOVER ON EACH BOX TO LEARN MORE
3e9d82
3e9d82

Demand in the CBD remains very much centred on the Traditional Core submarket, which accounted for 51% and 65% of deal numbers and space taken respectively in 2025 (see charts 1 and 2) with these weights being largely unchanged compared to 2024.
Outside the Traditional Core most of the activity in 2025�was focused on the North and South Docks, the North Docks in particular seeing a notable pickup in activity compared�to 2024.�
As noted earlier, 2025 marked a much stronger year for activity in the Dublin office market. Within the CBD we saw�a total of 125 deals last year amounting�to approximately 167,000 sq. M�(1.80 million square feet) of space taken.


The CBD accounted for roughly two-thirds of the space absorbed last year, underlining Its enduring appeal�to occupiers prioritising location, amenities and access to deep talent pools. This rebound in demand has contributed to a rapid tightening of conditions within�the CBD. Over the past year, vacancy has fallen as�strong leasing activity has begun to outpace new supply.
Our data indicate that the CBD availability rate has declined by around 1.5% over the past year, to 14.9%�at the end of Q1 2026.


When measured by space taken, deals for over 3,000 sq.m accounted for 50% of the space taken in the CBD,�in large part thanks to Workday’s lease of College Square (approximately 38,700 sq.m or 416,000 sq.ft). �
When we break down the LETTINGS�by size bracket, we see that approximately�71% of deals done in the CBD last year�by number were for less than 1,000�square metres (10, 764 square feet,�see chart 3) while only 8% of deals�by number were for spaces over 3,000�sq. m (32,292 square feet).

The largest deals were seen in the Traditional�Core submarket of the CBD (chart 5)
The average deal size across the CBD�as a whole was approximately 1,335 sq.m�in 2025 (14,370 sq.ft), 1% higher than 2024 �– excluding the Workday deal�the average deal size was 1,044 sq. m (11,238 sq.ft).


PLEASE PROVIDE HEATMAP
PROFESSIONAL SERVICES – LARGEST MOVES

There were four relocations over 100,000 sq ft in this sector group, including the largest leasing transaction�of the year, Squarepoint’s 404,000 sq ft pre-let at 65 Gresham Street in the City Core, a relocation from approximately 100,000 sq ft at 1 Ropemaker, also in the City Core. Visa’s commitment to 300,000 sq ft followed, a relocation that will take them from Paddington to Canary Wharf and expand by 100,000 sq ft. State Street’s pre-let of 100 New Bridge Street in the City depicted a significant contraction of space, downsizing from 350,000 sq ft to 195,000 sq ft, however this reflects leased space and actual occupied space is believed to have been lower; and finally Ares committed to 128,000 sq ft in Mayfair, future expansion space�when the business moves in in 2028.
Banking & Finance occupiers were also active in 2024, with 84 recorded movers totalling 2.55 million sq ft – this was the highest number of movers since 2019. Continuing on from 2024, there were more movers into the Wider City for this sector (47) than in the West End (34), with the remaining 3 taking place in Canary Wharf.
PLEASE�PROVIDE�IMAGERY
OF THE TOTAL, 34 MOVED INTO A WIDER CITY SUBMARKET WHILE THE REMAINING 18 WERE IN THE WEST END, EQUATING TO A TOTAL OF 670,000 SQ FT – THE LOWEST QUANTUM OF LEASED SPACE SINCE 2020. FIN-TECH BUSINESS rIPPLE'S LETTING AT 1 LEADENHALL FOR 93,000 SQ FT WAS THE LARGEST RECORD MOVER FOR THE SECTOR, A RELOCATION OUT OF ANOTHER CITY CORE BUILDING AND A TOTAL NET EXPANSION OF 75,000 SQ FT.
In the Technology sector, 52 moves were recorded in 2025 (24 stayers�and 28 relocators), matching�activity in 2024.
Relocations and Stayers
Relocations and Stayers
Large‑Scale Relocations
Large‑Scale Relocations
Average distance
Average distance
Suburban relocations
Suburban relocations
Standalone expansions
Standalone expansions
In 2025, 23 occupiers entered the CBD for the first time, accounting for approximately 14,225 square metres (153,100 sq.ft) of take‑up. Both the numbers of new entrants and total space absorbed was above the previous year. Notably, more than half of 2025’s new entrants—by both occupier count
and floor area—relocated from suburban locations within Dublin.�Three of these new entrants also moved to new CBD premises from�serviced office locations.
The Traditional Core and South Docks were the primary destinations for new entrants, together accommodating around 70% of all space taken by new entrants during�the year. Technology and professional services firms dominated new entrant activity.
The technology sector recorded eight new entrants, representing close to 4,500 sq. m (48,100 sq.ft) of take‑up. Notable examples include eShopworld, which relocated from Airside Business Park, Swords, to lease approximately 1,500 sq.m (15,600 sq.ft) at No. 3 Dublin Landings in the North Docks, and Softcat, which moved from Dún Laoghaire to take around 600 square metres (6,400 sq.ft) at Burgh Quay in the Traditional Core. Within the professional services sector, new entrants included Ethos Engineering,�which relocated from Sandyford to lease approximately 1,300 sq. m (14,300 sq.ft)�on Charlemont Street, and PKF Brenson Lawlor, which moved from Donny brook�to lease a similar quantum of space in the Ballsbridge submarket.
Suburban relocations
fuel new CBD entrant�activity in 2025


Focusing on standalone expansionary deals, eight transactions in 2025 resulted in approximately 22,300 square metres (240,200 square feet) of additional take-up with most of these expansions occurring either into the Traditional Core or North Docks submarkets.
In the professional services sector Deloitte leased almost 9,000 square metres in total (94,500 sq.ft) including space on Burlington Road while in the technology sector Apple secured approximately 3,500 square metres (37,800 sq.ft) at 4/5 Park Place�on Adelaide Road and has also recently taken additional space there.�The healthcare sector also saw some expansionary activity in 2025 with the Mater Private Hospital leasing space across the Docklands in both the North Docks (One North Dock) and South Docks (The Grain Store) Service offices were a further�source of take-up in 2025 with three deals totalling approximately 2,400 sq.m
(25,500 sq.ft), down from nearly 8,000 square metres (83,300 sq.ft) in 2024.
Standalone expansions�also support CBD activity
One of the most striking findings from our analysis is the limited distance associated with CBD moves in 2025, whether within the same submarket�or between submarkets. Using ‘as the crow flies’ measurements via�Google Earth, we estimate that the average distance moved�(for both stayers and relocators) was just 1.1 kilometres.
Stayers moved an average of 0.6 kilometres, while relocators travelled only slightly further, by an average of 1.5 kilometres. Among relocators, the most mobile sectors were technology, insurance, and banking and finance. However, even within these sectors, relocation distances remained modest, averaging 1.9 kilometres for technology occupiers, 1.8 kilometres for insurance, and 1.5 kilometres for banking and finance.
Average distance moved�just 1.1 kilometres in 2025
As in 2024, relocation activity was heavily concentrated in the Traditional Core and the South Docks. Together, these submarkets accounted for 67% of relocations by number and 87% by space taken, with the remaining activity evenly split between Ballsbridge and the North Docks.
Meanwhile, occupiers that moved while remaining within their existing submarket
were predominantly based in the Traditional Core. This submarket represented almost
two-thirds of both the number of moves and space taken by stayers in 2025. Notable transactions included Maples’ lease of approximately 6,900 sq.m (74,000 sq.ft)�at 75 St Stephen’s Green, EY's 5,100 square metres (54,670 square feet) deal for�additional space at Wilton Plaza and Marsh McLennan’s acquisition of around�4,500 sq.m (48,340 sq.ft) on Lower Baggot Street.
Large‑Scale Relocations Concentrated in Traditional Core and South Docks
The majority of activity during the year was driven by stayers and relocators. While these two groups recorded a broadly similar number of transactions, relocators accounted for a disproportionately large share of take-up, representing 38% of total CBD space leased.
Workday’s relocation to College Square in the Traditional Core—having moved from
Dockline and the King’s Building, Smithfield—was the largest relocation of the year, totalling approximately 38,700 square metres (416,000 sq. ft). Other notable relocations included Intertrust, which secured approximately 2,000 square metres (21,580 sq. ft) at the Sidings and PartnerRe which took approximately 1,800 sq. m (19,200 sq. ft)
at the Exchange Building in the North Docks
Relocations and
Stayers Drive the
Bulk of CBD Activity
Local Loyalty here
Local Loyalty here


HOVER ON EACH BOX TO LEARN MORE
2025’s leasing patterns point to a clear�consolidation of occupier demand within Dublin’s CBD.
Despite ongoing structural debates around hybrid
working and space efficiency, office mobility during
the year was overwhelmingly focused on the CBD,
with even some suburban‑based occupiers choosing
to move back into the city. This trend underscores
the enduring value that occupiers continue to place on proximity, amenity density, brand presence and access
to deep labour pools.
KEY IMPLICATIONS


Occupier demand consolidating
in the CBD
Average distance�moved just
1.1 kilometres
RECORD HIGH

Leasing environment growing more�competitive


RECORD HIGH
Tightening CBD�market supports�rental outlook


Resilient�Occupier�Backdrop


PLEASE�PROVIDE�IMAGERY
OF THE TOTAL, 34 MOVED INTO A WIDER CITY SUBMARKET WHILE THE REMAINING 18 WERE IN THE WEST END, EQUATING TO A TOTAL OF 670,000 SQ FT – THE LOWEST QUANTUM OF LEASED SPACE SINCE 2020. FIN-TECH BUSINESS rIPPLE'S LETTING AT 1 LEADENHALL FOR 93,000 SQ FT WAS THE LARGEST RECORD MOVER FOR THE SECTOR, A RELOCATION OUT OF ANOTHER CITY CORE BUILDING AND A TOTAL NET EXPANSION OF 75,000 SQ FT.
In the Technology sector, 52 moves were recorded in 2025 (24 stayers�and 28 relocators), matching�activity in 2024.


What is particularly striking is the very small distances travelled as companies moved office. An average move distance of just 1.1 kilometres suggests overwhelmingly that decisions were driven by a desire to upgrade
building quality, sustainability credentials or workspace configuration while remaining close to existing
talent and client networks.

Moves within the core CBD submarkets also�point to a leasing environment that is growing more competitive. Occupier decision‑making in 2025 increasingly reflected a desire to secure high‑quality, well‑located accommodation within an already familiar geography against the backdrop of tightening�availability and a shrinking development pipeline.

This dynamic was particularly evident for new Grade A space, where CBD transactions for larger modern space during�the year were in some cases completed at headline rents of�up to approximately €700 per square metre (€65 per sq.ft)�in 2025. These outcomes for prime assets together with tightening availability and shrinking future supply have been�a factor in our upgrades for Dublin prime office rents in recent quarters. The incidence of “stayers” in the data could also be�a recognition of the fact that well‑located, future‑proofed buildings within the CBD are becoming increasingly difficult�to replicate.

Finally, while the Workday deal at College Square undoubtedly stood out as an outlier in 2025’s take-up figures, the underlying deal flow for the time being�remains focused on smaller and mid‑sized spaces. That said, the greater lease activity in 2025 and the continued�activity of technology and professional service firms in particular hints at a quiet confidence amongst occupiers even in the face of a rise in geopolitical concerns over�the past year - albeit one that is increasingly polarised around prime, centrally located buildings.

Conclusion
Our analysis of office moves across Dublin’s CBD in 2025 highlights a number of clear�market messages below
The limited distances moved by occupiers show that tenants are seeking improved sustainability credentials, modern specifications and more efficient, experience‑led work environments, while remaining close to established talent pools and client networks. Buildings that fail to meet these expectations are increasingly at risk of obsolescence, even within prime locations.
At the same time, the leasing environment is becoming more competitive within core CBD submarkets. Tightening availability, a constrained development pipeline and demand for Grade A space are combining to support the outlook�for prime rents. The need for larger occupiers to secure�high quality space early and remain within familiar locations�in a market overshadowed by future supply risk is likely to further underpin this outlook.
For developers, landlords and investors the message is�clear. Assets that are well located, sustainably designed and capable of accommodating evolving workplace strategies are best positioned to outperform over the coming cycle.
The distances�moved by occupiers have been small�at an average of 1.1 kilometres

Generally,�the larger the�deal the less�distance travelled

New entrants to the CBD typically chose the traditional core�as their location�of choice

A pattern in New Entrants to the CBD were relocations from the south suburbs


Source: Cushman & Wakefield, April 2026
Source: Cushman & Wakefield, April 2026
CONTACT US


director, head of
research & insights
Tom.Mccabe@cushwake.com
tom
mccabe


senior research
analyst
Alex.Trimble@cushwake.com
alex
trimble

director,
head of offices
Ronan.Corbett@cushwake.com
ronan
corbett

director,
offices
Aisling.Tannam@cushwake.com
aisling
tannam



HEATMAP of largest transactions
Relocations
and Stayers


Relocations
and Stayers
LARGE-SCALE
RELOCATIONS
LARGE-SCALE
RELOCATIONS


AVERAGE
DISTANCE
AVERAGE
DISTANCE


SUBURBAN
RELOCATIONS
SUBURBAN
Relocations


STANDALONE
EXPANSIONS
STANDALONE
EXPANSIONS


CLICK ON EACH BOX TO LEARN MORE
Relocations
and Stayers
LARGE-SCALE
RELOCATIONS
AVERAGE
DISTANCE
SUBURBAN
Relocations
STANDALONE
EXPANSIONS

2025 TRANSACTIONS OVER 10,000�SQ FT (930 SQ MT)
BY COUNT
EY's 5,100 square metres (54,670 square feet) deal for additional space at Wilton Plaza
Comprising all occupiers that have relocated their office from outside Dublin CBD or are a new occupier in the CBD market
An occupier moving office within the same Dublin CBD submarket as the previous office
An occupier moving�office into a new Dublin�CBD submarket
Comprises all flexible workspace providers who have taken a traditional lease or signed a management agreement�in Dublin CBD