HEADLINES
OVERVIEW
NEW ENTRANTS
MARKET MOVERS
THE NET EFFECT
THE SPILLOVER�IMPACT
ACCELERATION�OF AI DEMAND
LONDON�MOVES
The who, what, where and why of office relocations across the UK capital.
Established companies
comprises all occupiers that already have an office�in Central London
MOVER
An occupier who has moved offices within Central London
STAYER
an office move within the same Central London submarket as�the previous office
RELOCATOR
an office move into a new Central London submarket
an office expansion, either within the�existing office location or a secondary/�tertiary location in Central London
EXPANSION
comprises all occupiers that have relocated their office from outside Central London or are a new occupier
NEW�ENTRANTS
comprises all education & medical occupiers who have taken office space in Central London - not included in the relocations data
EDUCATION & MEDICAL
comprises all flexible workspace providers who have taken a traditional lease or signed a management agreement in Central London - not included in the relocations data
FLEXIBLE WORKSPACE
CONTACT US

Heena�Gadhavi
Head of London Offices Research
heena.gadhavi@cushwake.com
Head of London Office Leasing
james.campbell@cushwake.com
James Campbell
Head of�UK Research
daryl.perry@cushwake.com
DARYL�PERRY
Head of London Office Capital Markets
chris.m.bennett@cushwake.com
Chris�Bennett
Head of Offices,�UK&I
alistair.brown@cushwake.com
Alistair Brown
Head of LONDON OCCUPIER REPRESENTATION
james.meikle@cushwake.com
JAMES�MEIKLE
Head of LONDON OFFICE CAPITAL MARKETS
martin.lay@cushwake.com
MARTIN�LAY
Head of lease�transactions & advisory UK
alistair.brown@cushwake.com
ALISTAIR�BROWN


100k+�deals�on the up
East London surge drove�deal growth
City relocations dominated; East London grew
City businesses stayed put; West End favored relocation
West End to City migration CONTINUED�
CITY INTERNAL�MOVES HIGHEST
Lowest�relocation distance on record
88% OF�100K SQ FT DEALS EXPANDED
Strong new entrant demand�
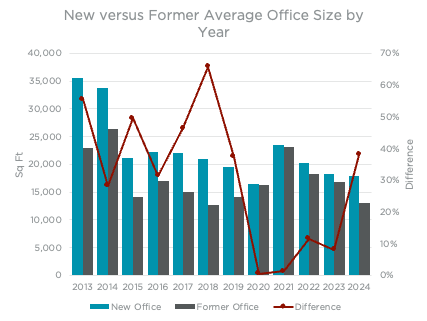
Net office expansion reaches six-year high
38% AVERAGE INCREASE IN FLOORSPACE
70-82% EST RISE IN 2026 RATES LIABILITY VS FORMER OFFICE
EXPECTED �TENANT�MODEL

HOVER ON EACH BOX TO LEARN MORE


This was 5% below the 2024 count but remained in line with the 10-year average. There were 26 transactions signed by Flexible Workspace operators, equating to 610,000 sq ft – identical to the prior year in terms of count and 3% higher on the quantum of space leased. Despite deals numbers for Education & Medical occupiers reducing from 20 in 2024 to 14 in 2025, the quantum of space increased by 27% year-on-year to 460,000 sq ft – the highest leased space on record.
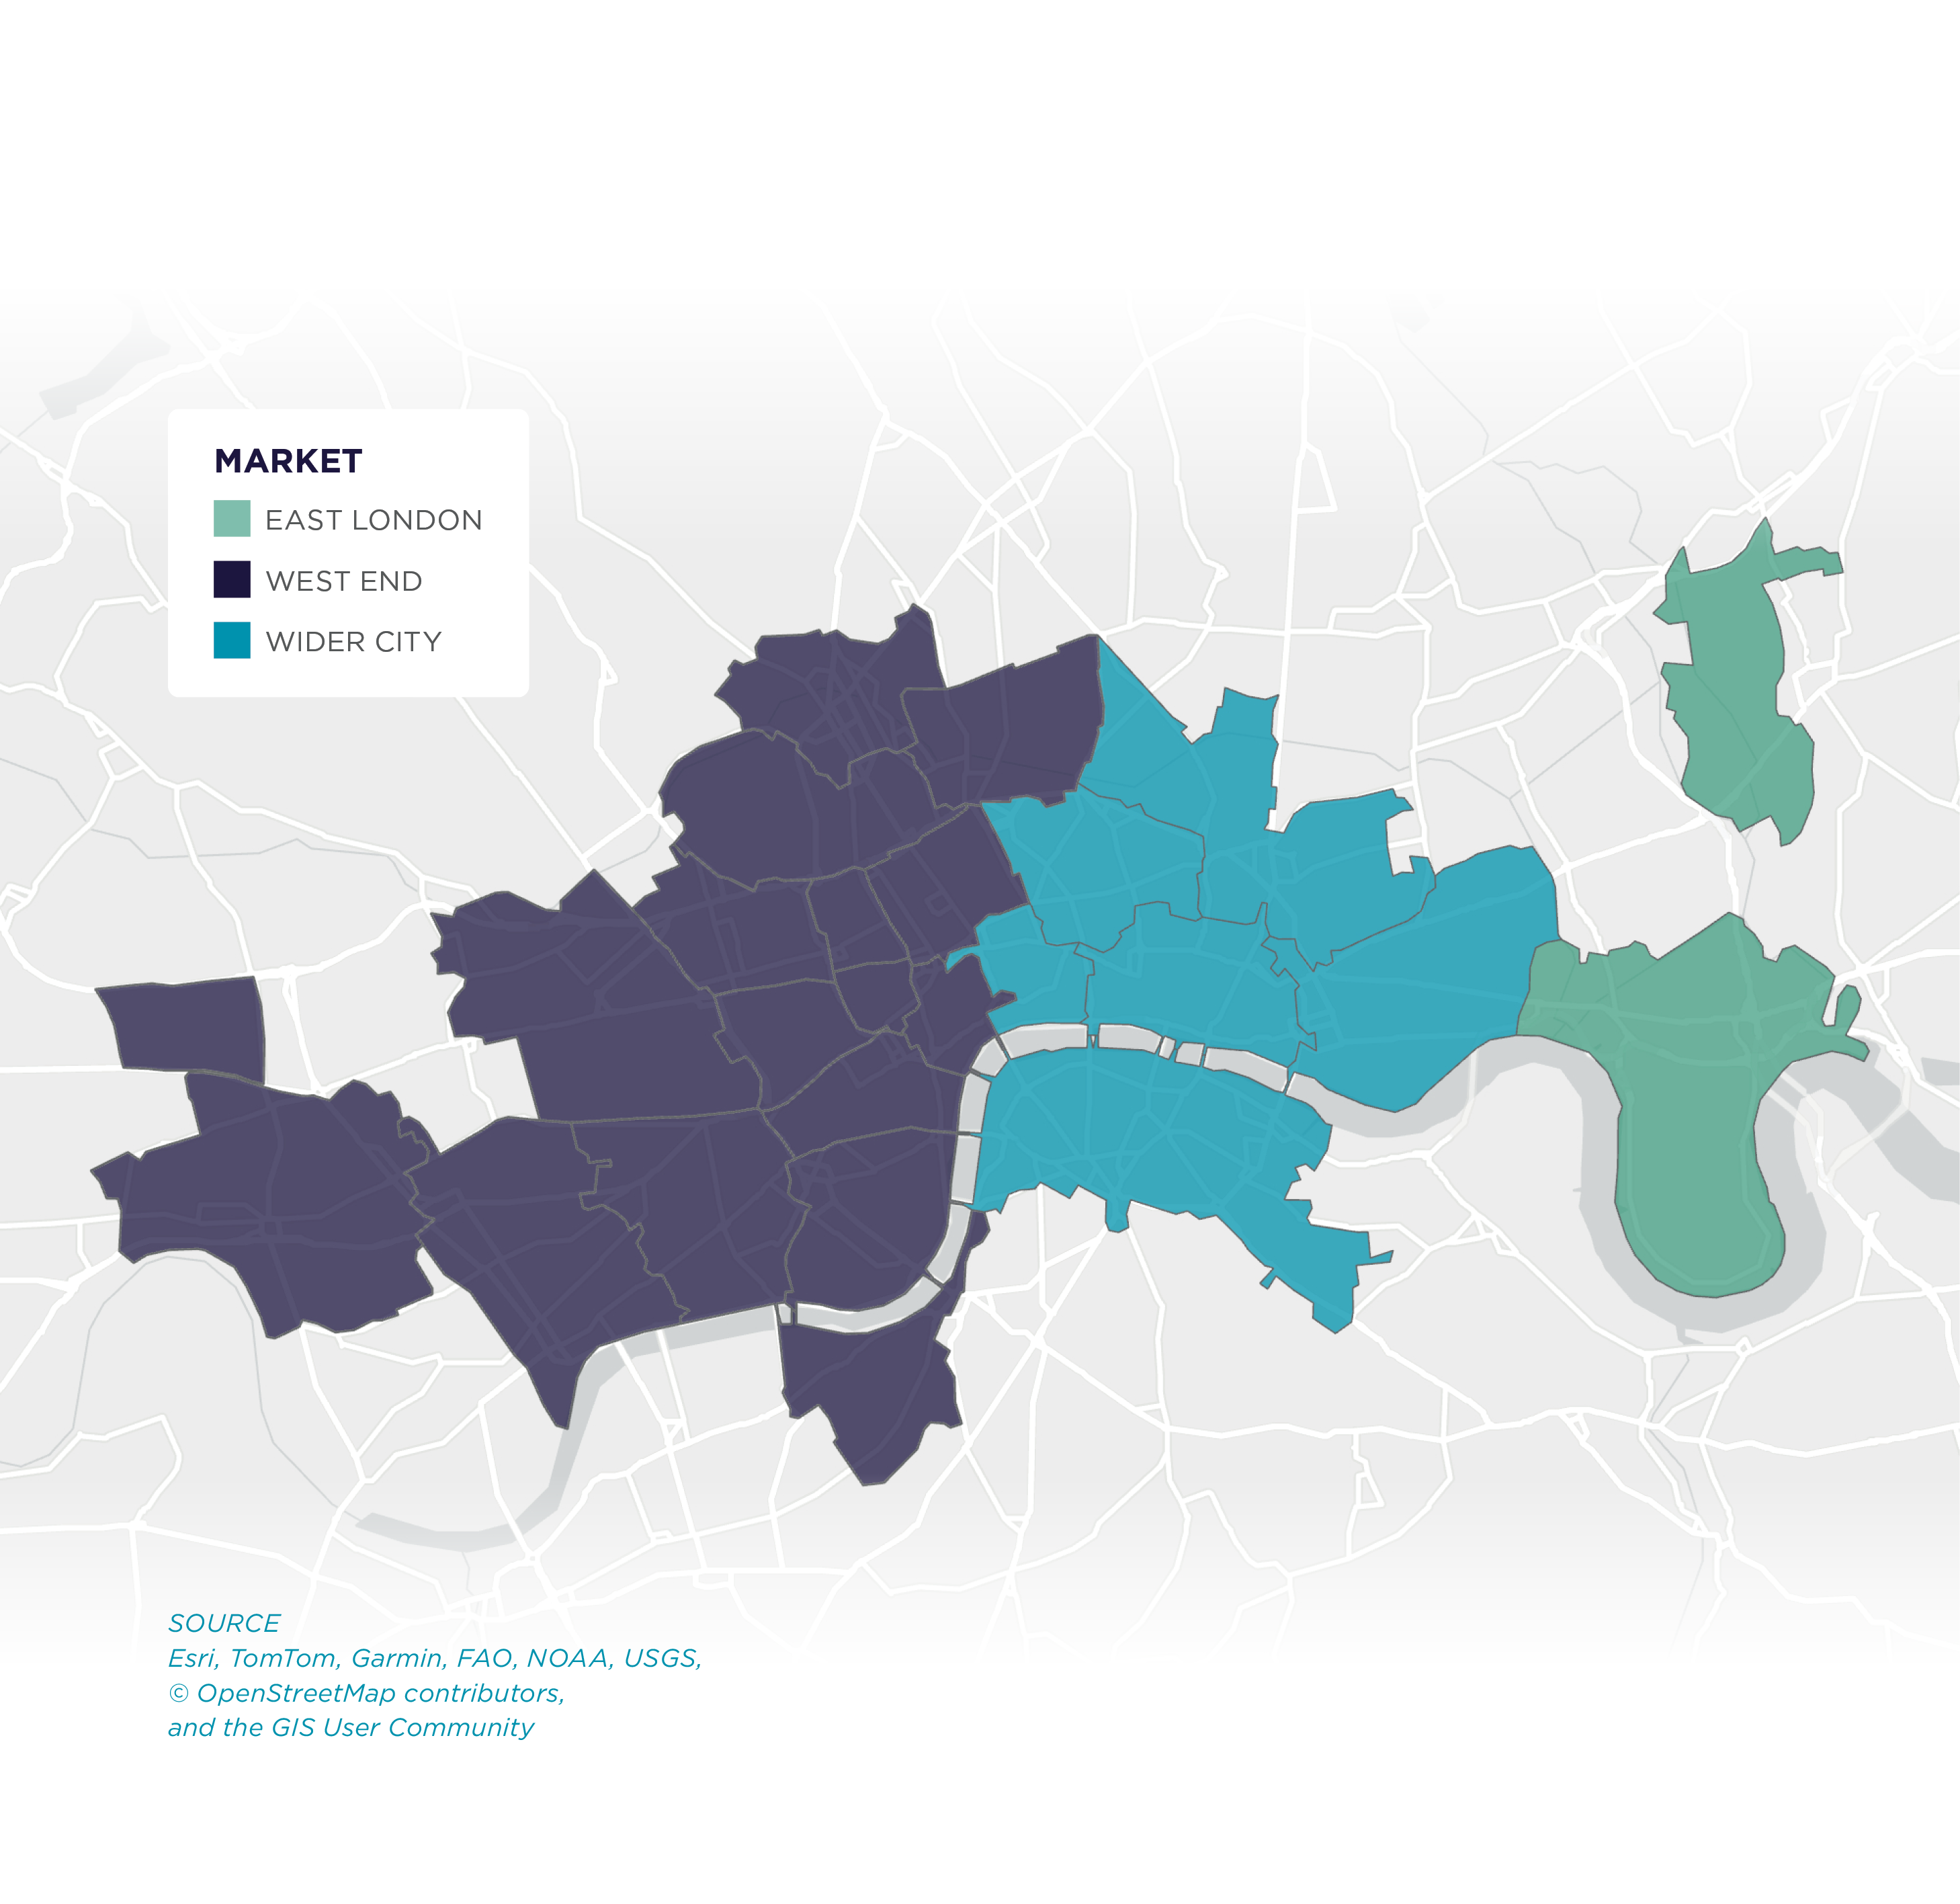
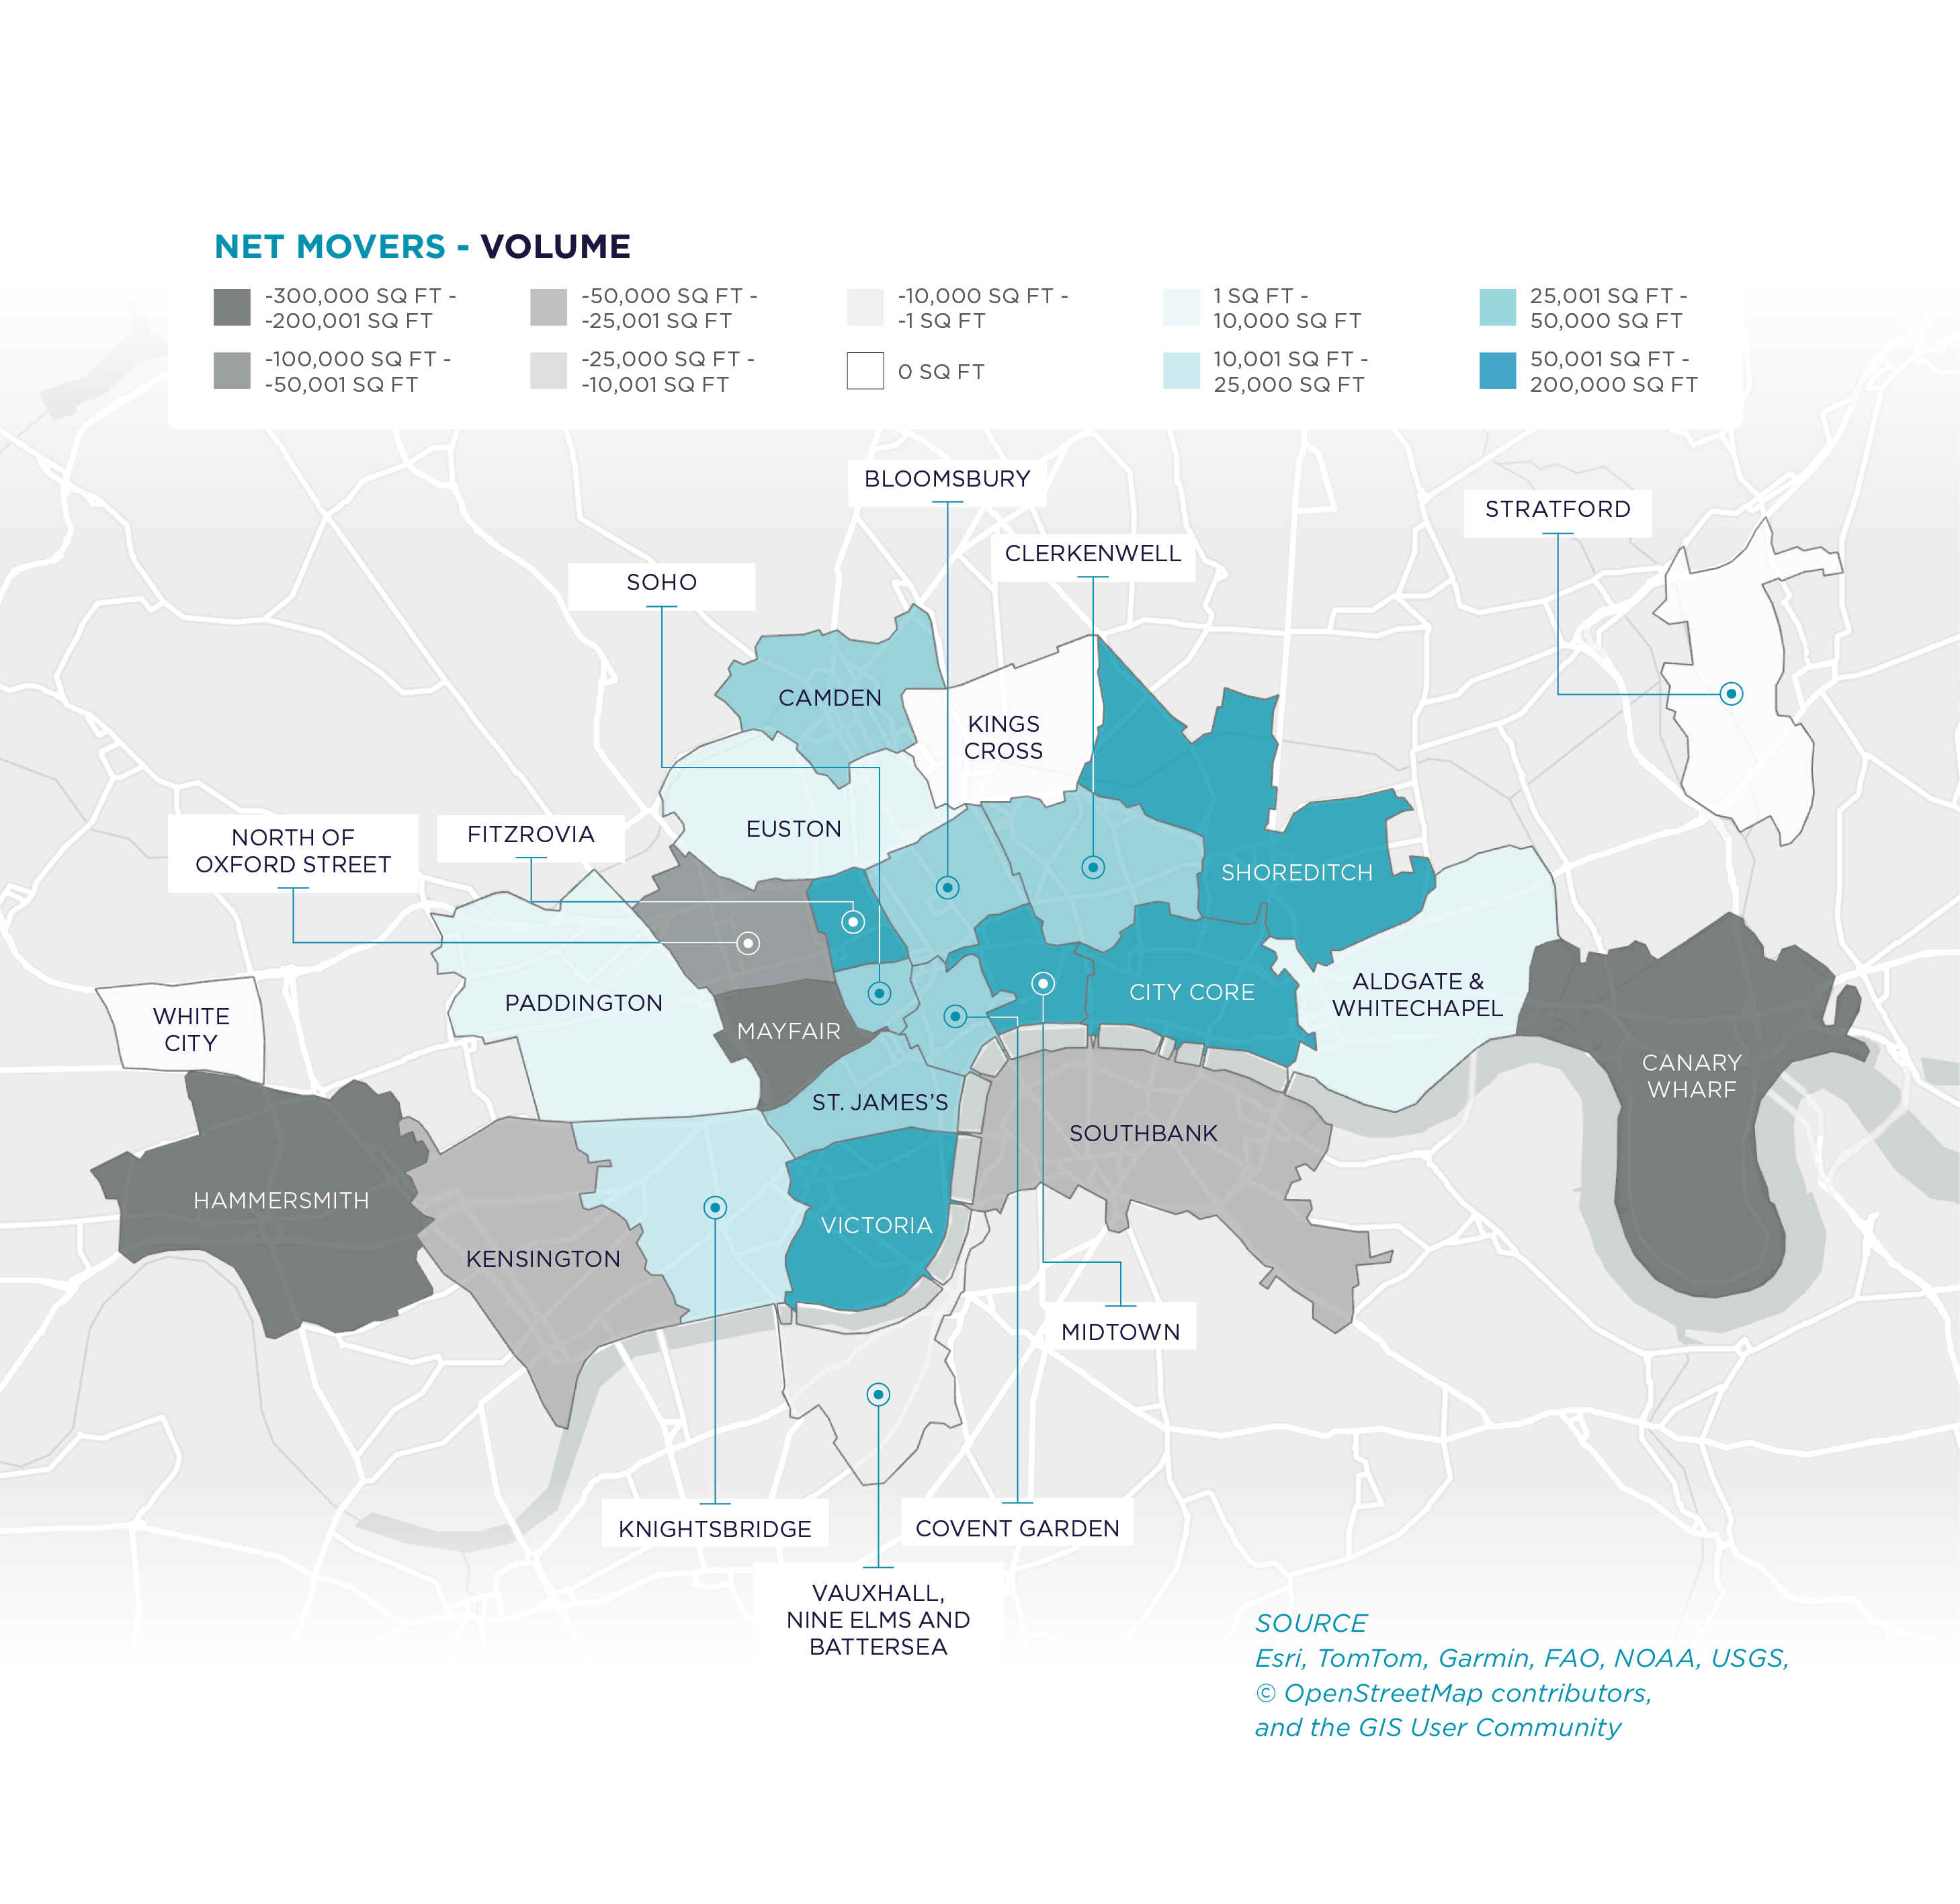
CENTRAL LONDON MARKETS
MAP SAMPLE FOR PLACEMENT ONLY
The West End overtook the Wider City market in attracting new entrants –�the first time since 2020 – with 25 deals totalling 231,000 sq ft.
This compares with 20 deals in the Wider City (174,000 sq ft) with 1 new occupier taking 9,500 sq ft in East London. The City Core continues to be the most sought after location for new market entrants, with 12 occupiers leasing space in 2025, equating to 97,000 sq ft, and 57 over the past five years (633,000 sq ft). Clerkenwell and Southbank follow, each attracting 22 occupiers since 2021 and equating to 304,000 sq ft and 204,000 sq ft respectively.
�Professional Services and Technology businesses continue to be the most active sectors for new entrants, with 16 and 14 occupiers leasing space in Central London, respectively, and both surpassing the 10-year average. While the Technology sector came in second, they are ahead in terms of the 5- and 10-year average number of new entrants, a trend that is expected to continue as AI businesses in particular, continue to be active in leasing space. All the other sectors saw the 2025 number of new entrants fall behind their respective�5 and 10-year averages. �
London continues to attract new occupiers and 2025 was no different, with 46 new entrants across Central London, made up of both new occupiers and those who have relocated from outside of Central London into the market.
This was ahead of the 43 recorded in 2024 and one more than the 10-year average. This equated to 415,000 sq ft of take-up – a 27% year-on-year reduction, despite being ahead by 3 occupiers. A large reason for this is due to the average deal�size falling to 9,018 sq ft, falling by 32% year on year and�by 27% on the 10-year average deal size of 12,385 sq ft.
Of the 46 new entrants, 27 were new businesses taking their first office space in Central London, equating to 255,000 sq ft – both the number and quantum of space increasing by 50% and 25% respectively on 2024. The 19 new entrants who relocated from outside of Central London leased 160,000 sq ft – both�at their lowest levels since 2020.
Throughout 2025, there were�296 occupiers who moved offices�in Central London.
Although this was a 3% reduction on the prior year, it was 4% ahead of the 10-year average. This equated to 6.21 million sq ft, accounting for 62% of total take-up for the year. Of the movers, 155 occupiers relocated into a new submarket (relocator), and the remaining 141 remained within their existing submarket (stayer).
Central London continues to be an expansionary market for occupiers,�with net expansion of 3.82 million sq ft recorded for movers and businesses taking additional space in 2025. This was up by 16% on 2024 and is the highest net expansion figure recorded since 2019.

ABOUT CUSHMAN & WAKEFIELD
Cushman & Wakefield (NYSE: CWK) is a leading global commercial real estate services firm for occupiers and investors with approximately 53,000 employees in over 350 offices and nearly 60 countries. In 2025, the firm reported revenue of $10.3 billion across its core service lines of Services, Leasing, Capital markets, and Valuation and other. Built around the belief that Better never settles, the firm receives numerous industry and business accolades for its award-winning culture.
For additional information, visit www.cushmanwakefield.com.


Across Central London, there were 504 lease transactions reported in 2025, equating to 9.6 million sq ft.


NEW�ENTRANTS
OVERVIEW
HEADLINES

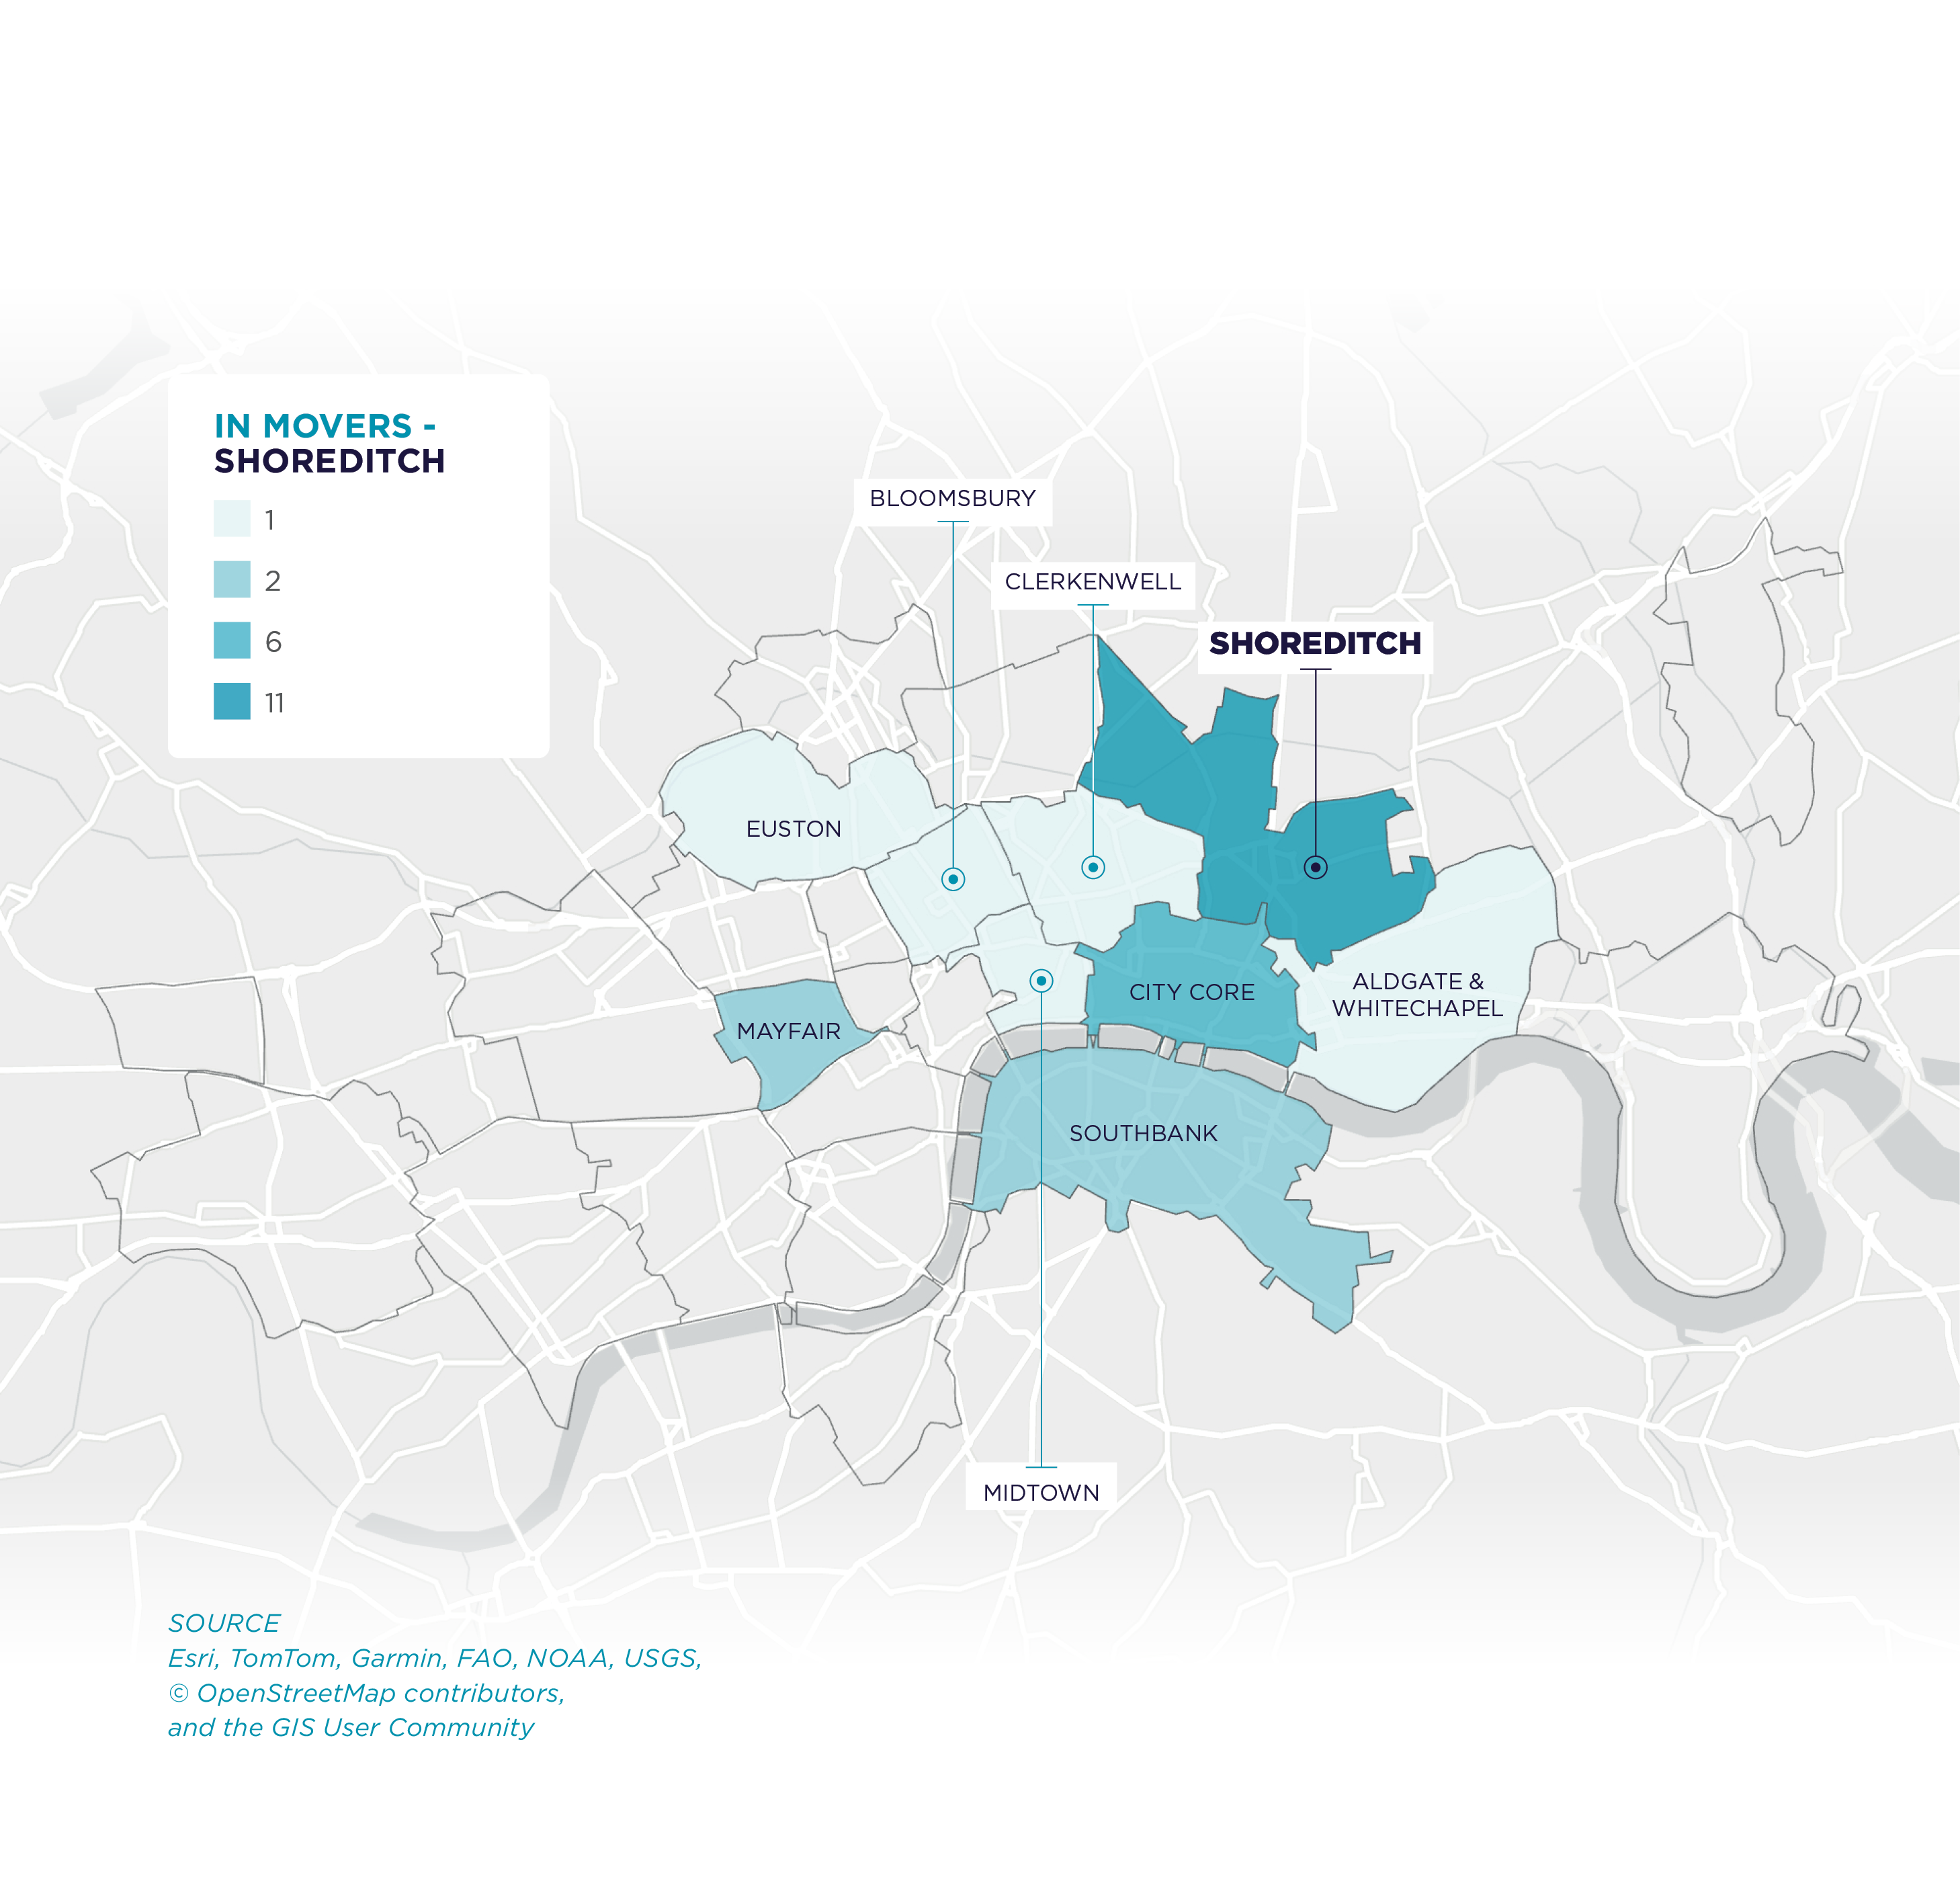
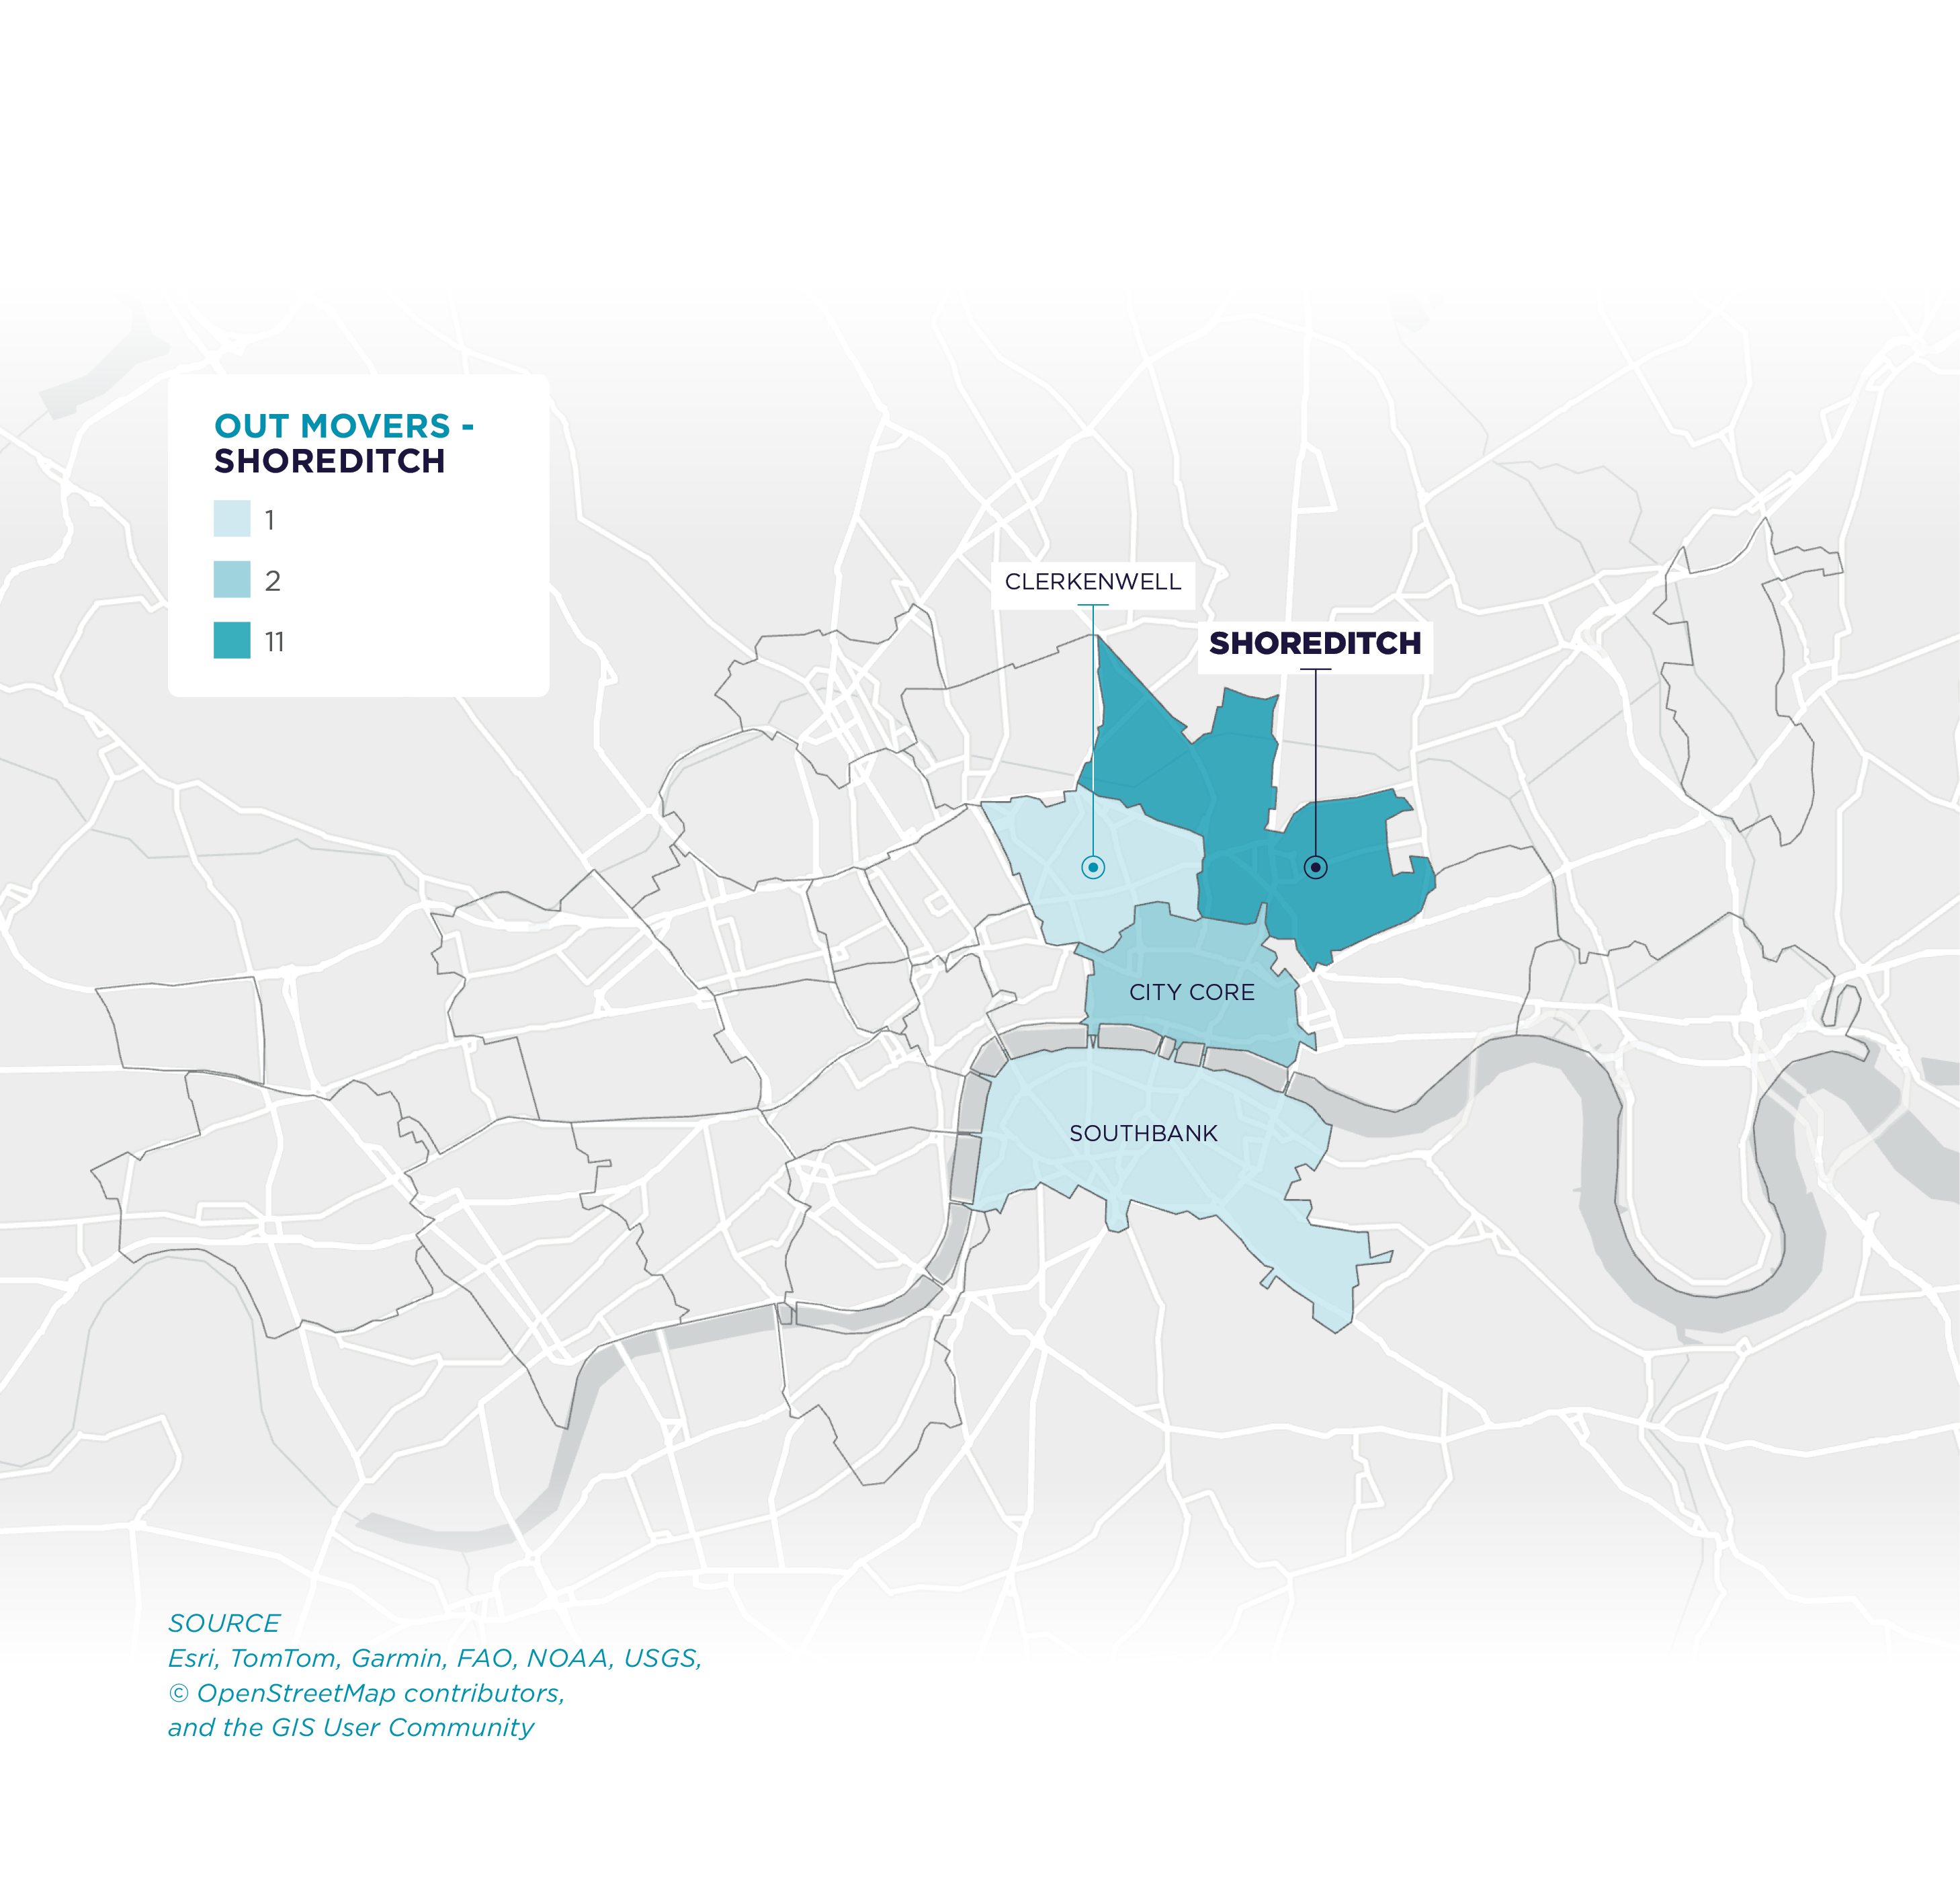
WHERE ARE THEY MOVING?
MARKET MOVERS
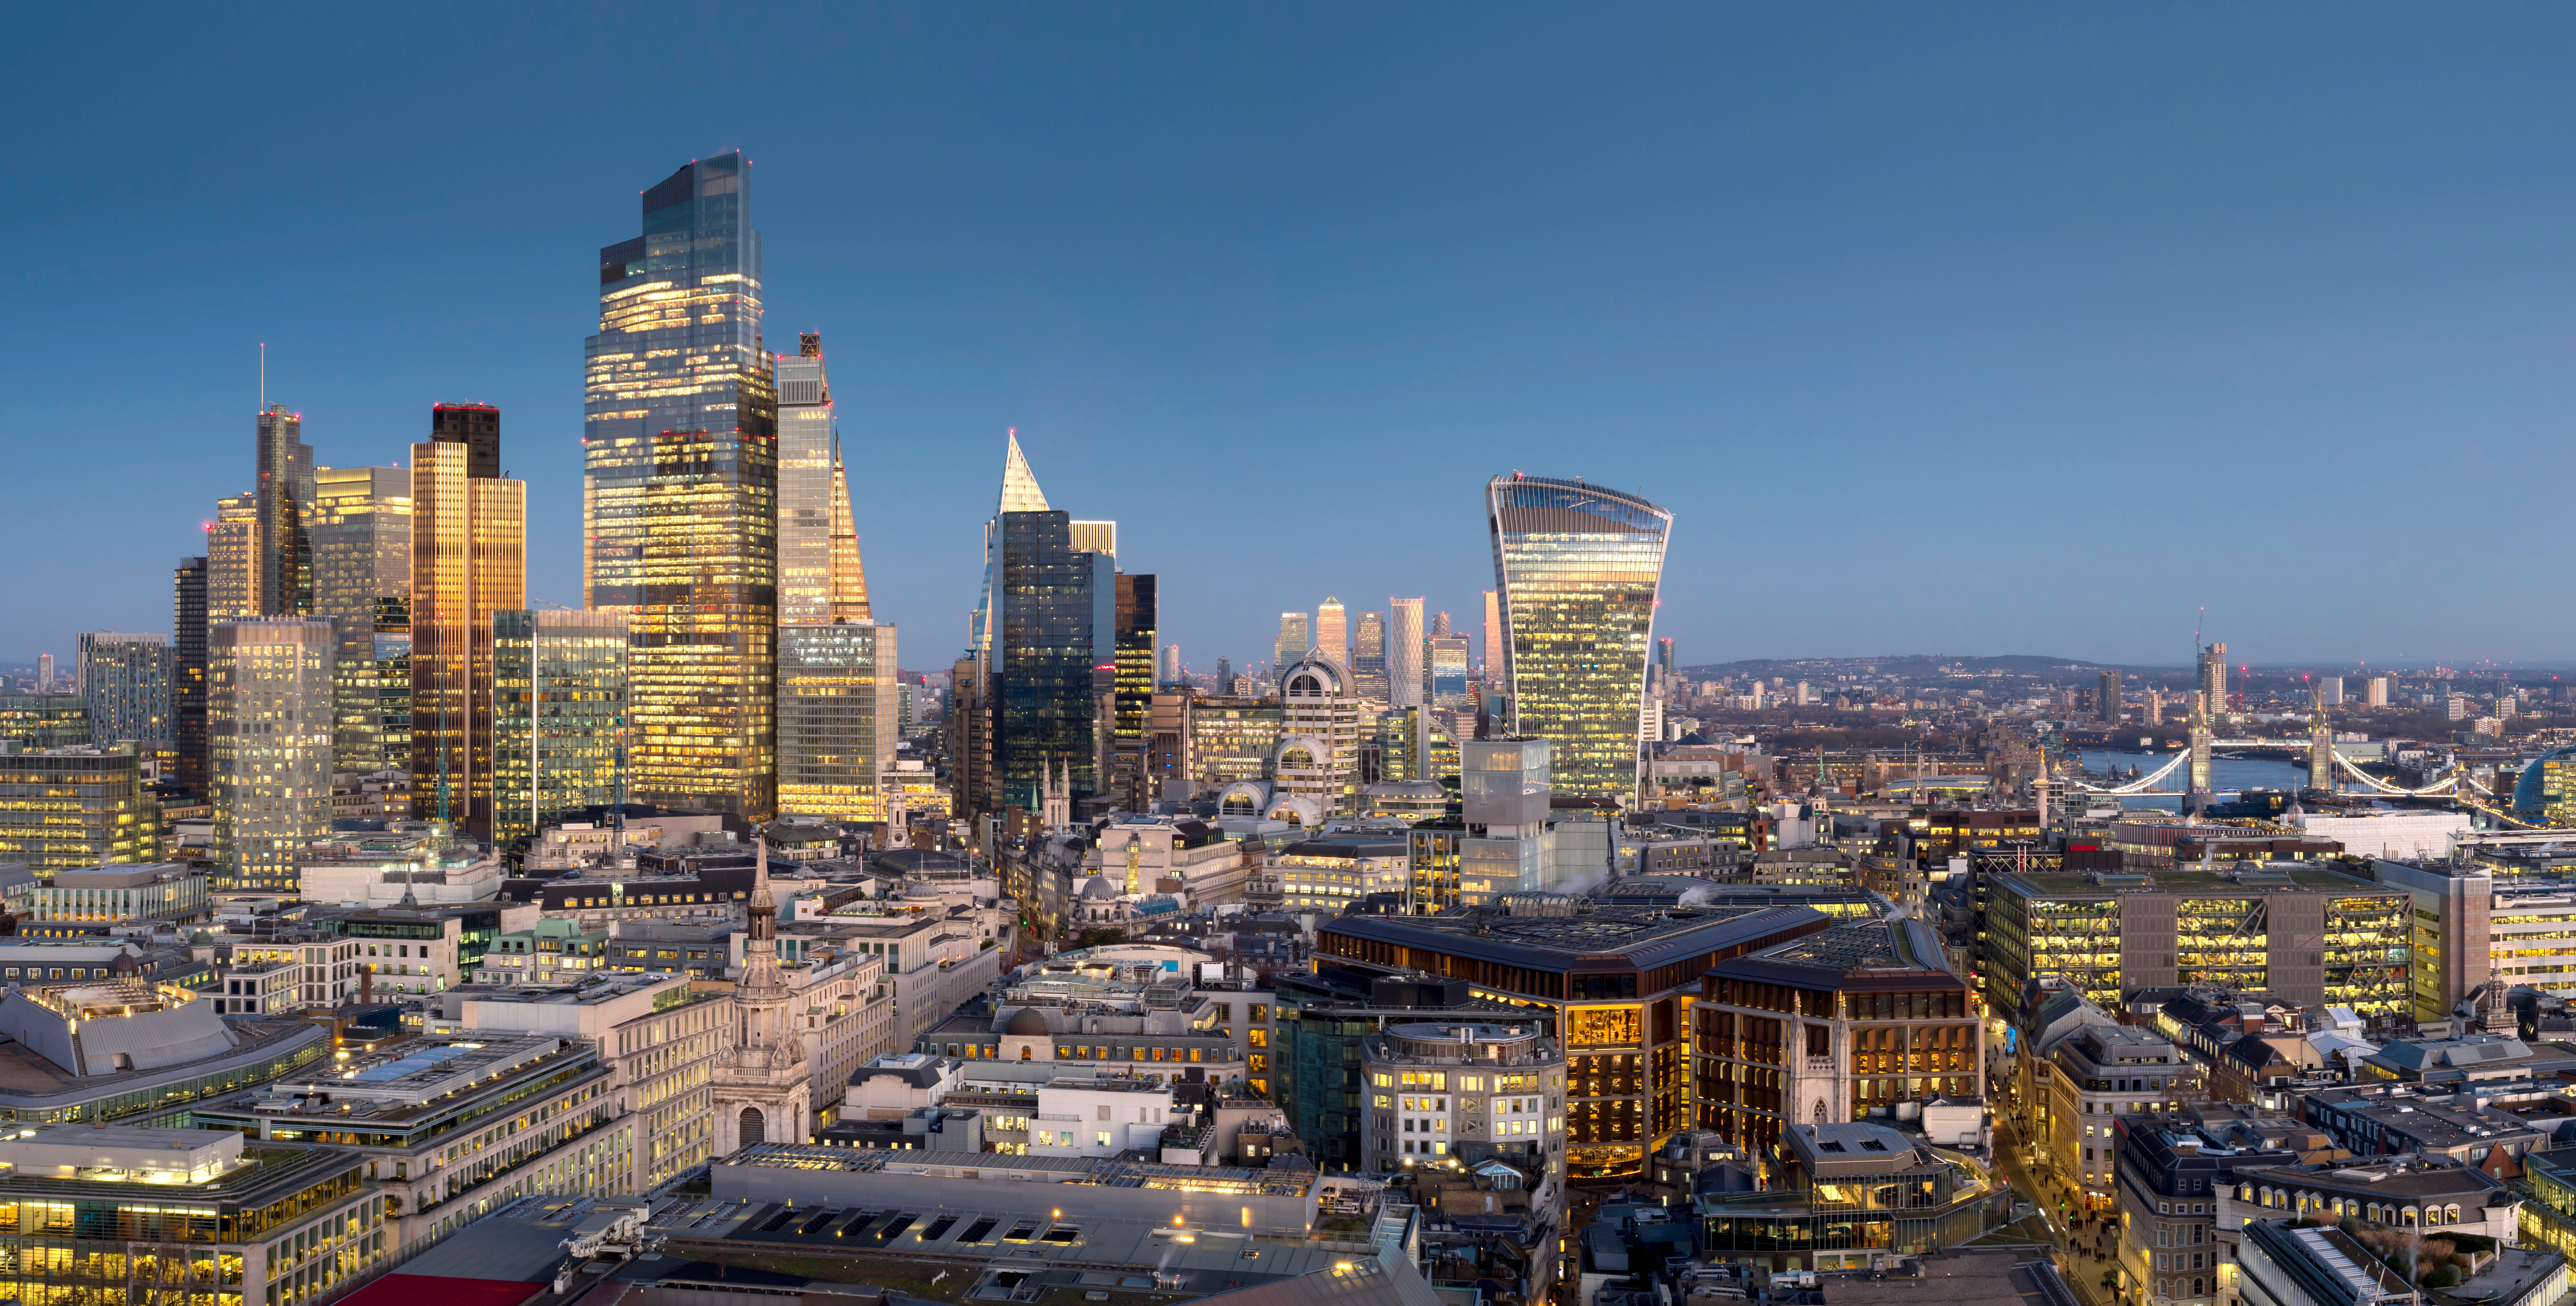
A total of 110 moves were recorded in the City Core in 2025,�of which 79 occupiers were stayers. Although a reduction�on 2024, this was ahead of the 10-year average of 94 movers recorded for this submarket.
�Having seen a relative slowdown in total movers in recent years, movers into Southbank rebounded with 29 recorded�for 2025 – the highest on record. Of this, 20 occupiers relocated from another submarket – also a record – while 9 remained within the submarket, broadly aligned to prior years. New development has historically driven leasing activity in Southbank, and 2025 was no exception with Lego and PayPal pre-letting at 76 Upper Ground, relocating from Midtown and City Core respectively, and ServiceNow pre-letting at EDGE London Bridge, another Midtown relocation.�
For the first time since London Moves began in 2013, the top 5 submarkets�for movers were all in the Wider�City, with the City Core once�again leading the way.
Constrained grade A supply across some West End submarkets is one of the main reasons why overall movers reduced in 2025; however, there were some exceptions.
Movers into North of Oxford Street (14), Covent Garden (14) and King’s Cross (9) increased year-on-year, from 8,�8 and 0 respectively. In North of Oxford Street, four pre-lets across four different developments led to not only the increase in the number of movers, but also the quantum of spaced they leased, by 18% to 351,000 sq ft. This was also the largest volume of leased spaced by movers across all of the West End submarkets, followed by Mayfair where the 6 movers recorded leased�274,000 sq ft.
Activity in Mayfair and St James’s continued to be hindered by the availability of grade A space, with just 10 combined movers recorded in 2025 – the lowest number since 2014. Of those that did move, just one came�from the City Core – McDermott Will Emery who pre-let the entirety of 7 Brook Street.
All these occupiers relocated from within the West End, equating to just under 80,000 sq ft with technology businesses leading the way.
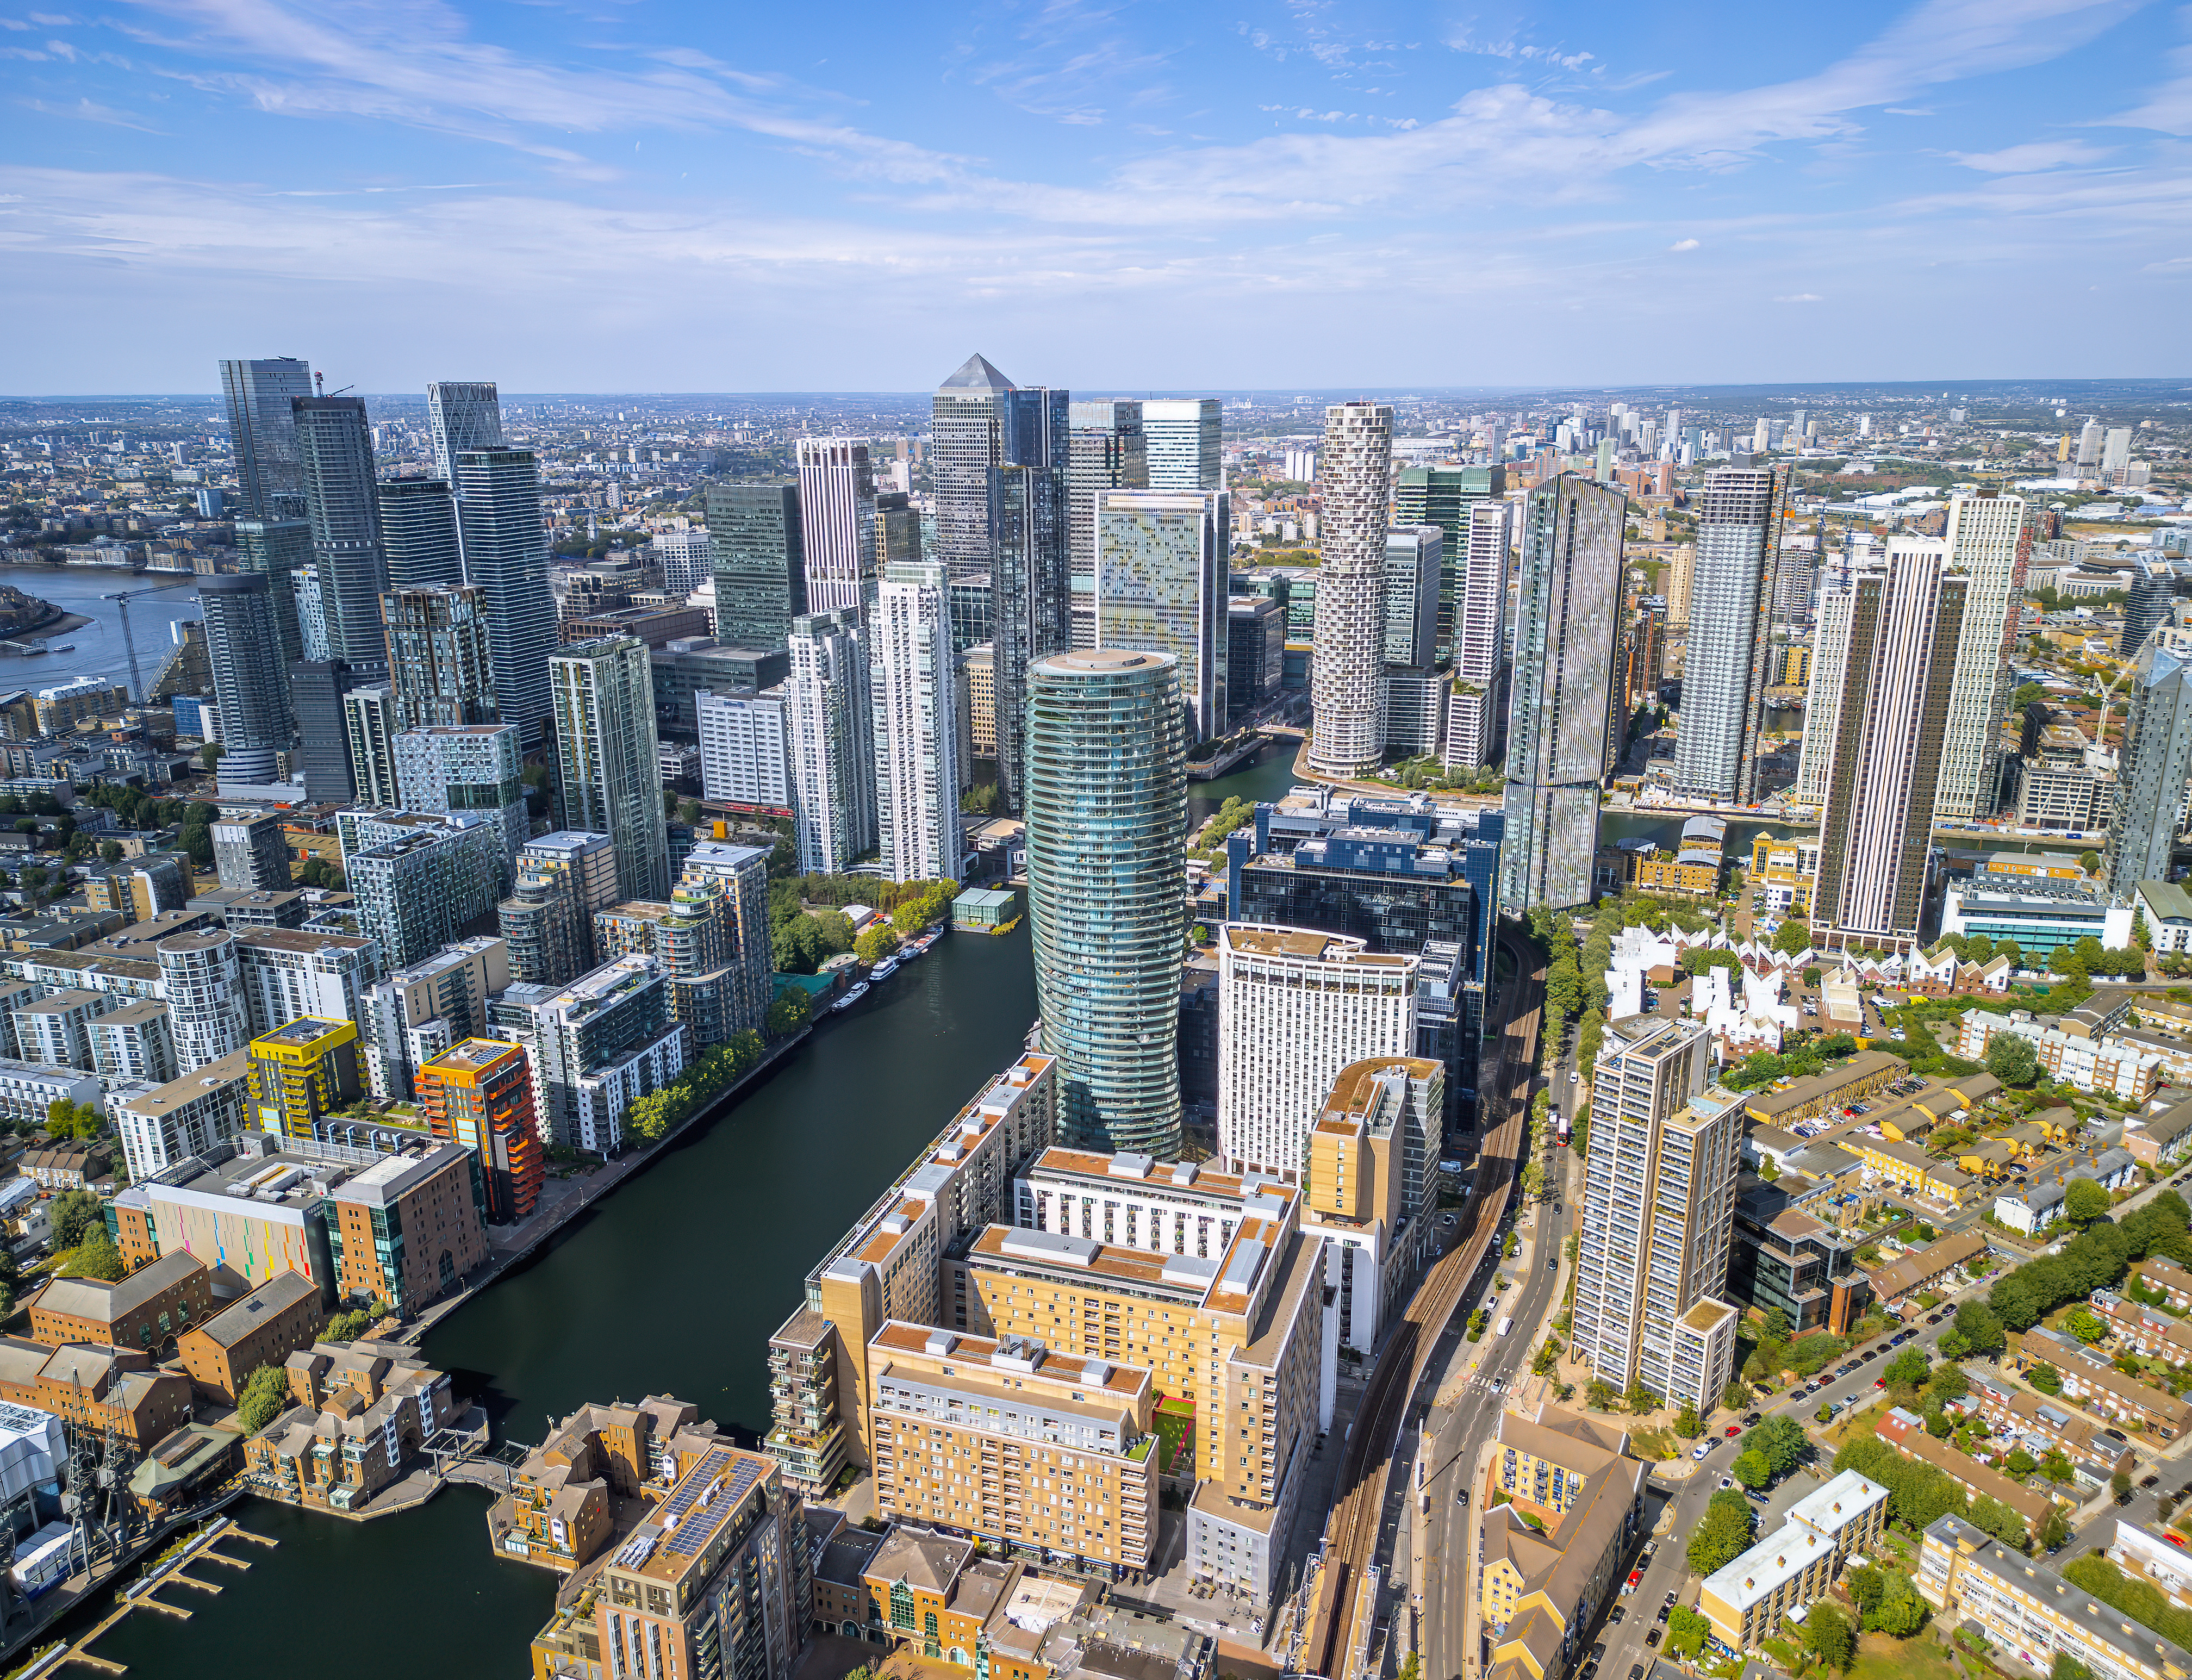
In East London, 6 movers were recorded, all of which were to Canary Wharf – 3 were stayers and 3 relocated. The largest was Visa’s relocation from Paddington to 1 Canada Square – also the second largest deal for|�Central London and second largest distance moved�by an occupier in 2025.
King’s Cross has historical seen limited activity, with an average of 3 movers a year recorded between 2013 and 2024, however that changed in 2025 with 9 occupiers relocating into the area –�a record high.
HOW FAR ARE THEY MOVING?
MARKET MOVERS
Having declined year-on-year over the past five years, the “Loyalty to Local” theme of last year’s report has been reinforced in the 2025 data, with the proportion of movers relocating less than 0.5 miles increasing from 48% to 62%�in the past five years, while the proportion for those that moved more than 1 mile reduced from 30% in 2021�to just 19% in 2025 as occupiers continue to remain�loyal to the locations they are comfortable in.
Movers into East London have travelled the furthest distance of 1.58 mile, against a 5-year average for the market of 1.30 miles. For the West End, and average distance of 0.66 miles was recorded and 0.62 miles for the Wider City, down by 25% and 16% on their respective 5-year averages.
The average distance moved by those relocating in 2025 reduced by 10% to 0.65 miles across Central London – the lowest on record.

WHO IS MOVING?
MARKET MOVERS
A large proportion of the movers in this sector moved into the Wider City market (63), the second highest total recorded and behind the 64 movers recorded in 2023. Within this sector group, 42% of occupiers were stayers, aligned with the stayer average of the last 10 years.
�FTI was the largest mover of 2025 for this sector, pre-letting 103,000 sq ft at 1 Exchange Square in the City Core, a move that will see them exit 98,000 sq ft in another City Core building upon completion. Another significant West to East move was Knight Frank, who will exit the North of Oxford Street for 72,000 sq ft at 1 Liverpool Steet in the City Core. �
The Professional Services sector remained the most active in 2025, with 85 moves recorded throughout the year totalling 1.36 million sq ft. This was just two movers shy of 2024, but ahead of the 81 and 67 average movers over the last 5 and 10 years, respectively.
PROFESSIONAL SERVICES – LARGEST MOVES
There were four relocations over 100,000 sq ft in this sector group, including the largest leasing transaction�of the year, Squarepoint’s 404,000 sq ft pre-let at 65 Gresham Street in the City Core, a relocation from approximately 100,000 sq ft at 1 Ropemaker, also in the City Core. Visa’s commitment to 300,000 sq ft followed, a relocation that will take them from Paddington to Canary Wharf and expand by 100,000 sq ft. State Street’s pre-let of 100 New Bridge Street in the City depicted a significant contraction of space, downsizing from 350,000 sq ft to 195,000 sq ft, however this reflects leased space and actual occupied space is believed to have been lower; and finally Ares committed to 128,000 sq ft in Mayfair, future expansion space�when the business moves in in 2028.
Banking & Finance occupiers were also active in 2025, with 84 recorded movers totalling 2.55 million sq ft – this was the highest number of movers since 2019. Continuing on from 2024, there were more movers into the Wider City for this sector (47) than in the West End (34), with the remaining 3 taking place in Canary Wharf.
The shortage of office space, particularly around Elizabeth Line and mainline train stations (with 3+ connections), is expected to intensify over the next five years with the development pipeline getting more and more constrained.

The drivers of this centre around not only the cost of relocating and fitting out office space – which according to our latest UK Fitout Cost Guide is averaging £243 per sq ft in London but in reality could be much higher – but also because of the undersupply of grade A office space around mainline stations, the options of which�are depleting at a fast rate, in large due to the cost�of construction and rents required in order to make a scheme viable. As such, the stay put option has been favoured by some occupiers, who are essentially pushing their requirement further down the line in the hope�that the marketplace for relocating will improve.
Of the 3.65 million sq ft of transactions conducted by Cushman & Wakefield’s Tenant Representation Team in 2024 and 2025, 42% were lease renewals or regears (not included in the London Moves dataset), up from the 28% recorded in 2022 and 2023 combined. While the quantum of space for renewals and regears increased, the deal count reduced by 30%.
Staying put has been a key option for many occupiers during 2024 and 2025, with renewals and regears rising during this period.
This means that despite elevated renewals and regears, a large volume of occupiers continue to relocate, evident in the market movers count of 296 deals in 2025 being in line with the 5-year average of 298 deals and ahead of the 10-year average of 285 deals.
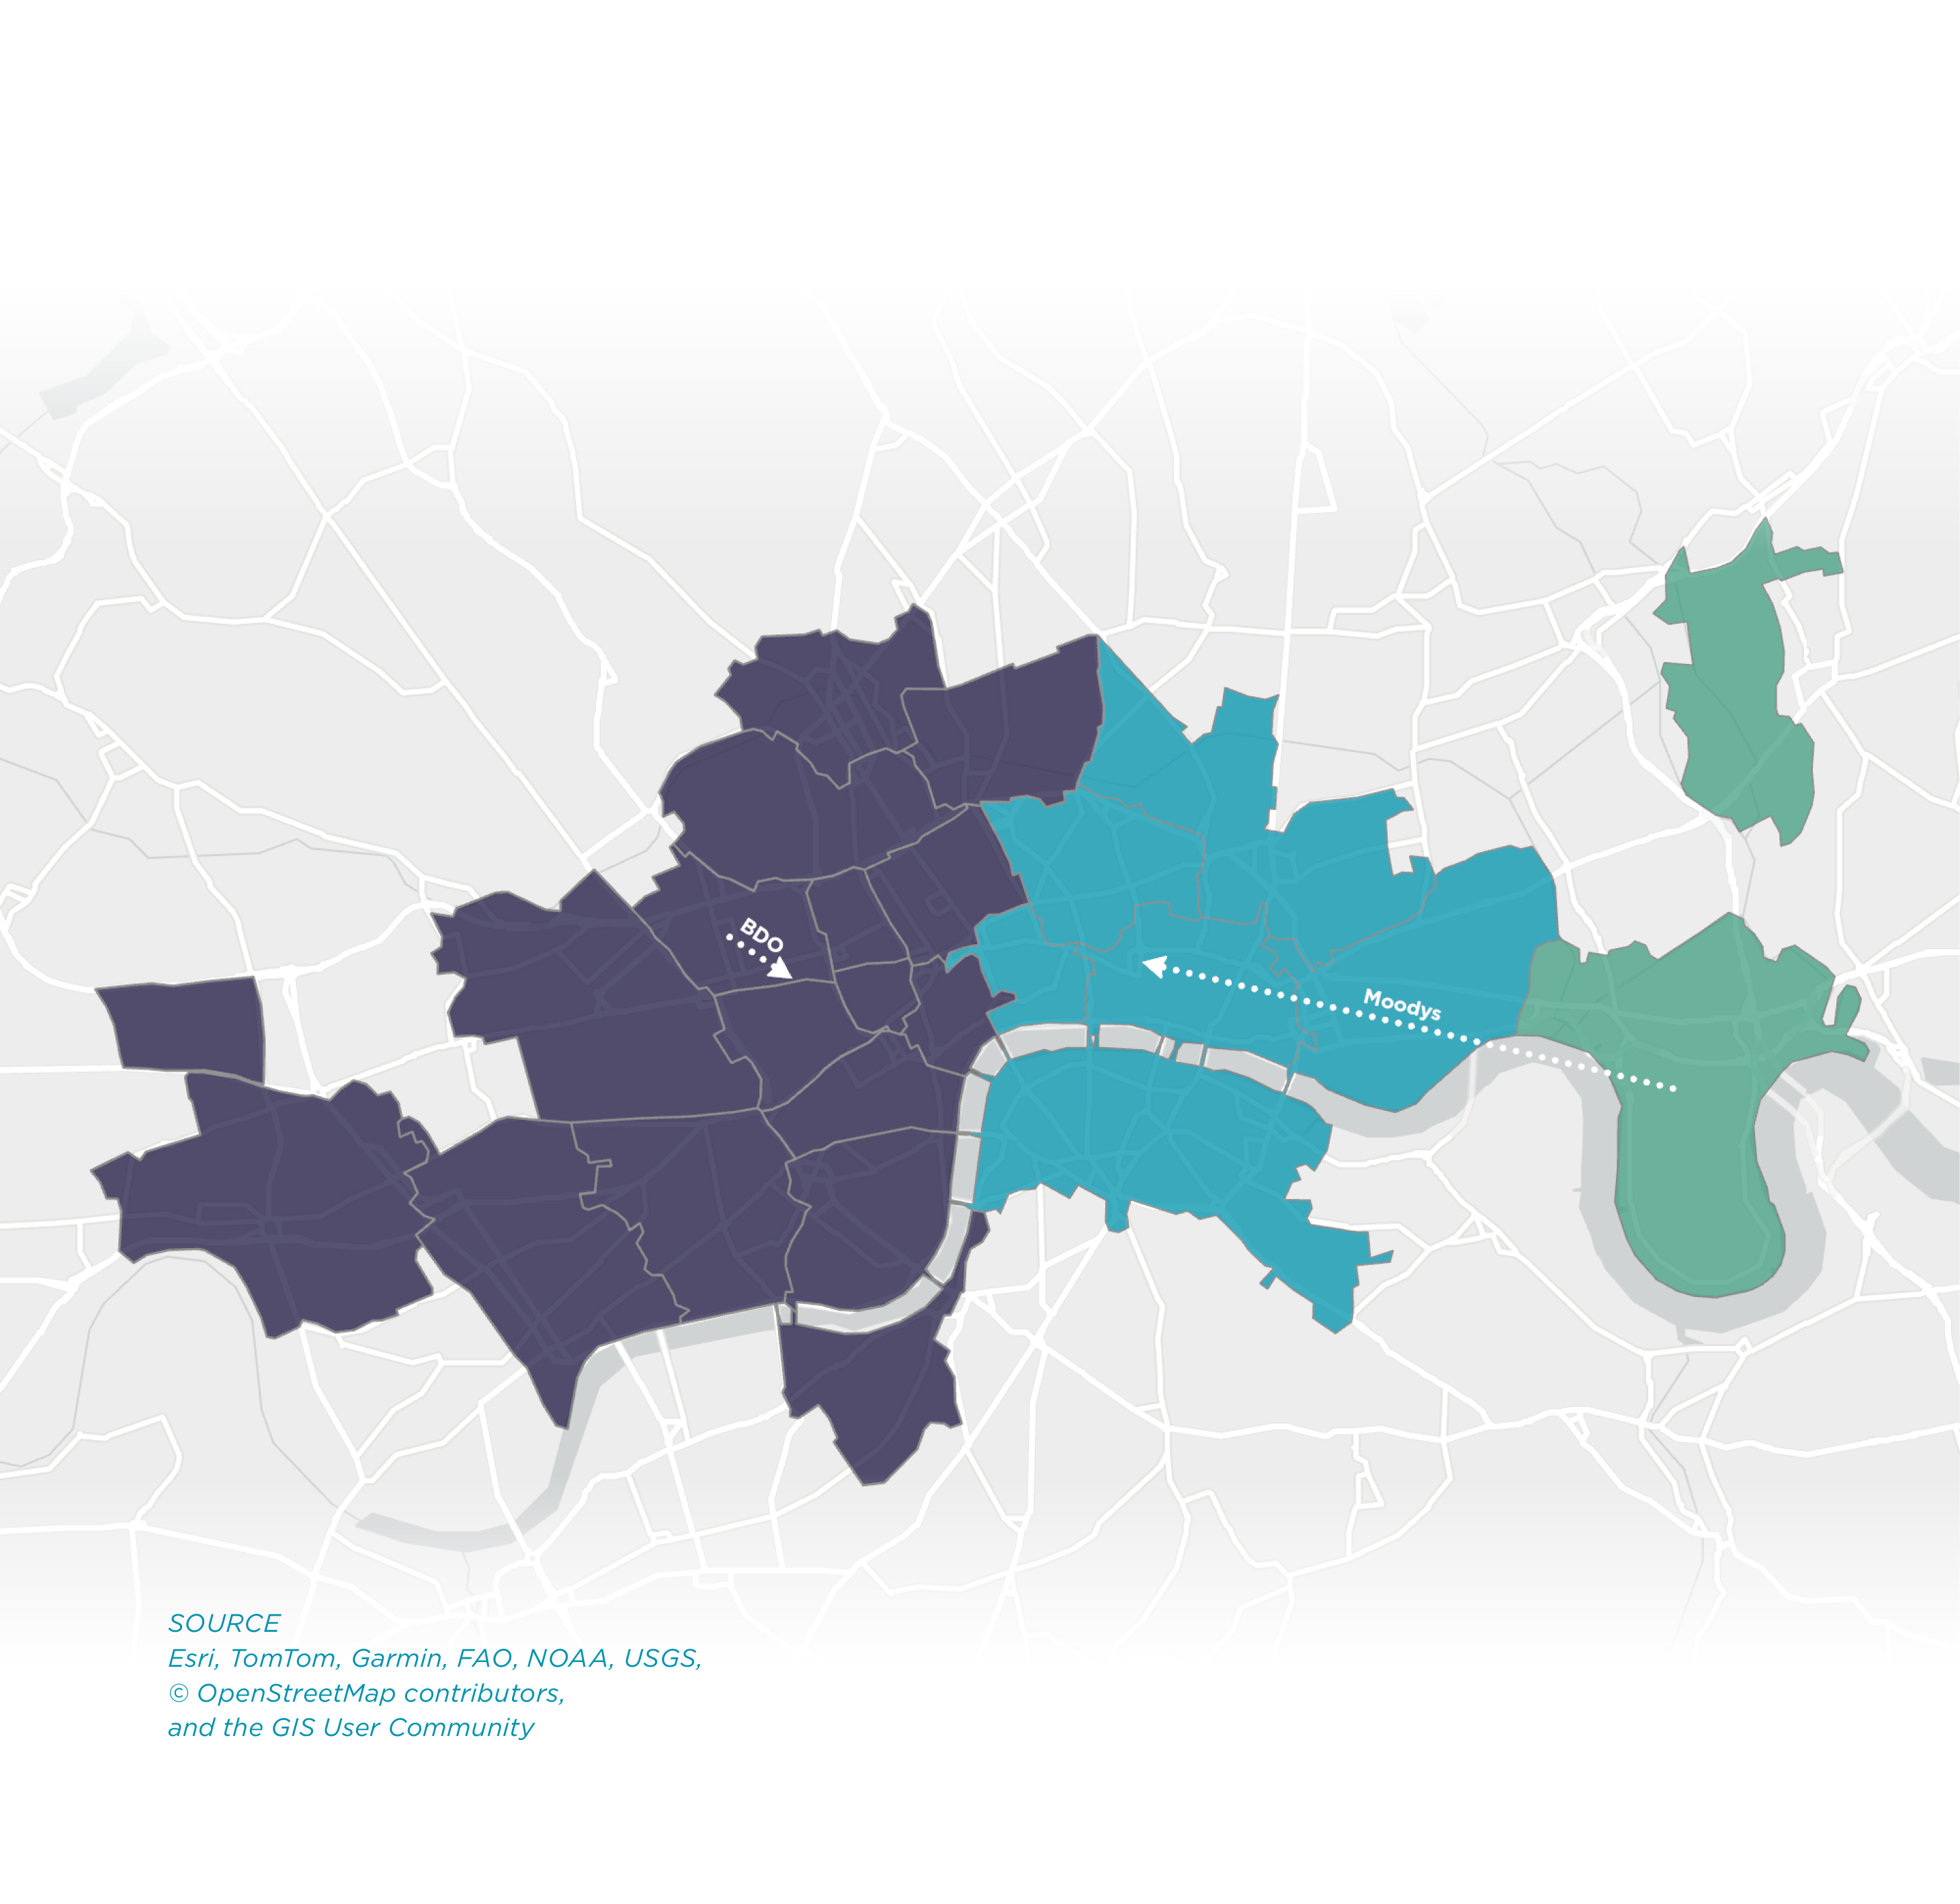
With supply centred around key transport nodes depleting, occupiers who do not renew or regear are faced with having to look in alternative locations for grade A space – the spillover impact. The key Elizabeth Line submarkets of Mayfair, Canary Wharf, City Core and King’s Cross are all among the locations with the lowest grade A vacancy rates, as at Q4 2025, and this has seen other adjacent benefit indirectly from Elizabeth line connectivity.
Southbank is the clear spillover winner benefiting from undersupply of core grade A space in the City Core, with movers increasing from just 18 in 2024 to 29 in 2025, as well as elevated movers in 2014, 2015 and 2016 when City Core grade A vacancy rates were at similar levels to Q4 2025. The market is also benefitting from some West End overspill, given its transport connections, with 7 in-moves in 2025, up from just 3 in 2024. However, grade A supply needs to be available, and in prior years this has not been the case and has resulted in few relocations. Midtown has also seen a consistent number of movers, despite contending with its own grade A supply constraints.
��
Historically, Fitzrovia has been a prime spillover submarket, although in recent years, it has seen a more steady flow of movers, which continued in 2025.
�The desirability of Canary Wharf as an office and retail destination saw activity surge over the past four years, and remains centred around the Elizabeth line station. However, the low grade A vacancy rate of 3.75% at the end of 2025 has seen occupiers targeting other destinations along the entire route, which as mentioned above is scarce. This is expected to intensify as future supply over the next five years remains low with no developments currently under construction and around 760,000 sq ft expected to come through should construction begin within the next�12 months.
In the West End, the undersupply across Mayfair and St James’s has resulted in activity increasing in nearby, and also constrained, submarkets such as Marylebone/North of Oxford Street, which saw movers increase from 8 in 2024 to 14 in 2025.
WHERE ARE�THEY MOVING?
HOW FAR ARE THEY MOVING?
WHO IS MOVING?
THE�EXPANDERS
THE�CONTRACTORS
A rebound in activity in East London drove deal number during the year, rising from 9 in 2024 to 27 in 2025, equating to over 1.1 million sq ft – the highest take-up recorded in the post-pandemic era.
RECORD HIGH
The number of deals in 2025 (504) reduced by 5% year-on-year and by 3% against the 5-year average. Whilst the number of large deals, over 100,000 sq ft, increased from 8 in 2024 to 12 in 2025, the overall decrease was due to a reduction in deals below 50,000 sq ft. Total quantum of space was broadly consistent at 9.6 million sq ft in 2025 and across a 5-year period.
New market entrants remained robust, with 46 businesses taking space in 2025, ahead of the 43 recorded in 2024 but behind the 5-year average of 54. Of this, 27 were new businesses acquiring their first traditional office space, while the remaining 19 relocated from outside of Central London.
The loyalty factor to location continued, particularly in the City where 106 businesses stayed in the submarket of their former offices while 91 relocated elsewhere in Central London. In the West End, there were more relocators�than stayers (60 verses 33).
In 2025, 296 businesses relocated across Central London, a 3% year-on-year reduction but aligned with the 5-year average. Of these, 197 moved to the City market, 93 to the West End and 6 to East London, with the latter the only market to show a year-on-year increase.
West to East migration continued, with 32 businesses relocating from the West End to the City and 2 to East London. Meanwhile, just 10 left the City market�in favour of the West End – the lowest number since 2020.
The City market continued to see the highest number of internal moves (159), with 81 inter-West End moves recorded and 3 within East London.
Of the 390 established companies who signed leases in 2025, 312 occupiers expanded on their Central London footprint by 6.42 million sq ft – the highest quantum of space since 2019 – while 76 businesses reduced their space through relocation by 1.24 million sq ft. This resulted in an overall expansionary market of 5.18 million sq ft, the highest volume in six years.
The average distance moved by occupiers who relocated within Central London in 2025 was 0.65 miles, 10% below the prior year and the lowest distance on record. 183 occupiers moved less than 0.5 miles, while 55 relocated more than 1 mile from their former office. Occupiers in the Media sector were the most footloose during the year, while Insurance and Legal businesses continue to remain close for their former offices.
RECORD HIGH
RECORD HIGH
RECORD LOW


GET IN TOUCH

GET IN TOUCH


Credits: ADOBE STOCK


SCROLL�TO EXPLORE

The Government & Public Sector recorded the largest change, with just 0.41 miles travelled by those relocating, albeit this�was based off just four movers – the lowest on record.
The Banking & Finance and Professional Services sectors remain the most active for Central London take-up, taking a combined market share of 56% in 2025 by quantum of spaced leased, and they also remain the closest aligned to the overall Central London average, not just in 2025 but over the last�five years.
Across Central London, all sectors except for Insurance recorded a distance moved that was below the 5- and 10- year�sector average.


THE CONTRACTORS
THE NET EFFECT
�This was reinforced by overall contraction of 656,000 sq ft recorded for the year – the third consecutive decline�and the lowest level since 2020.
While the Wider City was the dominant market for expansions, it was also where the most contractions occurred, with 57 businesses reducing their Central London footprint through relocation by 553,000 sq ft. A large proportion of these were�in the City Core, where 30 occupiers reduced by a total of 416,000 sq ft. In the West End, 17 businesses contracted by 90,000 sq ft and just 2 occupiers reduced their footprint by 13,200 sq ft in East London.
The number of businesses reducing theIR office footprint reduced from 88 in 2024 to 76 in 2025 as occupiers continue to be less bearish on their office requirements than they were three years ago.
This equated to a loss of 126,000 sq ft and 368,000 sq ft, respectively. Just one contractor recorded a loss of more�than 100,000 sq ft of space, State Street relocating to 100�New Bridge Street, with all other contractors reducing�by less than 35,000 sq ft.
Of the 76 contractions, 64 leased space between 5,000 to 25,000 sq ft, equating to a loss of 327,000 sq ft and making up half of the total volume of space reduced. Looking at deals over 100,000 sq ft, with just the one recorded contraction�by State Street, on a net basis, this size band was overall expansionary by 1.19 million sq ft – the second strongest�year on record, behind 2018.
The Professional Services and Banking & Finance sectors were remained as the prominent contractors, with 23 and 19 companies reducing their office footprints in 2025.
THE EXPANDERS
THE NET EFFECT
�This included both business who acquired an additional office space or those that relocated and leased more space than their previous office. This accounted for total take-up of 6.62 million sq ft, and total expansion of 4.47 million sq ft for the year.
The majority of the expansionary activity occurred in the Wider City market, where 185 of the 244 established occupiers expanded by 2.44 million sq ft. This was primarily led by the City Core submarket, where three of the top 10 expansion deals across Central London were located, including the largest; Squarepoint’s relocation to 65 Gresham Street, which will see them increase their Central London footprint by 300,000 sq ft. Canary Wharf was also a submarket with 3 significant expansions, including; Visa’s relocation from Paddington where they are expanding by 100,000 sq ft and HSBC committing to 170,000 sq ft and adding to their existing portfolio of Central London assets.
In 2025, 313 existing Central London occupiers added to their office footprint, below the 321 that was recorded for 2024 but in line with the 5-year average.

The remaining 390 transactions were signed by established Central London occupiers, down by 5% on 2024 but 1% ahead of the 10-year average. ��A large proportion of the deals occurred in the Wider City where 296 leases were signed, equating to a 59% market share – slightly ahead of the 57% market share recorded over the last 10 years. The West End reported 181 transactions, just two deals shy of the previous year, while 27 transactions were recorded in East London. This equated to 5.6 million sq ft in the Wider City, 2.9 million sq ft in the West End and 1.1 million sq ft in East London.
Of the established companies, 94 expand their current Central London footprint by adding an additional office space to their existing portfolio, equating to 1.65 million sq ft of take-up. The remaining 296 occupiers relocated to a new office in Central London, a marginal 3% reduction on 2024.�
A further 46 deals were transacted by new market entrants either new businesses or those relocating from outside Central�London while 28 deals remained confidential.


PLEASE�PROVIDE�IMAGERY


NEW�ENTRANTS
MARKET�MOVERS
THE�NET EFFECT
THE�SPILLOVER�IMPACT

Projecting the long-term grade A average take-up forward for the next five years, the market is expected�to be in a supply deficit of 7.40 million sq ft by 2030�as a base case, with the inclusion of pipeline probable schemes an optimistic view, adding even more upward pressure to rental values in the sought-after, transport rich submarkets of Central London. Excluding the pipeline probable category, the low volumes of under construction space creates a far more challenging environment. The next spillover is not necessarily�where there is space or development, it is where�demand has already proven it wants to go.
Taking all of this into account, and looking at the supply and demand dynamics, this supply squeeze is expected to intensify over the next five years.

The demand from AI businesses in Central London has accelerated rapidly over the past 12-18 months. In 2025, 15% of take-up from the Technology sector was from AI-focused businesses, defined as organisations where artificial intelligence is core to the product and its primary competitive advantage.
NEW�ENTRANTS
ACCELERATION�OF AI DEMAND


A further 15 maintain a smaller presence below the size threshold. Among these are those we would class as large diversified technology businesses, those focused on AI infrastructure and those that are fundamentally AI-first. The regional origins reinforce London’s status as a global AI hub – of the 46 substantial occupiers, 72% are US headquartered. This reflects the importance of London as the default European HQ for US technology firms seeking access to the region’s talent, capital and enterprise client base, enabling them to develop their products further.
Taking these 46 occupiers, our forecast models yields a base case of 1.3 million sq ft of additional office demand in Central London for the next three year, with an upside of 2.8 million sq ft projected. These figures represent the net new space required by the 46 established companies, driven by potential headcount growth against current occupied areas.
In order to understand the future scale and size of demand, we have looked globally at all AI companies valued over $1 billion – 117 businesses that represent $32 trillion in aggregate enterprise value. Of these, 46 substantial occupiers already operate in London offices over 10,000 sq ft, with their aggregate London footprint estimate at approximately 1.3 million sq ft today.
This is one example of an AI business grown elsewhere�and looking to expand their footprint – a source of future occupational demand for the sector. Anthropic followed, announcing their expansion into 160,000 sq ft in 1 Triton Square, increasing headcount from 200 to 800 as they look to expand their research capabilities across Europe. Furthermore, Databricks’ pre-let of 135,000 sq ft at 10. Howland Street on a 15-year lease in Q1 2026 – the largest single-building AI-sector commitment�in London – demonstrates the long-term confidence of a well-funded and rapidly growing AI platform company in London.�The main potential drivers for these moves centre around London acting as a stable base out of the US, offering access�to top-tier talend and a robust AI research ecosystem.
April 2026 saw the announcement of OpenAi securing its first permanent London office, taking 88,000 sq ft in King’s Cross – this was expansion space driven by the firms plans to make London its largest research hub outside of the US.
While still to play out, there are a number of areas where this AI boom period may differ. Firstly, at present, AI businesses typically employ fewer people than traditional technology firms, but they have been known to generate higher revenue per employee allowing these firms to operate at a higher office density per employee.
Another differentiator between the Technology and AI boom periods is around motivation for growth – the expansion of the Technology sector was largely driven by increasing headcount and as a result, increasing office footprints. BY CONTRAST, THE CURRENT AI BOOM IS MORE RESEARCH DRIVEN, THEREFORE THE NEED FOR FLEXIBLE AND HIGH SPECIFICATION WORKSPACES ARE REQUIRED, ALTHOUGH�THIS DIFFERS FOR THE DIFFERENT AI VERTICALS.
The final key difference is the broader market environment. The Technology boom of the 2010s was during the post-GFC recovery period, whereby new office supply was higher and therefore there was less competition for prime space, and locality to transport hubs was less significant. The environment today is markedly different – a desire for grade A space in core locations, which is constrained due to a shrinking development pipeline because of viability challenges – and this will continue to impact the growth of this emerging sector, but also traditional sectors too.
TECH-BOOM�VERSUS AI-BOOM
ACCELERATION�OF AI DEMAND
Between 2000-2010, the Technology sector typically accounted for 15-20% of total Central London take-up, but during its boom period from 2011 through to 2019, that market share averaged 45% - peaking at 69% in 2014. This was driven by acquisitions from key tenants including Google, Meta, Apple and Amazon, among others. In fact, the four aforementioned tenants leased over 4.5 million sq ft across 35 transactions during that period.
�
The trajectory of the AI sector broadly follows that of the Technology sector in the 2010s, but more in its intensity than its scale.
TOP DOWN
ACCELERATION�OF AI DEMAND

Scoring each of these on a nine-component model that evaluates factors including current UK presence, publicly stated expansion plans and recent fundraising activity, the forecast model suggests a base case of 305,000 sq ft, which doubles to 610,000 sq ft in the upside case, with the latter reflecting a possibility of those with a low probability in the base case converting to active requirements as the AI sector’s growth trajectory encourages more aggressive global expansion strategies. Understanding the plans of these businesses is the most difficult to ascertain, and if anything our estimations may be on the conservative side.
Examples of pipeline companies include CoreWeave, who are expanding European operations with a London hub for enterprise sales and technical support; Cohere has identified London as its primary European base; and xAI – a venture by Elon Musk – and Helsing both with significant potential London requirements.
Beyond these established companies, our�top down analysis identifies 71 pipeline companies with a meaningful probability�of establishing, or substantially expanding, a London office over the next three years.


Annualised, this represents 467,000 sq ft per year under the base case and 1.0 million sq ft under the upside, figures that would represent a significant addition to London’s annual office take-up.
Combined, these 320 businesses are projected to yield a base case demand projection of 1.4 million sq ft and an upside of 3.1 million sq ft over the three-year period.
Many start-ups begin their journey in Central London by taking smaller units of space, either on a traditional lease or flexible workspace agreement, and with rapid expansion of investment and employment for some of these businesses, the sector is in need of more space in the capital.
We have identified 320 active, venture-capital backed AI companies across the UK, of which 57% are concentrated in London, including well-known scale-ups such as Wayve and Synthesia and fast growth enterprises like PolyAI and Darktrace. The 320 companies span 13 distinct AI verticals, each with different demand characteristics, growth trajectories and submarket preferences.�
While the large AI occupiers will ultimately turn the dial on leasing activity, London’s office market is equally shaped by the hundreds of smaller, fast-growing companies emerging from the UK’s�own AI ecosystem.
BOTTOM UP
ACCELERATION�OF AI DEMAND


As the AI sector continues to evolve, the demand for office space in Central London is forecast to increase by up to 2.1 million sq ft per year over the next three years – not quite at the levels of growth seen across San Francisco, where office demand has been exponential, and not to the extent of the tech sector boom of the 2010’s.

The global AI businesses captured by the top-down model generate large, landmark requirements in core markets and for best-in-class space. The scale-ups captured by the bottom-up model generate distributed demand: typically 5,000 to 30,000 sq ft with flexible lease terms and in more cost-effective locations. This means that the combined demand picture is perhaps less concentrated than it might appear, and is likely to spread across Central London’s submarkets, where supply is available. Landlords and developers who understand this distribution can position their assets accordingly and will be best placed to capture the structural tailwind that AI represents for London’s office market through the remainder of this decade.
The most important insight from the combined analysis is that the top-down and bottom-up demands are structurally different in company type, floorspace requirements, submarket preferences and lease structure. This is in addition to traditional technology sector take-up.
While the acceleration of office demand from AI businesses in Central London shares the growth momentum and broad clustering dynamics of the Technology boom,�this sector is more mature�and selective in its expansionary phase, shifting from quantity�to quality and from scale�to specialist requirements.
�
THE WHOLE�PICTURE
ACCELERATION�OF AI DEMAND


While the upside scenario is ambitious, it is not unreasonable and requires a conjunction of favourable market conditions, rapid expansion by leading global AI businesses, a supportive UK policy environment and adequate supply in target submarkets. Even in the base case of approximately 1.0 million sq ft per year, this represents a transformational shift in the projected tenant composition of London’s office market, with expected take-up still high enough to be classified as a sector in its own right.
NEW
SUBMARKET
TOP�DOWN
BOTTOM-UP
THE WHOLE�PICTURE


OF THE TOTAL, 34 MOVED INTO A WIDER CITY SUBMARKET WHILE THE REMAINING 18 WERE IN THE WEST END, EQUATING TO A TOTAL OF 670,000 SQ FT – THE LOWEST QUANTUM OF LEASED SPACE SINCE 2020. FIN-TECH BUSINESS rIPPLE'S LETTING AT 1 LEADENHALL FOR 93,000 SQ FT WAS THE LARGEST RECORD MOVER FOR THE SECTOR, A RELOCATION OUT OF ANOTHER CITY CORE BUILDING AND A TOTAL NET EXPANSION OF 75,000 SQ FT.
In the Technology sector, 52 moves were recorded in 2025 (24 stayers�and 28 relocators), matching�activity in 2024.
The Professional Services sector came second by count, with 72 occupiers expanding by 416,000 sq ft. However, when looking at the sectors by quantum of total expansion, the Technology sector came second, increasing floorspace by 479,000 sq ft across 53 occupiers. Of the 12 deals over 100,000 sq ft in 2025, 11 expanded on their Central London footprint, including the two largest deals of the year – Squarepoint and Visa. Small to medium sized businesses remain the drivers of expansion, with the 266 businesses occupying less than 25,000 sq ft increasing their office floorspace by 1.98 million sq ft, outstripping the 25,000-100,000 sq ft market, where 36 businesses increased their footprint by 1.16 million sq ft.
The Banking & Finance sector was the most active for expansions in 2025, with 94 businesses taking additional space across London – 48 in the West End, 38 in the City and 8 in East London – with total net expansion of 1.70 million sq ft.


This equated to 114,000 sq ft but nevertheless made up just 1%�of total Central London take-up. Q1 2026 however has seen activity surge – 230,000 sq ft was transacted in the first three months of the year, making up 50% of total Technology sector activity and 12% of Central London leasing, the highest proportions recorded. A further 250,000 sq ft from AI-focused businesses has already completed in April (Q2) and if this momentum continues throughout the year, the total quantum leased by this sector group would be the highest volume on record. However, the reality is that we are still at the beginning of the cycle with regards to the sector’s occupational demand, and in order to best understand the potential for growth, we have looked at this from both a top down and a bottom up perspective.
AI Enterprise Software is the largest vertical, comprising 87 companies and generating a base case demand estimate of 341,000 sq ft and an upside of 695,000 sq ft over the next three years. Whilst their space requirements are individually modest, when combined they have the potential to drive AI take-up substantially. These businesses are likely to cluster around King’s Cross, Shoreditch, Clerkenwell and the fringes of the City where tech-friendly building stock, transport connections and the creative neighbourhood atmosphere supports talent attraction.
AI FinTech and Financial Services, though comprising only 24 companies, punches dramatically above its weight in terms of demand potential. Its base case of 402,000 sq ft an upside of 968,000 sq ft makes it the single largest demand-generating vertical on a per-company basis. This is reflective of the unique characteristics that define this group: they tend to be better funded than the average AI startup and they require office space in close proximity to Banking & Finance and Insurance clients, which make up a significant proportion of London’s office footprint. Target locations for this cohort is likely to be spread across London submarkets, where rents are higher but the client adjacency justifies the premium.
TAKE NOTE�THE CHART�WILL HAVE ADD VALUE LIKE�CONSISTENCY AND READABILITY NEXT VERSION
TAKE NOTE�THE CHART�WILL HAVE ADD VALUE LIKE�CONSISTENCY AND READABILITY NEXT VERSION
TAKE NOTE�THE CHART�WILL HAVE ADD VALUE LIKE�CONSISTENCY AND READABILITY NEXT VERSION
TAKE NOTE�THE CHART�WILL HAVE ADD VALUE LIKE�CONSISTENCY AND READABILITY NEXT VERSION
TAKE NOTE�THE CHART�WILL HAVE ADD VALUE LIKE�CONSISTENCY AND READABILITY NEXT VERSION
TAKE NOTE�THE CHART�WILL HAVE ADD VALUE LIKE�CONSISTENCY AND READABILITY NEXT VERSION
TAKE NOTE�THE CHART�WILL HAVE ADD VALUE LIKE�CONSISTENCY AND READABILITY NEXT VERSION
TAKE NOTE�THE CHART�WILL HAVE ADD VALUE LIKE�CONSISTENCY AND READABILITY NEXT VERSION
TAKE NOTE�THE CHART�WILL HAVE ADD VALUE LIKE�CONSISTENCY AND READABILITY NEXT VERSION
CHART�IN-PROGRESS
WILL ADD�ANIMATION�ONCE APPROVED
PLEASE PROVIDE�IMAGERY
PLEASE PROVIDE�IMAGERY
PLEASE PROVIDE�IMAGERY
PLEASE PROVIDE�IMAGERY
PLEASE PROVIDE�IMAGERY
PLEASE PROVIDE�IMAGERY
PLEASE PROVIDE�IMAGERY


As a result, occupiers are faced with two choices – stay put�for a period or relocate to bordering submarkets where choice�is available. So what does this mean for London’s office geography?
PLEASE�PROVIDE�IMAGERY
GET IN TOUCH
GET IN TOUCH
PLEASE�PROVIDE�IMAGERY
PLEASE�PROVIDE�IMAGERY
PLEASE�PROVIDE�IMAGERY
TECH-BOOM�VS AI BOOM
FORMER
SUBMARKET
talent and a robust
NEW
SUBMARKET