An Interactive Industry Leadership Report from
CATEGORY
CAPTAINS
2025
Eggs
Salad Dressing
Coffee Creamers
Dry Packaged Dinners
Fresh & Deli
Frozen Foods
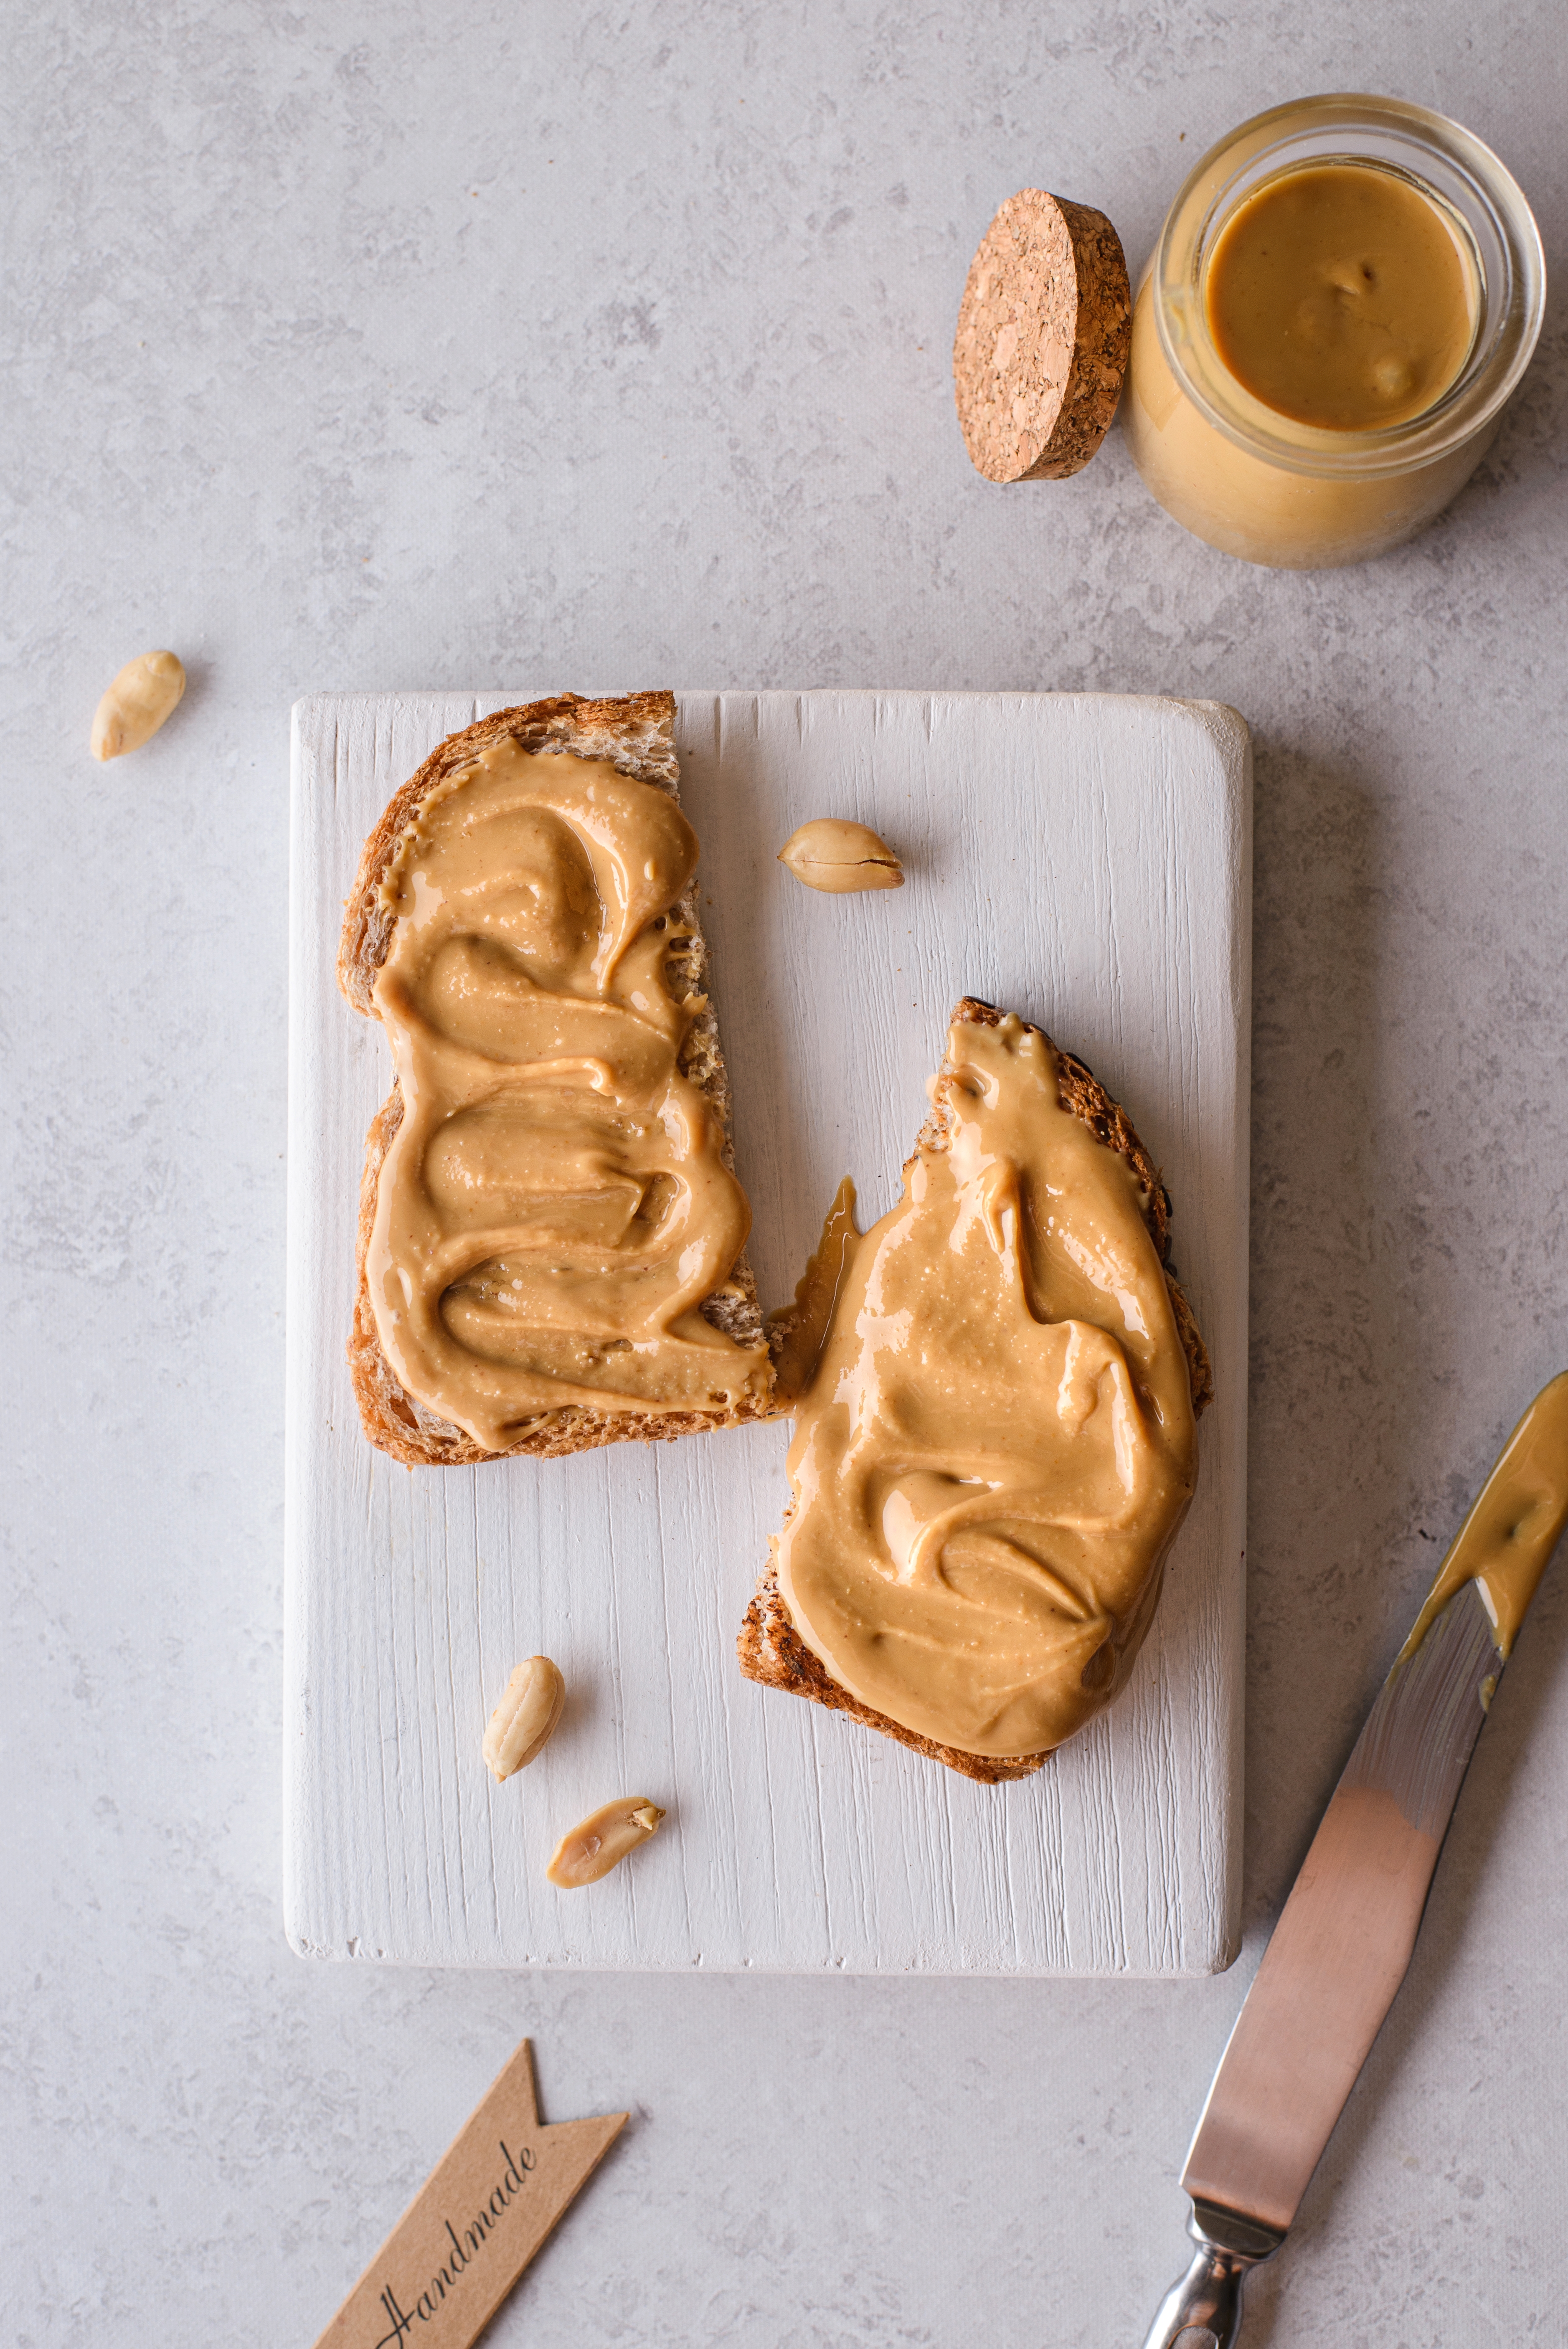
Peanut Butter
Viscous
Plant-Based Beverages
Specialty Foods
Confectionery/Chocolate
Yogurt
A Canadian Grocer exclusive, click below to find data and insights that identify trends and growth opportunities in these categories:
CATEGORY CAPTAINS TABLE OF CONTENTS
CULINARY SALT Captain: Windsor Salt
FRESH & DELI Tree of Life
PROTEIN SNACKS Jack Link's Canada
SPECIALTY FOODS Tree of Life
CHECK BACK FOR MORE CATEGORIES ADDED MONTHLY
SPECIAL PROMOTIONAL FEATURE
BREAKFAST Kraft Heinz
PEANUT BUTTER The J.M. Smuckers Co.
SALAD DRESSING Pure by J.L. Kraft
COFFEE CREAMERS International Delight
PLANT-BASED BEV. Silk
YOGURT Activia
Bread
Coffee
FROZEN FOODS Con Agra
EGGS Gray Ridge
COFFEE Van Houtte
CONFECTIONERY/ CHOCOLATE Ferrero
FROZEN FODS Con Agra
COFFEE CREAMER International Delight
PLANT BASED BEVERAGES Silk
VISCOUS Heinz
YOGURT Activa
PEANUT BUTTER Kraft
CATEGORY DATA
Sources: 1. NielsenIQ Discover, Total Chocolate, National GDM+ RFC + C&G + GMWC, L52W period ending December 28 2024 2. NielsenIQ Discover (XMAS INCL (EVDAY SEAS EXCL JR), National GDM + RFC+ C&G, 9 week period ending December 28 2024; EASTER SEAS CHOC, 12 week period ending April 6 2024, NATIONAL EX NFLD GB + DR + MM + RFC + C&G; VAL INCL (EVDAY SEAS), 5 week period ending February 24 2024, NATIONAL EX NFLD GB+ DR + MM + RFC + C&G; HLWN SEAS + EVDAY SEAS JR, 13 week period ending November 9 2024, NATIONAL EX NFLD GB+DR+MM + RFC + C&G) 3. Numerator Insights, Christmas Chocolate, Total Outlets, 9 week period ending December 28 2024 4. Suzy 2023– Christmas Survey n=300, Shoppers 18-65 who bought Chocolate at the Holidays 5. NielsenIQ Discover, XMAS INCL (EVDAY SEAS EXCL JR) BOXED Chocolate, National GDM + RFC + C&G, 9 week period ending December 28 2024 6. Suzy – Christmas Survey n=300, Shoppers 18-65 who bought Chocolate at the Holidays
The Canadian Chocolate market is well-established and a steadily growing industry, that saw +2% growth in $ sales in 20241. With Chocolate so synonymous during the holidays, key seasonal peaks, such as Valentine’s Day, Easter, Halloween, and Christmas contribute significantly to overall sales of the Chocolate market2. During these times, the Chocolate industry is often greeted with seasonally-specific graphics, limited-time formats, or limited-time offerings during key holidays.
Established Items
Source: Nielsen Market Track. XMAS INCL (EVDAY SEAS EXCL JR). 9 week period ending December 28 2024. NATIONAL EX NFLD GB + DR + MM + RFC + C&G
Boxed is the Biggest Format at Christmas with Shoppers Buying for Gifting, Hosting and Treat Occasions
Source: Suzy 2023 – Christmas Survey n=300, Shoppers 18-65 who bought Chocolate at the Holidays Q14 - Do you always give chocolate as a gift at the holidays? Q15 - Why did you decide to purchase Chocolate as a gift this year? Q13 - When gifting chocolate this Holiday Season, did you gift the chocolate with another item or just gift on its own?
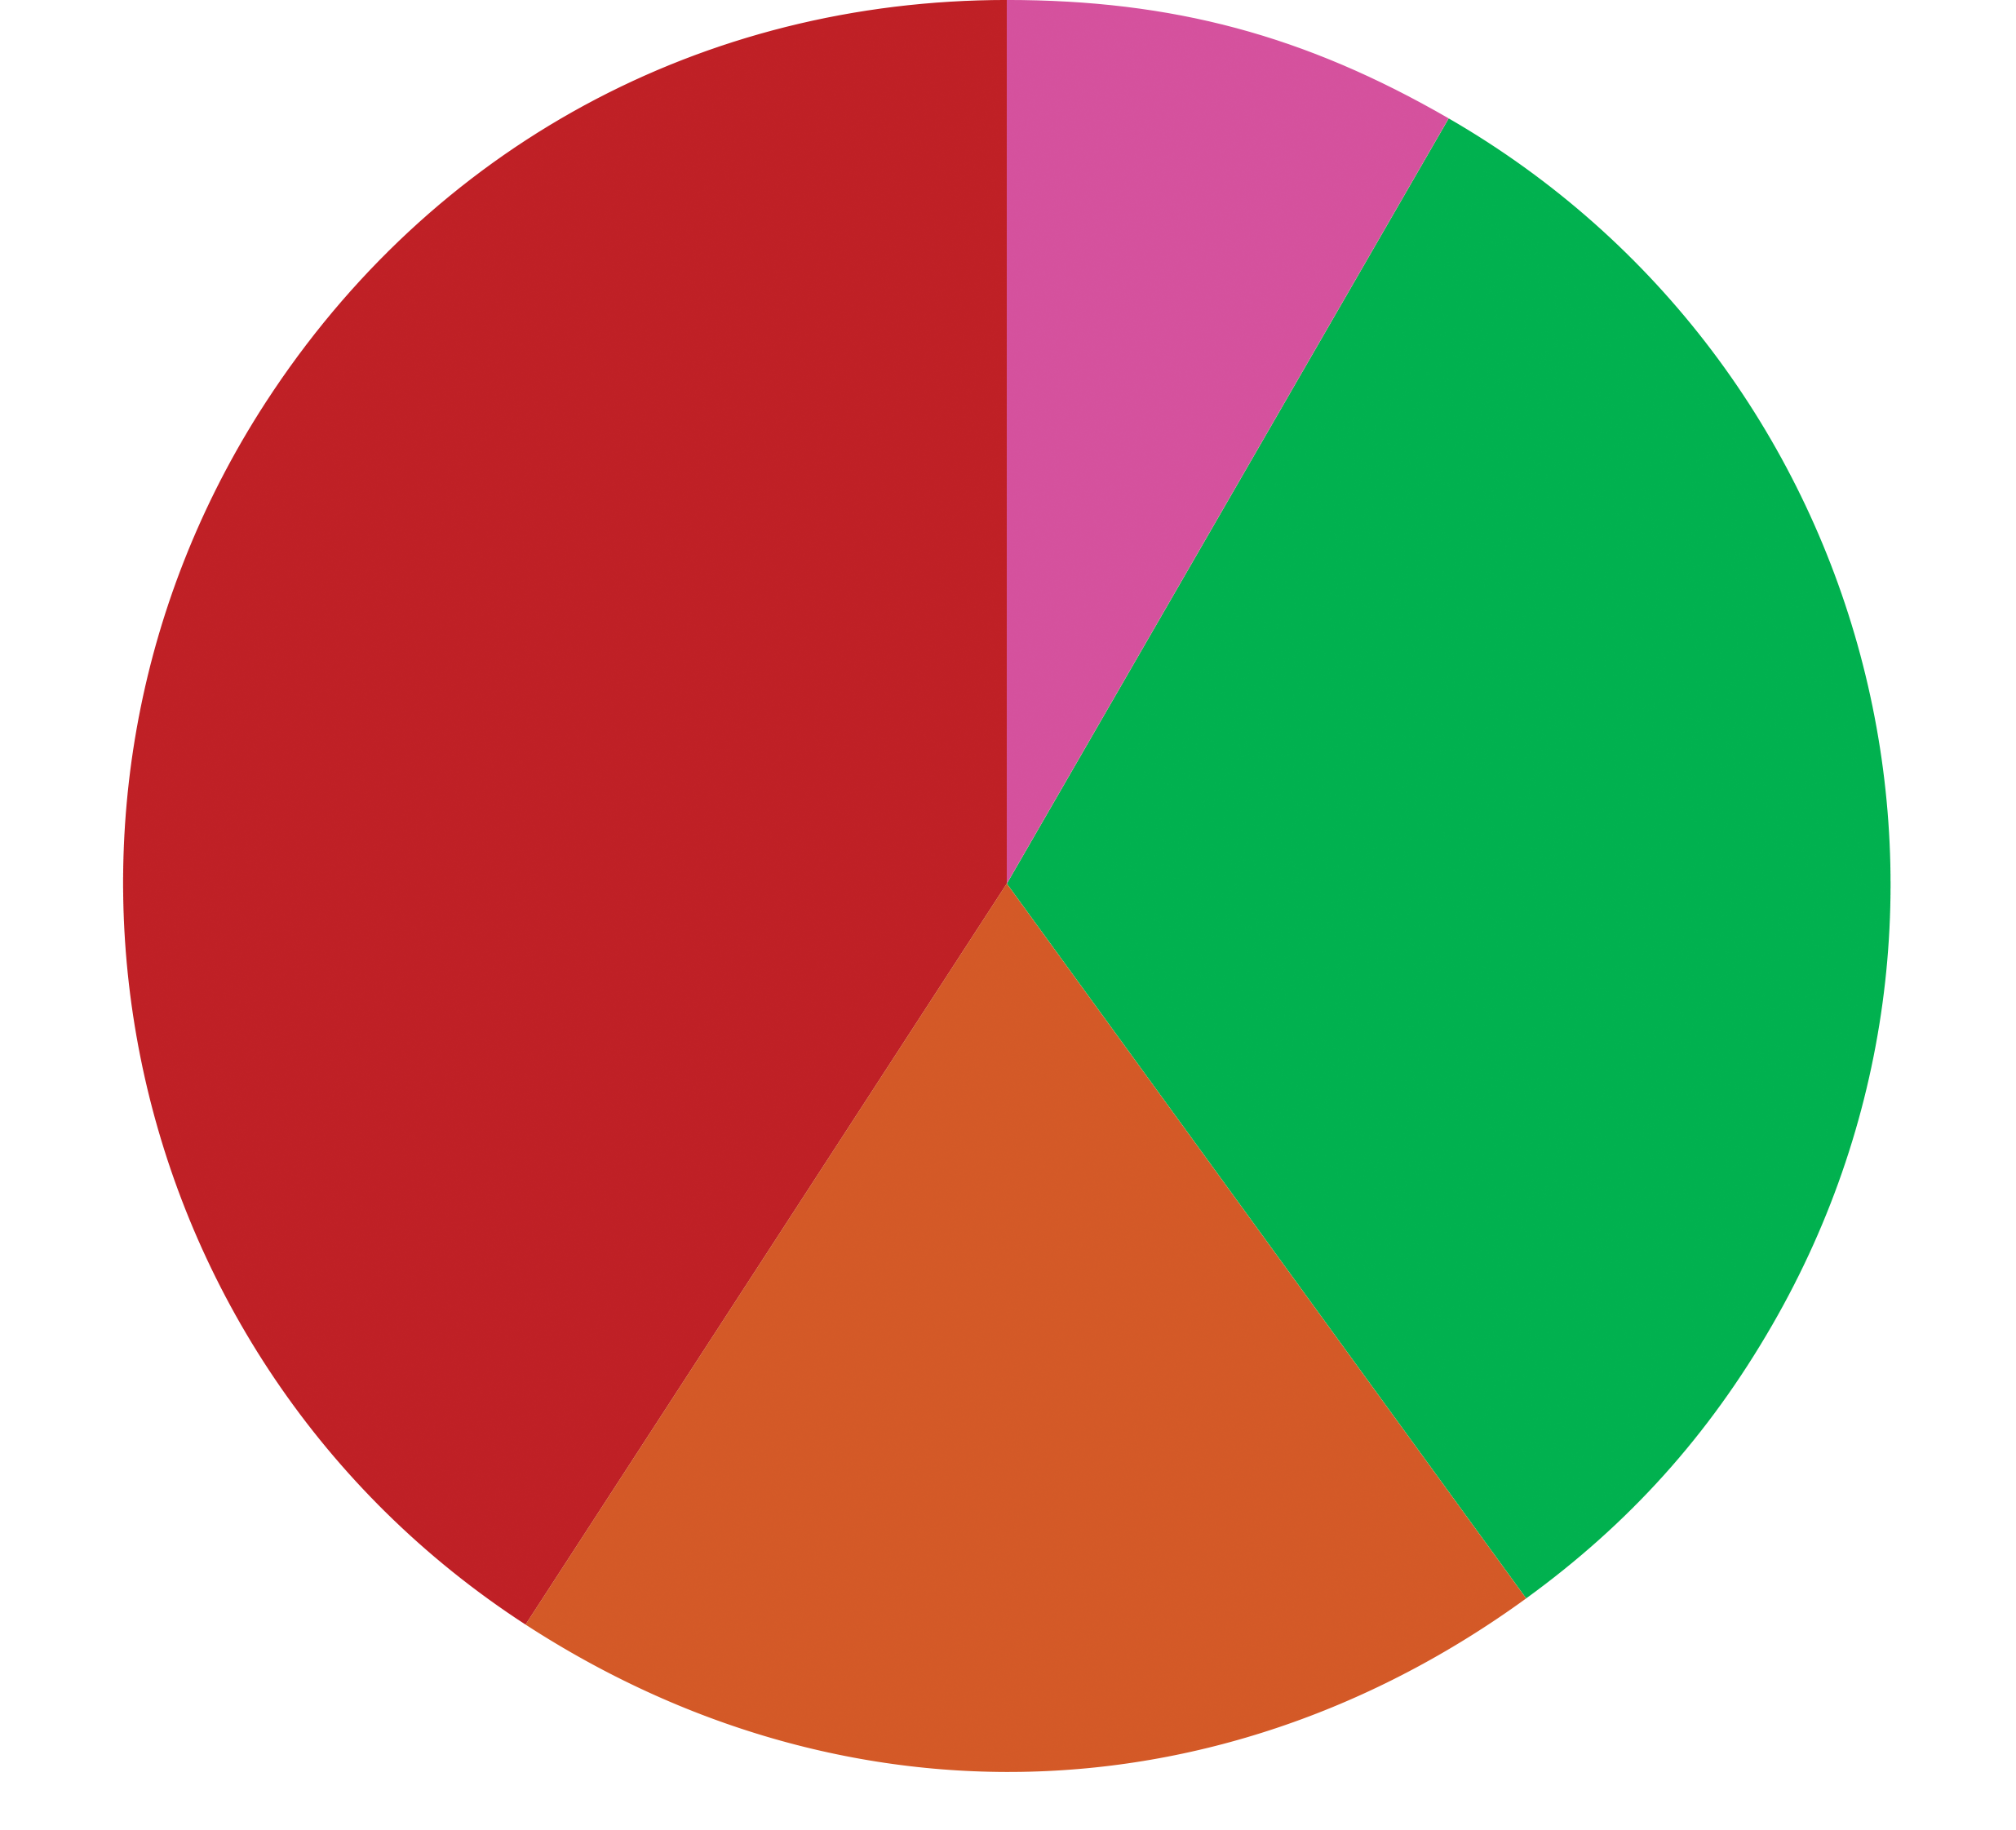
Chocolate Continues to be a Key Gift at Christmas
Source: NielsenIQ Discover XMAS INCL (EVDAY SEAS EXCL JR), 9 week period ending December 28, 2024. NATIONAL EX NFLD GB + DR + MM + RFC + C&G EASTER SEAS CHOC, 12 week period ending April 6 2024, NATIONAL EX NFLD GB + DR + MM + RFC + C&G VAL INCL (EVDAY SEAS), 5 week period ending February 24 2024, NATIONAL EX NFLD GB + DR + MM + RFC + C&G HLWN SEAS + EVDAY SEAS JR, 13 week period ending November 9 2024, NATIONAL EX NFLD GB + DR + MM + RFC + C&G
Christmas Is The Biggest Season of the Year for Chocolate
Breakfast
Culinary Salt
Protein Snacks
Specialty/Global
Salad Dressings
Frozen Food
Personal Care
Canned Tomatoes
Plant-Based
CONFECTIONERY/SEASONAL CHOCOLATE
2025 CATEGORY CAPTAINS
KEY CATEGORY INFORMATION
1
3
2
BACK TO HOME PAGE
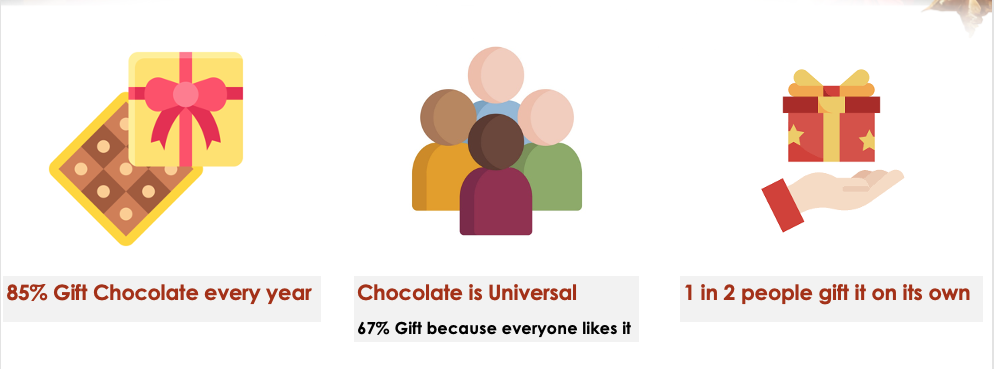
Nearly two-thirds of Canadian households purchase Chocolate during the Christmas holiday3, making Christmas the largest $ sales driver of category sales during the year. Chocolate remains a popular Christmas gift, with 1 in 2 people choosing to give it during the holiday season4. Boxed Chocolate represents 62% of total seasonal category $ sales5, making it the most loved form of Chocolate during the holidays. In particular, Boxed Chocolate is a favourite for gift-giving, for hosting or for sharing during a party, or even as a self-indulgent treat during the festive season6.
As a retailer, stocking up on leading-brand Boxed Chocolates will provide your shoppers with options for all their holiday special moments.
Top Reasons Why Shoppers Buy Boxed Chocolate at the Holidays
4
Non-Alcoholic Beverages
Source: Suzy – Christmas Survey n=300, Shoppers 18-65 who bought Chocolate at the Holidays Q4 – And now, for each of the reasons you just mentioned, please select the chocolate format/s you purchased for each of those occasions
Sales
8.3%
30.7%
21.5%
39.6%
$63.4M
$234.9M
$144.1M
$302.5M
Valentine's Day 2024 Easter 2024 Halloween 2024 Christmas 2024
85% gift Chocolate every year
Chocolate is Universal 67% gift because everyone likes it
1 in 2 people gift it on its own
Total Christmas $ Sales: $302.5M
$350M $300M $250M $200M $150M $100M $50M $0M
Boxed Novelty Pieces Bars Singles Multi Junior King Size
$1.9M (0.6% $ Shr)
$2.3M (0.8% $ Shr)
$6.6M (2.2% $ Shr)
$18.2M (6.0% $ Shr)
$39.1M (12.9% $ Shr)
$48.0M (15.9% $ Shr)
$186.5M (61.7% $ Shr)
$26.8M (8.8% $ Shr)
ADVENT
Gifting
Hosting
Self-Indulgence/ Gifting
62%
56%
41%
To give as a gift to adult family or friends
Hosting or sharing at large gathering/party
As a gift for myself
Confectionery
(Under $1 M)
2025 CATEGORY CAPTAIN
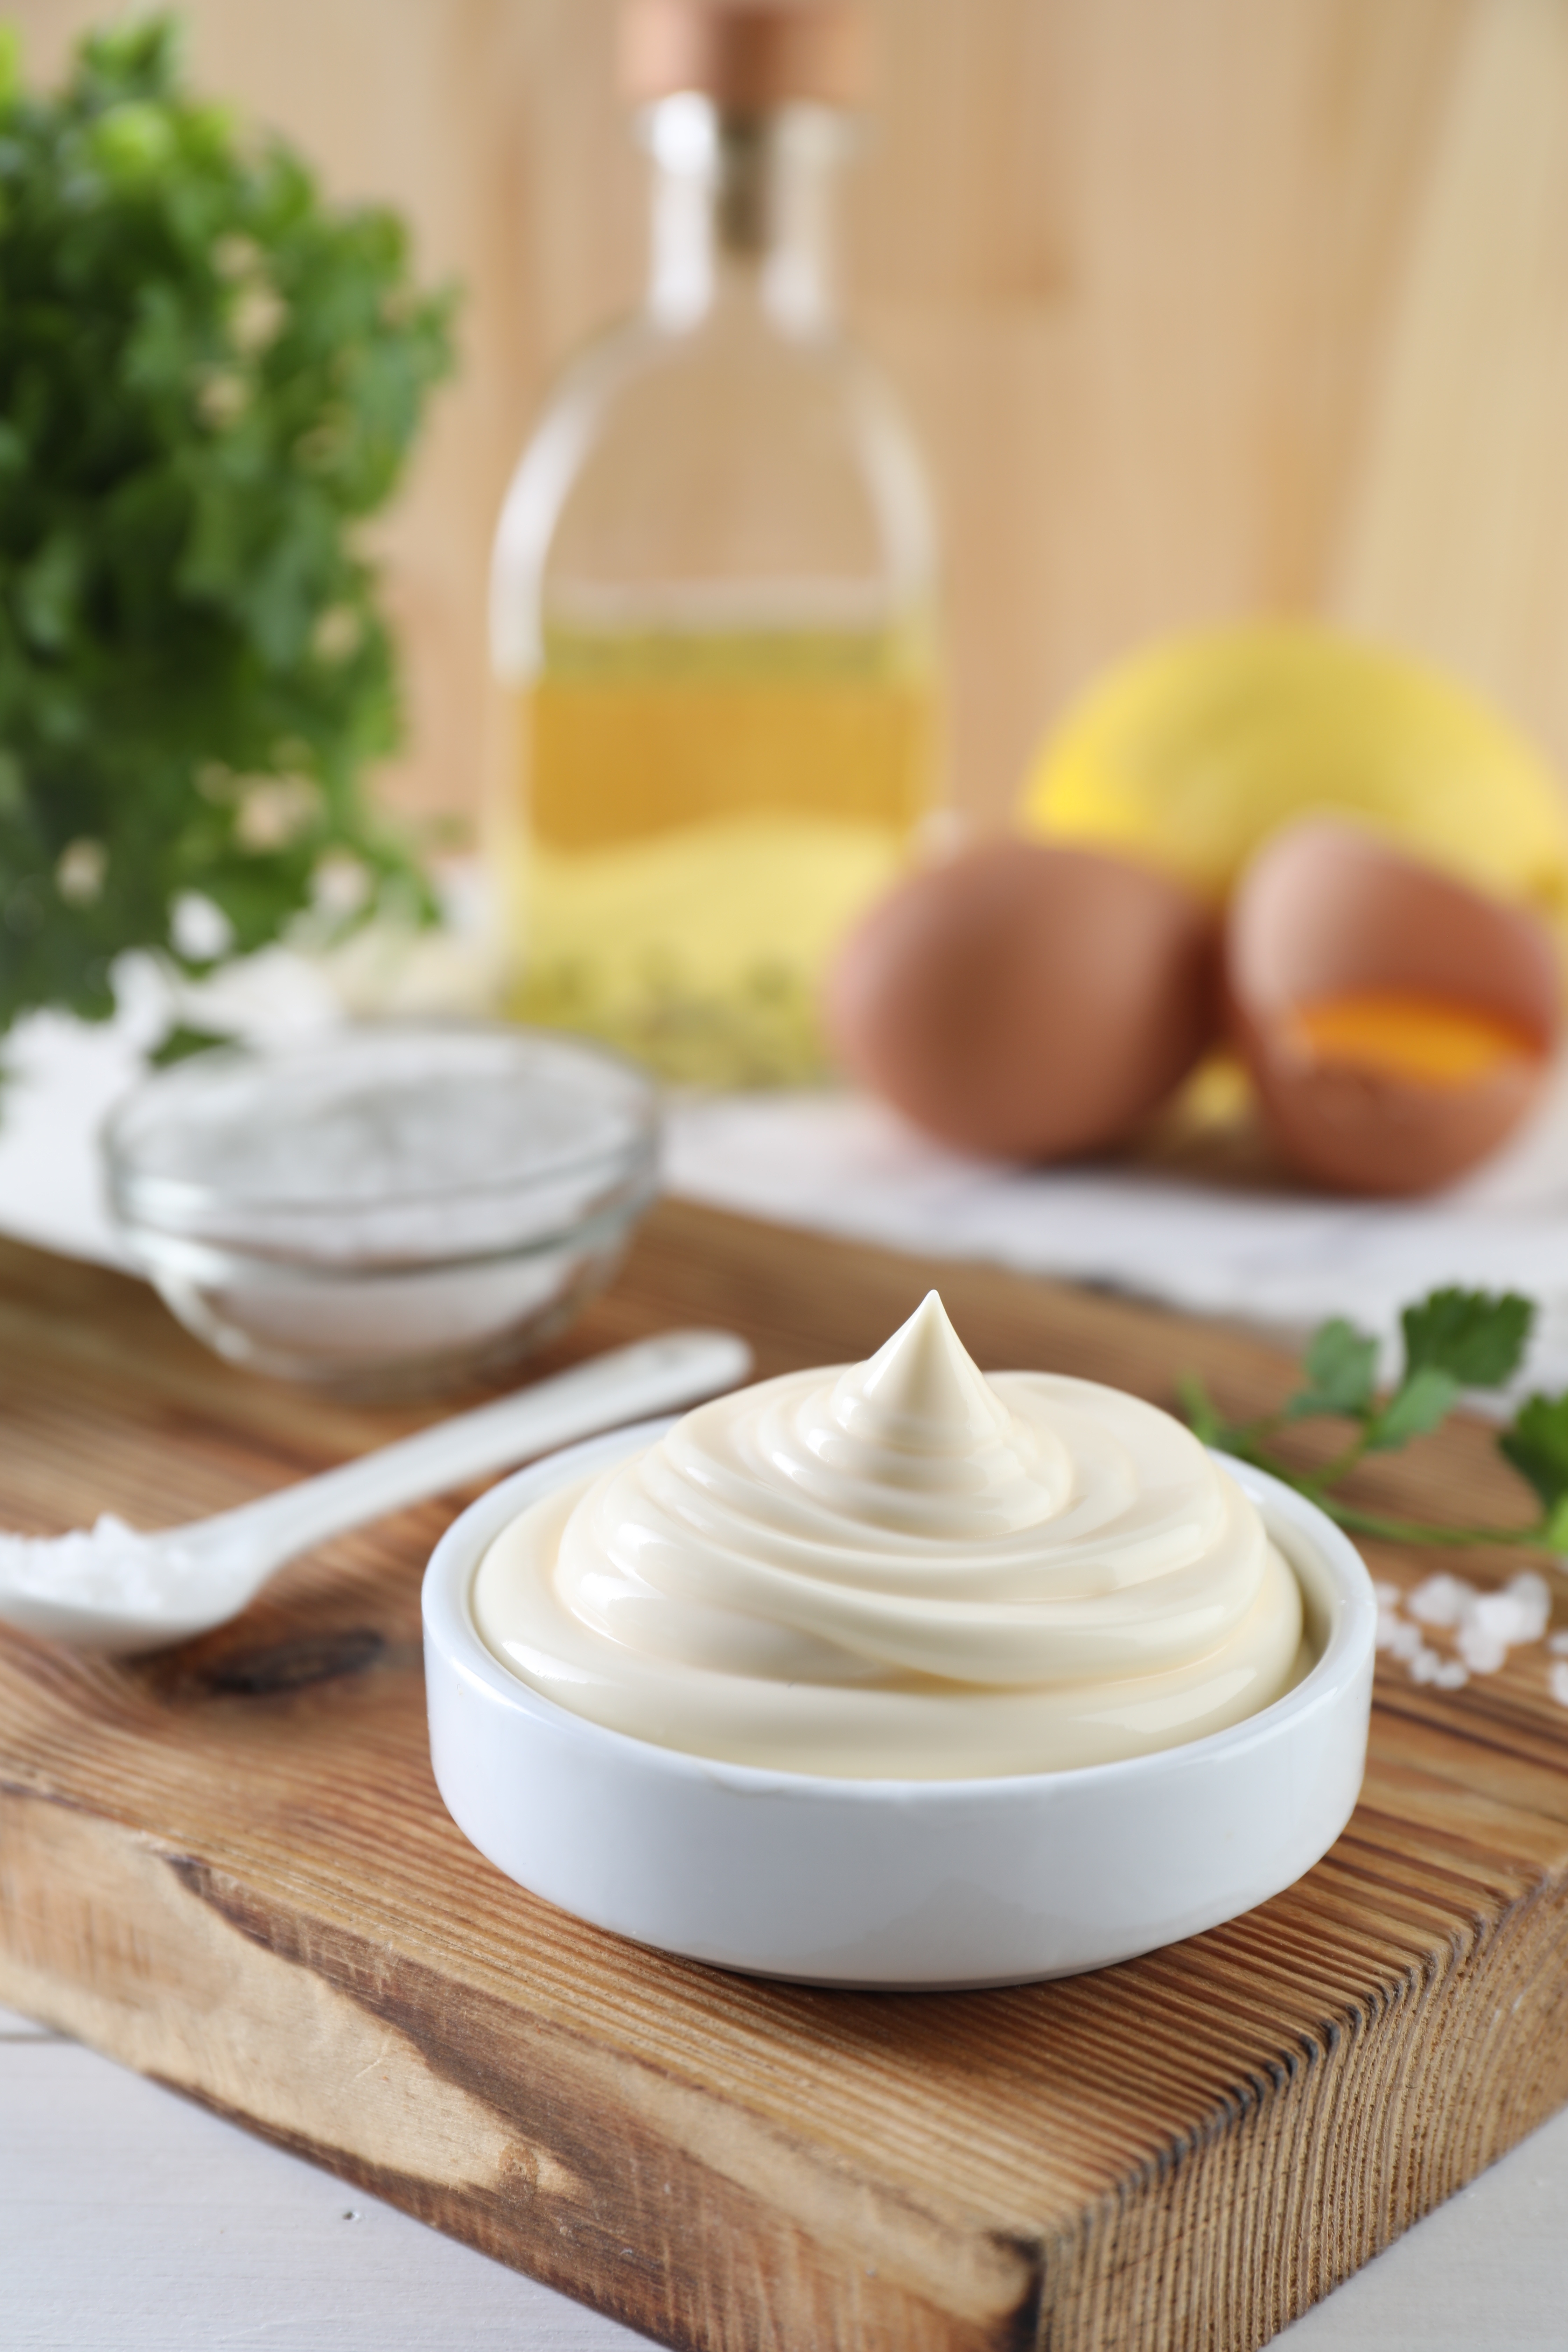
The Mayonnaise and Sandwich Spreads category represents a $423.5MM market, currently growing, with dollar sales up 4.5%, and sales pounds up 2.1%.1
Source: NielsenIQ Panel On Demand Homescan | CA - KRAFT HEINZ - MAYO & SPOONABLE DRESSING - 13 Facts of VISCOUS, MAYO (MAYONNAISE), SSD (SPOONABLE SALAD DRESSING) for Total Outlets in Total Canada during 3 52 Weeks Rolling, 2 Years, YTD - 34 w/e 23/08/25
Household Penetration, Viscous
Source: NielsenIQ Retail Measurement | CA - KRAFT HEINZ - VISCOUS - 5 Facts of 7 Products in NATIONAL EX NLFD GDM + GM+WC during 3 52 Weeks Rolling, 2 Years, YTD period ending July 26, 2025
Viscous $ Sales Growth
VISCOUS
$405,148,832
$423,552,434
$377,501,849
Mayonnaise remains the dominant segment with 83.0% of category share and has gained share each of the past two years. Much of the Mayonnaise category’s growth has been driven by the increasing importance of flavoured items (+74.7% sales pounds vs. 2023).1
Penetration of Mayonnaise is 69.1% and has seen consistent year-over-year growth in household reach.2 While inflation has contributed to Mayonnaise’s growth, the category’s slight increase in pounds per buyer indicates potentially stronger consumer engagement. Additionally, the repeat purchase rate has risen to 73.4%, reflecting improved loyalty and sustained demand.2
2024
2023
MAYO
SSD
+8.8%
+1.4%
+6.7%
-4.7%
+7.3%
+4.5%
66.2%
67.9%
69.1%
29.7%
27.8%
25.4%
78.5%
79.1%
78.4%
OVERALL VISCOUS
SSD: Spoonable Salad Dressing MAYO: Overall Mayonnaise
Sources: 1. NielsenIQ Retail Measurement | CA - KRAFT HEINZ - VISCOUS - 5 Facts of 7 Products in NATIONAL EX NFLD GDM + GM+WC during 3 52 Weeks Rolling, 2 Years, YTD period ending July 26, 2025; 2. 13 Facts of VISCOUS, MAYO (MAYONNAISE), SSD (SPOONABLE SALAD DRESSING) for Total Outlets in Total Canada during 3 52 Weeks Rolling, 2 Years, YTD - 34 weeks ending August 23, 2025 Demographic Total Panel People People Group
Source: NielsenIQ Retail Measurement | CA - KRAFT HEINZ - VISCOUS - 5 Facts of 7 Products in NATIONAL EX NFLD GDM + GM+WC during 3 52 Weeks Rolling, 2 Years, YTD period ending July 26, 2025
$ and $ Changes vs. YA
$423.5
MAYONNAISE
SPOONABLE SALAD DRESSING
TOTAL VISCOUS
BASE MAYONNAISE
FLAVOURED MAYONNAISE
$351.4
$72.1
$290.7
$60.7
$405.1
$329.5
$75.7
$280.9
$48.5
+3.5%
+25.0%
(in $ millions)
Sales Volume and % change vs YA
122.7
98.6
24.1
87.4
11.2
120.1
-5.2%
+2.1%
+4.1%
+1.7%
+27.1%
94.7
25.4
85.9
8.8
SPOONABLE SALD DRESSING
(in millions of sales pounds)
$ Share Per Segment
TOTAL MAYONNAISE 83%
SPOONABLE SALAD DRESSING 17.0%
BASE MAYONNAISE 68.7%
FLAVOURED MAYONNAISE 14.3%
OVERALL
$ Change L3Y
Household Penetration
$275,316,003
$245,674,252
$245,591,994
69.8%
Source: NielsenIQ Retail Measurement | CA - KRAFT HEINZ - PEANUT BUTTER - 5 Facts of 18 Products in NATIONAL EX NFLD GDM + GM+WC during 3 52 Weeks Rolling, 2 Years, YTD period ending July 26, 2025
CONVENTIONAL PB
NEXT TO FRESH & DELI
Source: 5 Facts of 18 Products in NATIONAL EX NFLD GDM + GM+WC during 3 L52W Rolling, 2 Years, YTD period ending July 26, 2025
PEANUT BUTTER
Peanut butter's role as a staple in Canadian diets is underscored by strong penetration at 66.5% of households,2 with equally robust repeat rates, with 71.4% of buyers returning, highlighting habitual consumption and loyalty across the category.2 According to NIQ’s Category Shopping Fundamentals survey, consumers are increasingly guided by health-oriented attributes, particularly: natural ingredient profiles, reduced or no sugar content, and the absence of artificial additives. These preferences are likely contributing to the sustained momentum in the Natural segment, signaling a gradual shift in consumer expectations toward cleaner labels and perceived better-for-you options.
The Canadian peanut butter category is valued at $347.6 million,1 holding steady in dollar sales with a modest -0.3% decline in pounds sold in 2025. Conventional peanut butter (excluding Natural) continues to anchor the segment with 78.3% share,1 though it faces gradual year-over-year dollar volume declines. Natural peanut butter remains a category growth driver, posting +3.3% in dollar sales and increasing share to 21.7%.1
$51,646,028
$53,010,882
$55,101,617
NATURAL PB
67.4%
66.5%
Sources: 1 NielsenIQ, NAT GB+DR+MM, L52W period ending May 18, 2025; 2 NielsenIQ Retail Measurement | CA - KRAFT HEINZ - PEANUT BUTTER - 5 Facts of 18 Products in NATIONAL EX NFLD GDM + GM+WC during 3 52 Weeks Rolling, 2 Years, YTD period ending July 26, 2025
Sources: 1 Caddle Cheese Shopping Insights, March 2023; 2 NielsenIQ, All Channels, Natl L52W period ending Dec 30, 2023; 3 Mintel Canada, Cheese, 2022
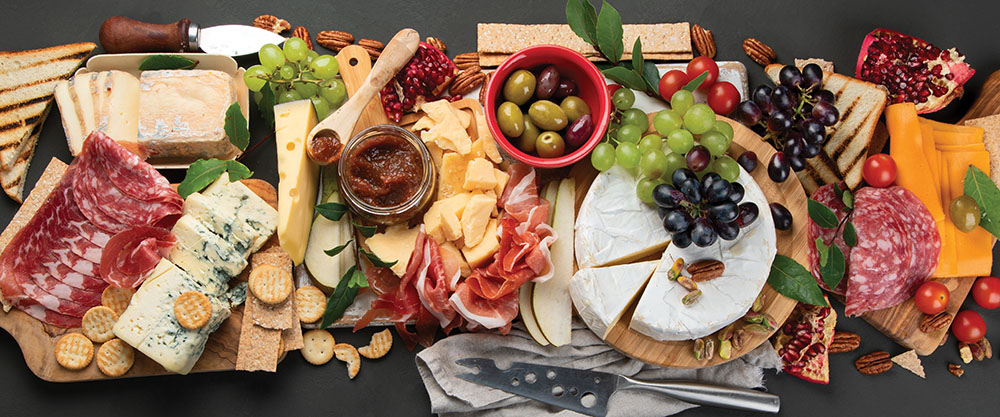
Canadians take their cheese seriously, with 86% saying that cheese is a planned purchase.1 Packaged cheese is by the far the largest segment within the category, representing a 60% dollar share or $3B and growing at +5%.2 Most consumers are making their cheese purchases at grocery stores – with an even split between channels: 48% of consumers buy at conventional grocery and 47% buy at discount. Within the grocery store, most consumers are purchasing from the dairy section, however 1/3 are also purchasing from the deli counter and another 1/3 are purchasing from dedicated cheese counters.3
FRESH & DELI
2024 CATEGORY CAPTAINS
Expanded occasions – the versatility of cheese will be its winning factor. The vast array of domestic and imported varieties fulfills all need-states and occasions.
Cheese has not been immune to ongoing pricing concerns, but the pièce de resistance of this category is its flexibility between nourishment and indulgence.
Source: NielsenIQ, All Channels, Natl L52W period ending Dec 30, 2023
Familiar flavours – flavoured cheeses are an important segment to the category, but consumers will reach for familiar before unique flavour innovation. Familiarity is a safe buying strategy, especially for specialty cheeses.
Variety for occasion – cheddar continues to hold a large share of our fridge deli drawers, but curious consumers are open to trying different varieties. Domestic artisanal brands are showcasing stellar cheeses. Meanwhile, access to imported cheese varieties from abroad allows for global exploration.
Base: 1,901 internet users who eat cheese Source: Kantar Profiles/Mintel April, 2022
Dairy section of grocery stores (i.e. where cheese is pre-packaged)
Deli counters in grocery stores
Dedicated cheese counters in grocery stores (i.e. sells artisanal cheese)
Where Cheese Is Typically Purchased
Cheese Ticks the Boxes on Both Nourishment and Indulgence
Cheese makes meals/snacks more nourishing
Cheese makes for an indulgent treat
% agree
As a category, one of cheese's biggest advantages is it meets a variety of needs. The vast majority of Canadians view cheese as being both a nourishing and indulgent option when deciding what to eat. As the category looks to grow in a heavily penetrated market, increasing frequency offers more opportunity. In this respect, cheese's versatility is its biggest asset.
NATURAL CHEESE - EXACT WEIGHT NATURAL CHEESE - EXACT WEIGHT DELI CREAM CHEESE - EXACT WEIGHT NATURAL CHEESE - RANDOM WEIGHT PROCESSED CHEESE SLICES COTTAGE CHEESE GRATED CHEESE PRODUCTS
3,073,162.1 909,617.7 353,842.6 249,813.7 248,764.4 144,349.6 100,667.7
+5% +6% +9% -7% +6% +18% -5%
433,464.0 107,491.0 74,454.3 7,187.5 49,873.1 28,905.9 10,524.7
+1% -1% 0% -9% +1% +9% -10%
Cheese Performance in Canada
$ (000)
$ Change vs YA
Units (000)
Unit Chg vs YA
90% agree
83% agree
2024 CATEGORY CAPTAIN
Source: Mintel Canada, Cheese, 2022
NEXT TO PROTEIN SNACKS
BACK TO CULINARY SALT
Sources: 1 Mintel, Future of Animal Proteins, 2024; 2 Canadian Grocer GroceryIQ Study, 2024; 3 Mintel, Snacking Motivations, 2024
Within the Protein Snack category, meat snacks have continued to demonstrate consistent year-over-year growth in Canada, fueled by consumers' desire to ensure they are getting enough protein in their diet.
PROTEIN SNACKS
Meat Snacks encompass more than just Beef Jerky. Although Jerky represents over 60% of the category, we continue to innovate to provide a variety of protein types, flavours and formats (meat sticks, tender bites, steaks & combos) to meet all consumer and shopper preferences.
Canadians are turning to snacks with protein in their quest for healthier food options.
46% of Canadian consumers agree they can't get enough protein without eating animal meat.1
Consumers are increasing their snacking, with 22% snacking 3+ times a day, and 63% at least somewhat agree that a few snacks can be more satisfying than a meal.3
Trends in product innovation, coupled with consumers’ focus on prioritizing nutritional snacking, will continue to fuel the growth of Meat Snacks in Canada.
Meat Snacks, as a Category, Continue to Deliver Sales Growth
$213 MM
$221 MM
$231 MM
$250 MM
2022
2026*
Source: NielsenlQ MarketTrack. National All Channels. Total Meat Snacks Trended sales L52W period ending July 13, 2024. * Projected Sales
Although consumers face mounting expenses, they prioritize categories offering potential long-term health benefits.
Protein is considered the most important nutrient, and most Canadians think of meat as the main source of protein.
Canadians are turning to snacks with protein in their quest for healthier food options.1
Meat Snack Segments and Formats
Jerky & Nuggets
Meat Sticks
Meat & Cheese Combos
Steaks & Bars
26%
64%
6%
4%
Source: 1 SimplyProtein/Maru Public Opinion online panel survey, February 8, 2023
Source: NielsenIQ. National Grocery, Drug & Mass Merchandise + Convenience WCGM. L52W period ending May 18, 2024
NEXT TO SPECIALTY FOODS
BACK TO FRESH & DELI
Nearly 1 in 4 health conscious grocery store shoppers indicated that they are interested in the protein content of the foods they purchase.2
Meat Snacks Continue to Attract New Shoppers
Meat Snacks attracted +200,000 additional Canadian households to purchase the category in 2023. Shoppers are spending more and putting Meat Snacks in their basket more often.
More Buyers
More $ Per Buyer
More Trips Per Buyer
3.4 Million Households
+200,000
Source: Nielsen Homescan. Market Summary. 52 weeks to Feb. 2024. Total Outlets. Total Meat Snacks
Sources: 1 Mintel Canada, August 2024
Base: 2,000 internet users aged 18+ Source: Kantar Profiles, August 2024
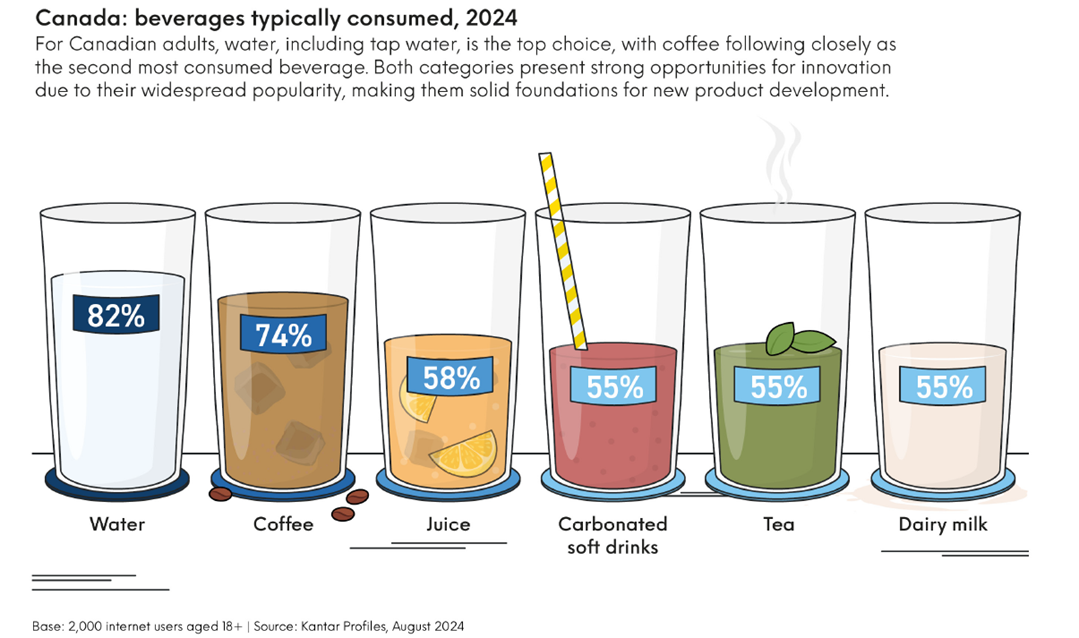
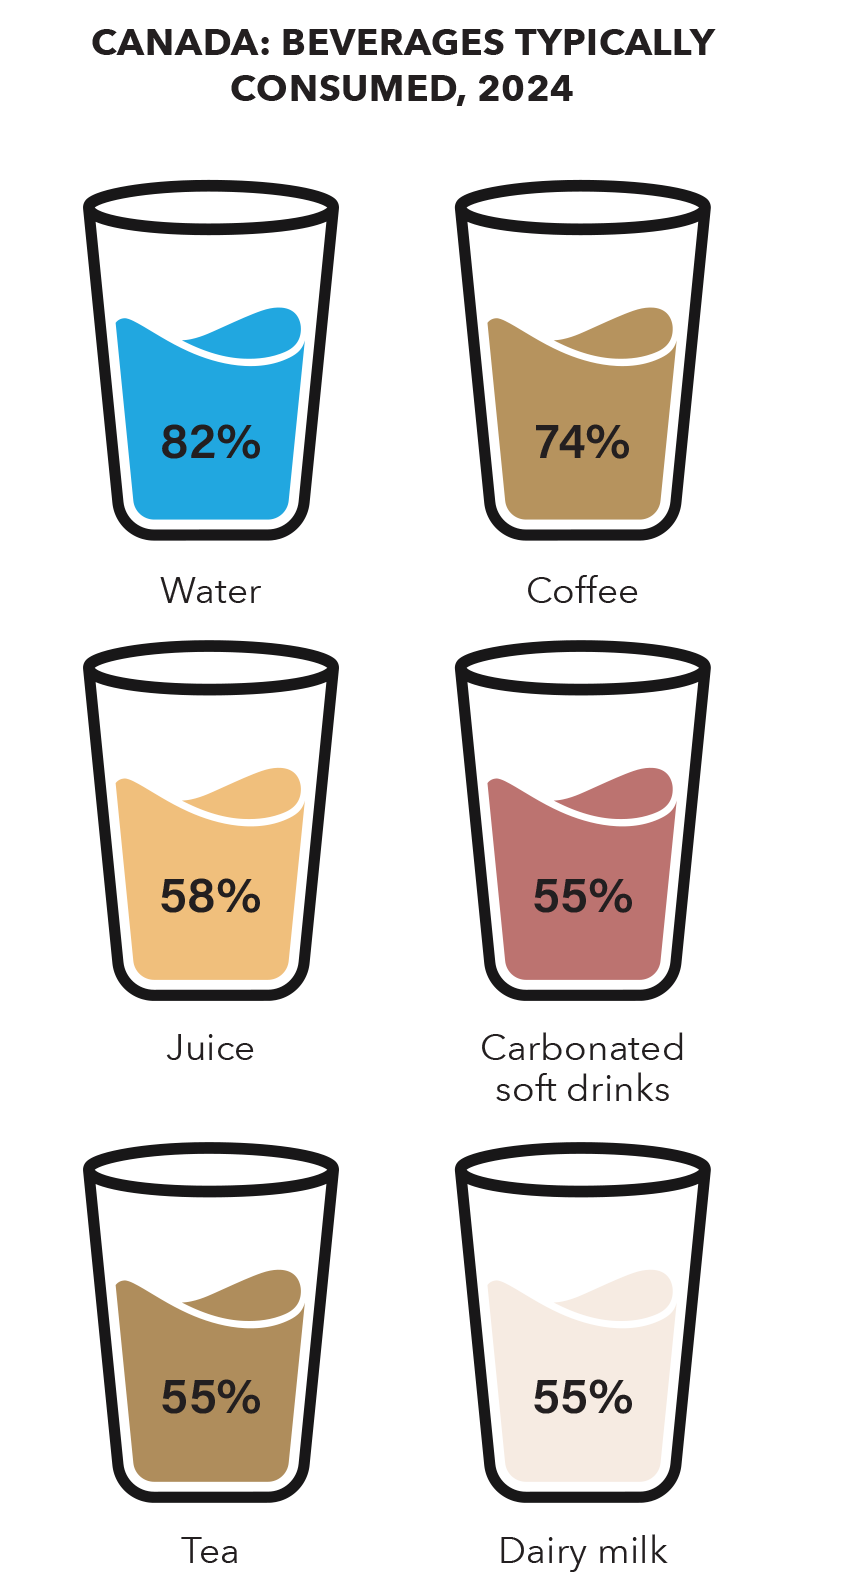
Canada: Beverages Typically Consumed, 2024
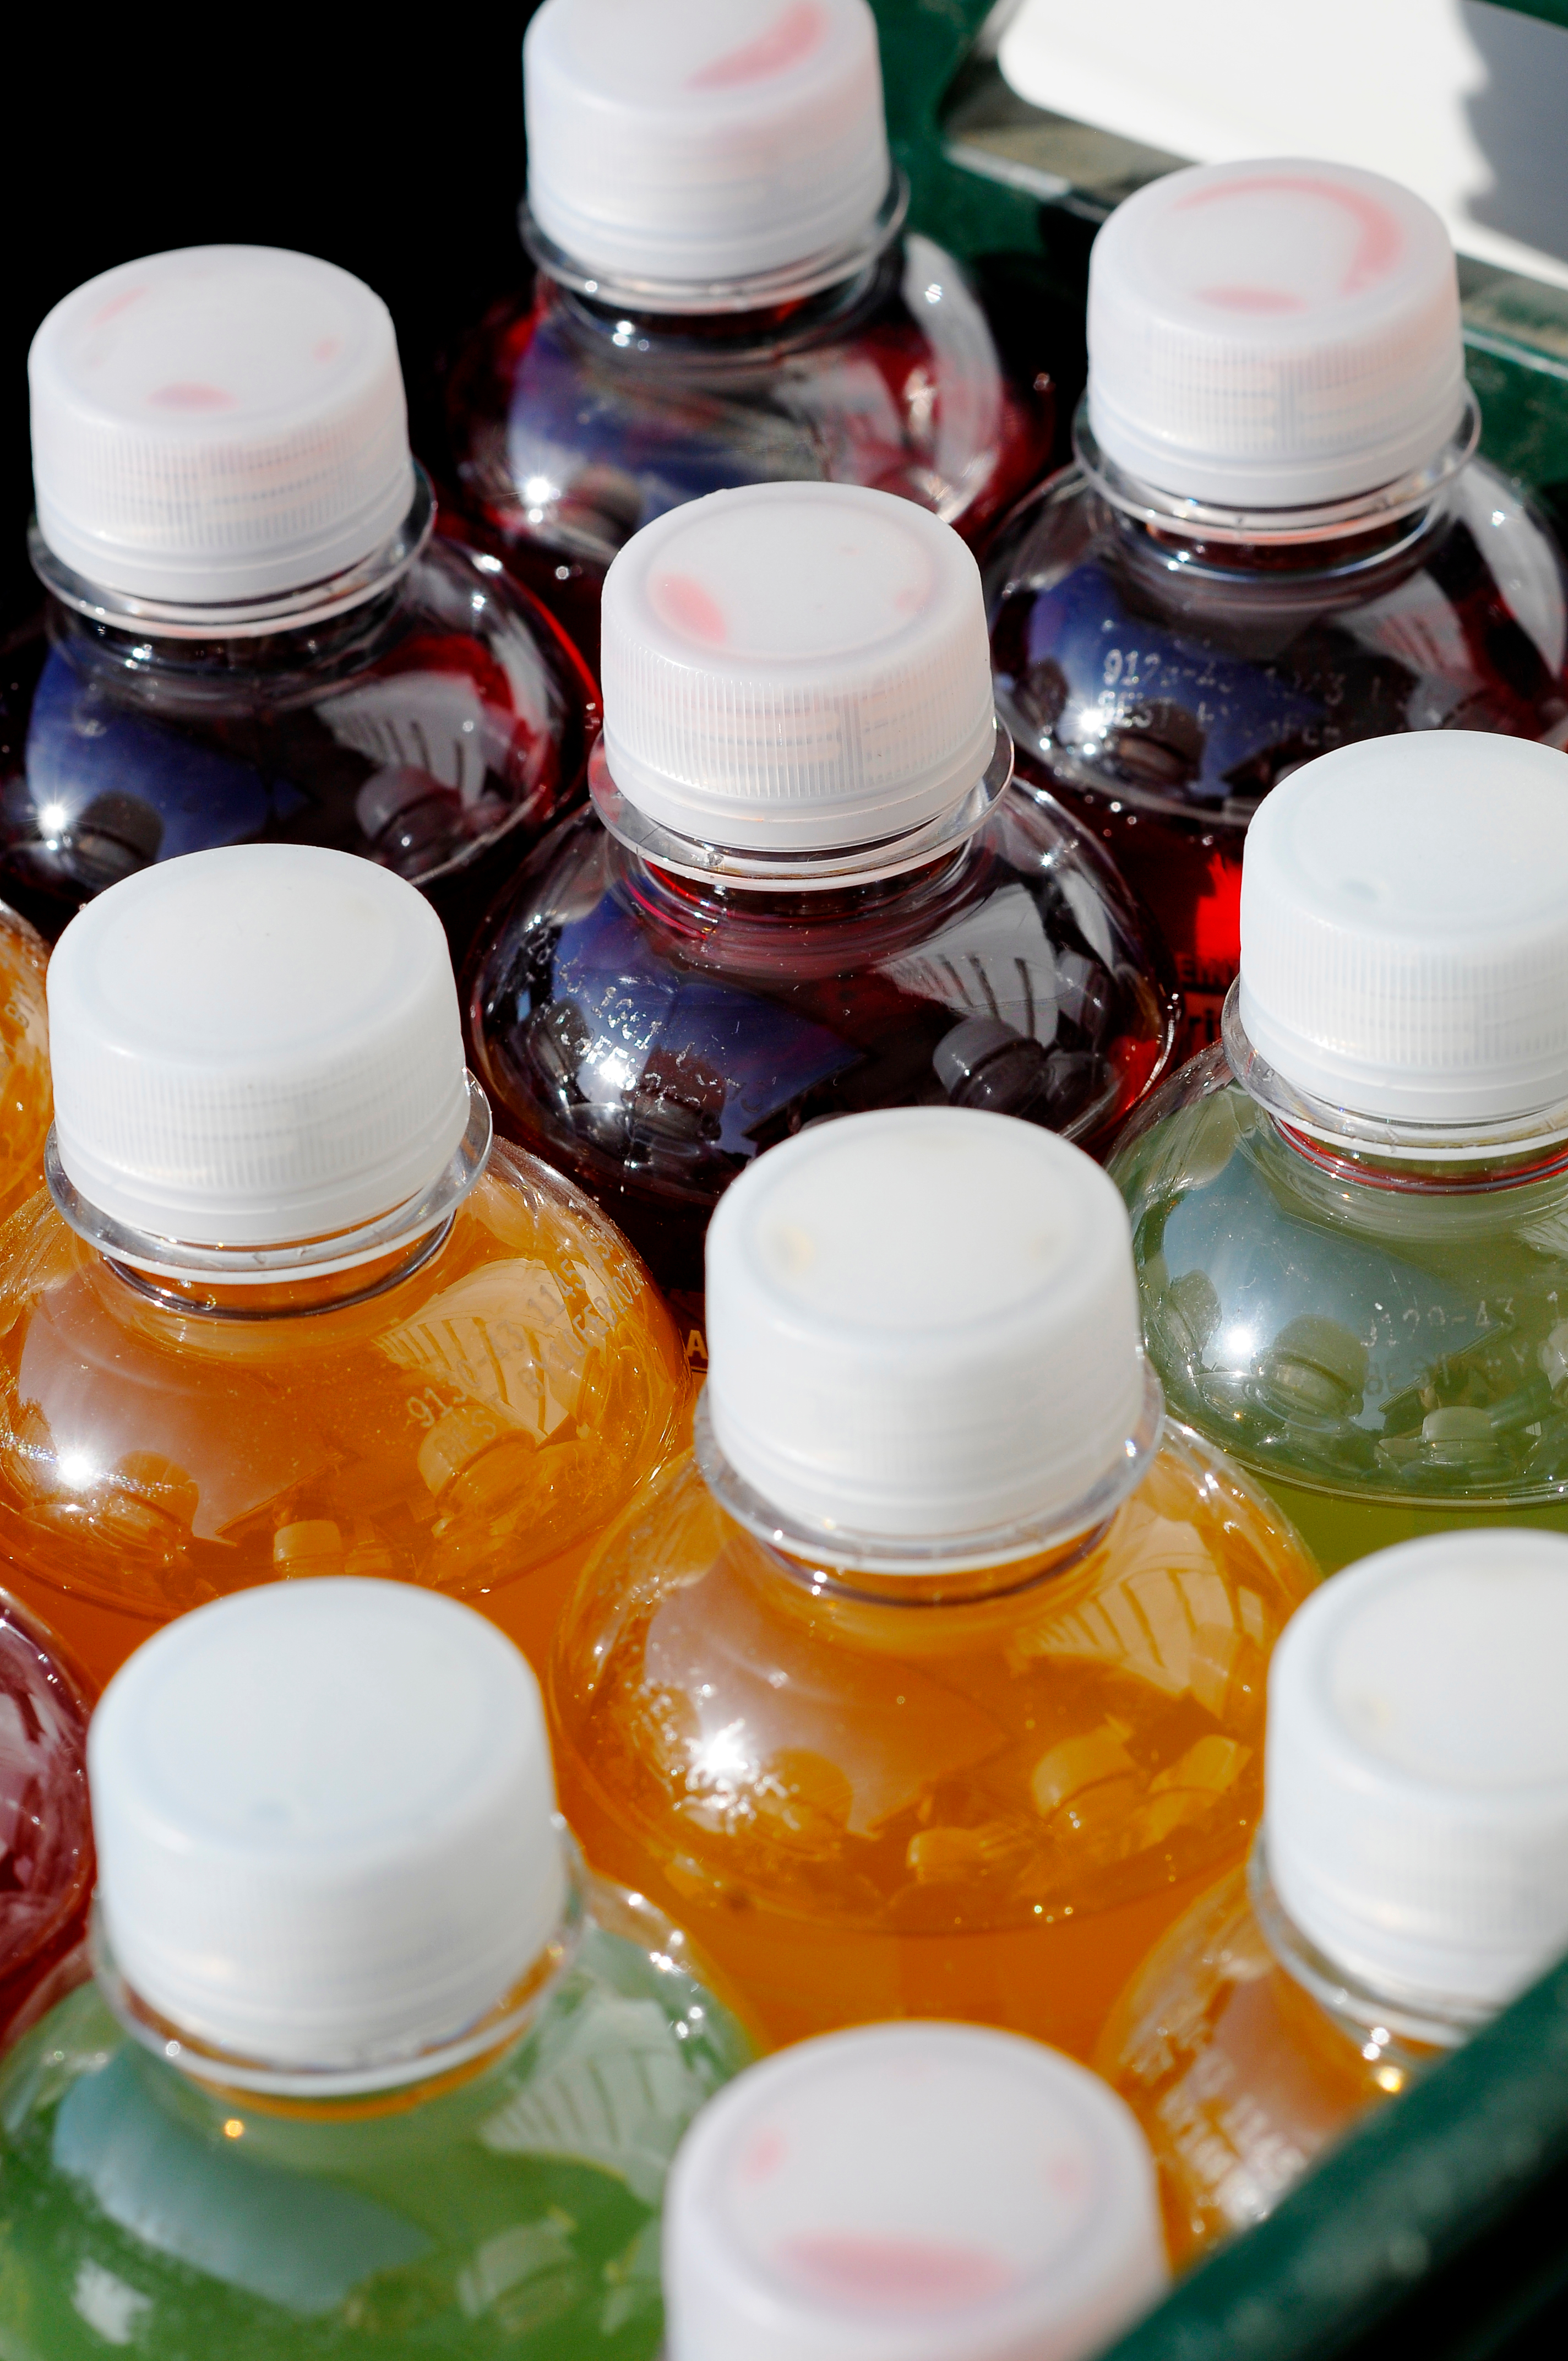
Beverage is a cornerstone category, continually evolving with the flow of culinary trends. Not surprisingly, water and coffee are the beverage of choice for almost all Canadians with near universal penetration.1 Despite consumers closely managing grocery budgets, they continue to make allowances for natural, healthier beverage options. The #1 beverage claim by Canadians is lower/no sugar, followed closely by “made with real ingredients”. Sharing stories about how ingredients are sourced and the people behind them provides an avenue to showcase such attributes and highlight brand authenticity as well as transparency.
This consumer demand has produced innovation focused on hydration, a back-to-basics approach of replenished electrolytes as part of overall healthy living. Building on this functional trend, consumers are seeking clean, quality and “real” ingredients that provide additional nutritional benefits. In response to the GLP-1 phenomenon the inclusion of added protein, macro nutrients and functional botanicals will fuel ongoing innovation.
Source: Mintel Canada, August 2024
Canada: Claims that matter when choosing non-alcoholic beverages to drink, 2024
Low/no sugar Made with "real" ingredients Low calorie Boosts energy Added vitamins Supports digestive health Strengthens immunity Promotes relaxation Added calcium Promotes focus Plant-based
percent of customers
42
32
29
28
22
18
16
12
9
percent of consumers
Water Hybrid/fusion drinks Sparkling water Energy drinks Sports drinks Non-dairy milk Tea Coffee Juice Dairy milk Carbonated soft drinks
More often
The same
Less often
45
31
30
26
25
20
19
53
54
59
49
55
61
63
66
64
68
24
14
15
13
Canada: Drinking beverages more often, the same or less often versus last year, 2024
BACK TO PROTEIN SNACKS
BEVERAGE
For Canadian adults, water, including tap water, is the top choice, with coffee following closely as the second most consumed beverage. Both categories present strong opportunities for innovation due to their widespread popularity, making them solid foundations for new product development.
0%
20%
40%
60%
80%
100%
58
10%
30%
Sources: 1. NielsenIQ, National All Channels, L52W Period Ending July 13, 2024; 2. NielsenIQ Panel On Demand Homescan Data, L52W Period Ending July 13, 2024; 3. Erickson Research, Peanut Bureau of Canada – Canada (2024)
With annual household penetration at 67.8%,2 Canadians continue to consume peanut butter in their diets, perceiving it as a healthy, convenient, on-the-go option that satisfies hunger and provides an energy boost.3 With multiple usage occasions, Canadians continue to use peanut butter as a spread (77%), ingredient in dishes (45%) or even straight out of the jar (28%).3 Peanut Butter continues to offer an affordable solution to evolving consumer needs, making it key for retailers to offer a variety of Brands to meet them.
Peanut Butter continues to be a household staple for Canadians, reaching annual sales of $351 million.1 While the total category has experienced inflationary dollar growth of 6%, tonnage volume has declined slightly by 2%.1 The category is led by Regular (Stabilized) Peanut Butter, accounting for 81% of sales across the category and experiencing dollar growth of 7% vs year ago, while the Natural Peanut Butter segment represents the remaining 19% of total category with annual dollar growth of 2%.1 Creamy Peanut Butter continues to be the preferred Peanut Butter sub-segment of consumers (68%), followed by Crunchy (19%), Light (12%), and Dark Roast (1%).1
Total Dollar Volume and % of Dollar Share
Source: NielsenIQ, National All Channels, L52W Period Ending July 13, 2024 Note: Creamy and Crunchy calculations exclude overlap of Light and Dark Roast Sub-Segments
Creamy
Crunchy
Light
Dark Roast
$236,792,526
$65,125,490
$42,663,009
$5,135,263
67.7%
18.6%
12.2%
1.5%
Peanut Butter Sub-Segments
Source: NielsenIQ, National All Channels, L52W Period Ending July 13, 2024
Total Peanut Butter Dollar Volume
80.6%
$283,176,854
19.4%
$68,026,059
$351,202,913
Natural Peanut Butter
Regular Peanut Butter
Peanut Butter Segments, Dollar Volume and Dollar Share
L52W 2YA
$306,018,347
$330,060,419
57,061,381
60M
40M
20M
0
$350M
$300M
$250M
$200M
$150M
55,771,549
54,421, 861
L52W YA
L52W
$ Volume
Tonn Volume (kg)
Peanut Butter 3-Year Trend
Sources: 1 NielsenIQ, TOTAL National - L52W period ending Aug 17 2024 & Cal-Year 2022 & 2023 2 NielsenIQ, TOTAL National - BMO TOTAL OUTLETS - L52W period ending Jul 27 2024 & Cal-Year 2022 & 2023 3 NielsenIQ, TOTAL National - L52W period ending Aug 17 2024 4 Ipsos FIVE 12ME February 2024 | % Occurrences – Total Food Universe
Pourable Salad Dressings are primarily consumed at meal occasions led by dinner, and routinely used with over 60% consuming it three or more times per week4. Since 2020, household penetration continues to decline as consumers are dissatisfied with the additives and lack of flavour in current offerings, turning to homemade dressings for simpler, customizable ingredients. While salads remain the top host food, consumers are expanding consumption to non-traditional occasions such as dipping with creamy dressings and marinating with vinaigrettes4.
Pourable Salad Dressings (PSD) is a $316MM1 mature category with a +3.4% 2-year CAGR and an average household penetration of 71.7% over the last 2 years2. The category is comprised of two major segments, refrigerated and shelf stable dressings (SSD), where SSD represents two-thirds of the category. In the last 52 weeks, PSD has seen a continued rise in dollar sales vs. prior year while overall product consumption declines (-3.0% pounds vs. last year)3 – this is due to two factors, rise of inflation and growth of premium smaller/restaurant brands.
2024*
*Note: Year to date, August 17, 2024 Source: NielsenIQ, TOTAL National - L52W period ending August 17, 2024 & Cal-Year 2022 & 2023
Dollar Sales ($)
$295,138,383
$315,264,376
$315,666,765
75,146,987
75,104,053
72,856,507
Volume in Pounds (lbs)
80M
70M
75M
$320M
$280M
Dollar Sales Growth But Decline in Pounds Due to Inflation & Premiumization
Importance in Both Shelf Stable & Refrigerated Segments
Shelf-Stable Share
Refrigerated Share
66.3%
33.7%
33.8%
33.5%
*Note: Year to date, August 17, 2024 Source: NielsenIQ, TOTAL National - BMO TOTAL OUTLETS - L52W period ending July 27, 2024 & Cal-Year 2022 & 2023
% of household penetration
2021
74.6%
72.5%
71.8%
70.8%
SALAD DRESSINGS
Sources: 1 Mintel, Dairy & Non-Dairy Milk - Canada – 2023 2 Mintel, Dairy & Non-Dairy Milk - Canada – 2023 3 Mintel, Milk and Non-Dairy Milk US Databook – 2023
Products that highlight high or added protein are especially appealing, as seen with launches that mix plant-based ingredients to boost protein levels and the continued leadership of soy as a plant-based protein.1 Soy, a high-protein plant-based food, considered a complete protein containing all nine essential amino acids, is leading the category with +1.9% $ sales growth in the latest 52 weeks. Plant-based offers reduced sugar and calories compared to dairy-milk, with reduced sugar being a commonly sought after attribute in new product launches.3
Nutritional quality of plant-based beverages is increasingly important, with consumers seeking products that offer added vitamins, minerals, and protein. Shoppers are motivated by the quality and presence of added nutrients and clean ingredient labels, and there is a growing expectation that plant-based drinks should match or exceed the nutritional benefits of dairy milk.1
Source: Nielsen, Marketrack, National Incl. NFLD GB +DR +MM, L52W period ending July 13, 2024.
Source: Nielsen, Marketrack, National Incl. NFLD GB +DR +MM L52W period ending July 13, 2024.
$ Share of Segment
Coconut/Almond 1%
Cashew 3%
Oat 27%
Dairy-Like 2%
Coconut 5%
Soya 15%
Almond 46%
Active Health 20.3%
Rice 1%
2012
2013
2014
2015
2016
2017
2018
2019
2020
L52 2023
Total Plant-Based Beverages
Almond
Oat
Soy
Blends
Dairy-Like
50%
PLANT-BASED BEVERAGES
Price continues to be a driving consideration—both as a motivator for purchase when it decreases and as a barrier when non-dairy options are perceived as too expensive.2
17.1% +1.2% $57,814,991
SOY
4.4% -0.1% $14,857,433
COCONUT
2.25% -0.2% $8,286,012
CASHEW
1.8% -0.2% $6,128,057
DAIRY-LIKE
1.0% +0.4% $3,261,056
ALL OTHER
44.2% -2.4% $149,361,432
ALMOND
28.5% +1.2% $96,404,225
OAT
0.6% 0.0% $1,972,862
RICE
Importance of Segment
Source: NielsenIQ Retail Measurement | CA - DANONE - SOYA & RICE DRINKS | Facts of ALL PLANT-BASED, 9 DA BASE in NATIONAL INCL NFLD GB +DR +MM during Latest 52 Weeks
Sources: 1 Mintel, Identifying New Opportunities for Coffee Creamers – 2025; 2 Nielsen MarketTrack, National Inc NFLD GB +DR +MM, L52W period ending August 9th, 2025; 3 Mintel, Coffee & Coffee Shops – Canada – 2025
Flavoured Coffee Creamers category growth of +8.4% $ sales ranks among the highest growth categories within Refrigerated Dairy, as the total Refrigerated Dairy department posts +4.9% $ growth in the Latest 52 weeks.2 Canadians are highly receptive to new coffee experiences, with a strong interest in flavoured creamers and unique flavour profiles. This openness is particularly pronounced among younger generations, who are more likely to experiment with new products and seek out creative coffee options, including flavoured and plant-based creamers.3
Overall, the growth of Flavoured Coffee Creamers in Canada is propelled by consumer demand for variety, innovation, plant-based and functional options, and the ability to customize the coffee experience, all amplified by urban lifestyles and social media trends.1
Segmentation & Shifting
Traditional
Dairy Cream 49.9%
Coffee Creamers & Flavourings 50.1%
68%
32%
Source: Nielsen, MarketTrack, National Incl. NFLD GB+DR+MM – L52W period ending September 7, 2024
July 2021
June 2022
June 2023
June 2024
28.8%
32.3%
33.1%
33.2%
L52W Growth: +4.7%
L52W Growth: +7.4%
L52W Growth: +3.5%
$391M
$393M
COFFEE CREAMERS
Refrigerated Coffee Creamers which hold a 90.4 $ shr of total creamers, are posting strong growth of +5.7% $ sales, with both Traditional +5.9% $ and Plant Based +5.1% $ sales. Non-refrigerated Coffee Creamers (9.1 $ share) are also finding success in the latest 52 weeks with +27.3% $ growth led by Barista Shelf Stable Creamers, posting gains of +25.2% in the last 52 weeks on increased Total Distrinbution Points (TDP’s) of +25.5% and increasing $ Sales per Point of Distribution (SPPDP) of + 21.9%.2
There is a notable demand for plant-based creamers, especially in provinces like Ontario and British Columbia, where consumers are more likely to prefer dairy alternatives. This trend is influenced by demographic factors, such as a higher population of individuals of Chinese background, who show a strong preference for plant-based options. Newer Canadians, in general, are more interested in plant-based and protein-enriched creamers compared to established Canadians.3
# OF BUYERS
VALUE PER OCCASION
# OF OCCASIONS
5,336,044
5,203,769
51,615,825
48,910,947
$7.88
$7.65
+2.5%
+5.5%
+3.0%
Facts on Coffee Creamers, Flavoured - Canada
Source: NielsenIQ Panel On Demand Homescan | CA - DANONE - COFFEE CREAMERS | 11 Facts of COFFEE CREAMERS - FLAVOURED for Total Outlets in Total Canada during L52W period ending June 9, 2025
L52W ending 6/9/24
L52W ending 6/9/25
Sources: 1 Nielsen MarketTrack, National Inc NFLD GB +DR +MM, L52W period ending August 9th, 2025; 2 Mintel, Yogurt and Yogurt Drinks – Canada – 2024
Yogurt has seen another breakout year in Canada fueled by increasing household penetration, hitting 88.9% in the latest 52 weeks +0.4 pts1 and growing consumer demand. The category has experienced a noticeable shift to premium segments providing value-added and functional benefits. The category is among the fastest growing within Refrigerated Dairy in the latest 52 weeks at +11.5% $’s and +6.0% EQ (equivalized tonnage).1
Rolling 52 w/e June 18, 2022
Source: Nielsen Homescan, National Incl. NFLD GB +DR + MM, rolling 52W period ending June 15, 2024.
88.2%
88.6%
Household Penetration (%)
90%
85%
Household Penetration Rate (Last 3 Years)
Source: Nielsen, National Incl. NFLD GB +DR + MM, L52W period ending September 7, 2024.
Light 4.2%
Indulgent 6.5%
Absolute Change in Sales $
Absolute $ Growth of the Segment
The primary motivation for increasing yogurt consumption among Canadians is the pursuit of a healthier diet. Consumers are seeking yogurts with specific health benefits, such as high protein, digestive health, and immune-boosting properties. Functional benefits and natural ingredients, including real fruit and locally sourced dairy, are especially appealing to health-conscious Canadians.2
Half of Canadian yogurt consumers are willing to pay more for yogurt that offers added health or functional benefits, such as high protein content.2 Younger consumers are driving this willingness to pay for extra benefits including functional health. Nearly half (45%) of Canadian yogurt consumers consider "high in protein" an important health-related factor when choosing yogurt or yogurt drinks. This demand is part of a broader trend where protein is prioritized for its role in supporting muscle health, satiety, weight management, and overall balanced diets.2 The two largest segments within the Yogurt category benefit from these trends with High Protein Yogurt hitting a 39.9 $ share, on +27.4% $ growth and Gut Health holding the #2 spot at 19.2 $ share with +1.8% $ growth.1
YOGURT GREEK INCL SKYR ACTIVE HEALTH KIDS REGULAR INDULGENT LIGHT ORGANIC PLANT-BASED ALL OTHER
113,720,886
164,727,754
14,674,871
1,655,685
12,285,629
17,883,297
-172,725
2,503,865
-281,161
2,457,408
Regular 15.8%
Kids 13.8%
Greek Including SKYR 34.5%
Plant Based 2.0%
Organic 2.5%
Other <1%
Rolling 52 w/e June 17, 2023
Rolling 52 w/e June 15, 2024
YOGURT
EVERYDAY NUTRITION
GUT HEALTH
INDULGENCE
KIDS
PLANT BASED
PROTEIN
Importance and $ Growth by Segment
$440,535,099 +$17,555,354
$415,636,943 +$5,060,992
$879,434,157 +$188,874,624
$41,571,901 +$2,725,506
$267,397,795 -$3,398,289
$140,144,976 +$15,642,365
40.9%
20.2%
19.0%
6.4%
1.9%
Source: NielsenIQ Retail Measurement | CA - DANONE - YOGURT | 3 Facts of ALL YOG, 8 DA SEGMENT in NATIONAL INCL NFLD GB +DR +MM during L52W period ending September 23, 2025
Sources: 1 NielsenIQ - NATIONAL EXCL NFLD GB +DR +MM - L52W Period Ending May 31, 2025 2 NielsenIQ – National All Channels - L52W Period Ending May 31, 2025
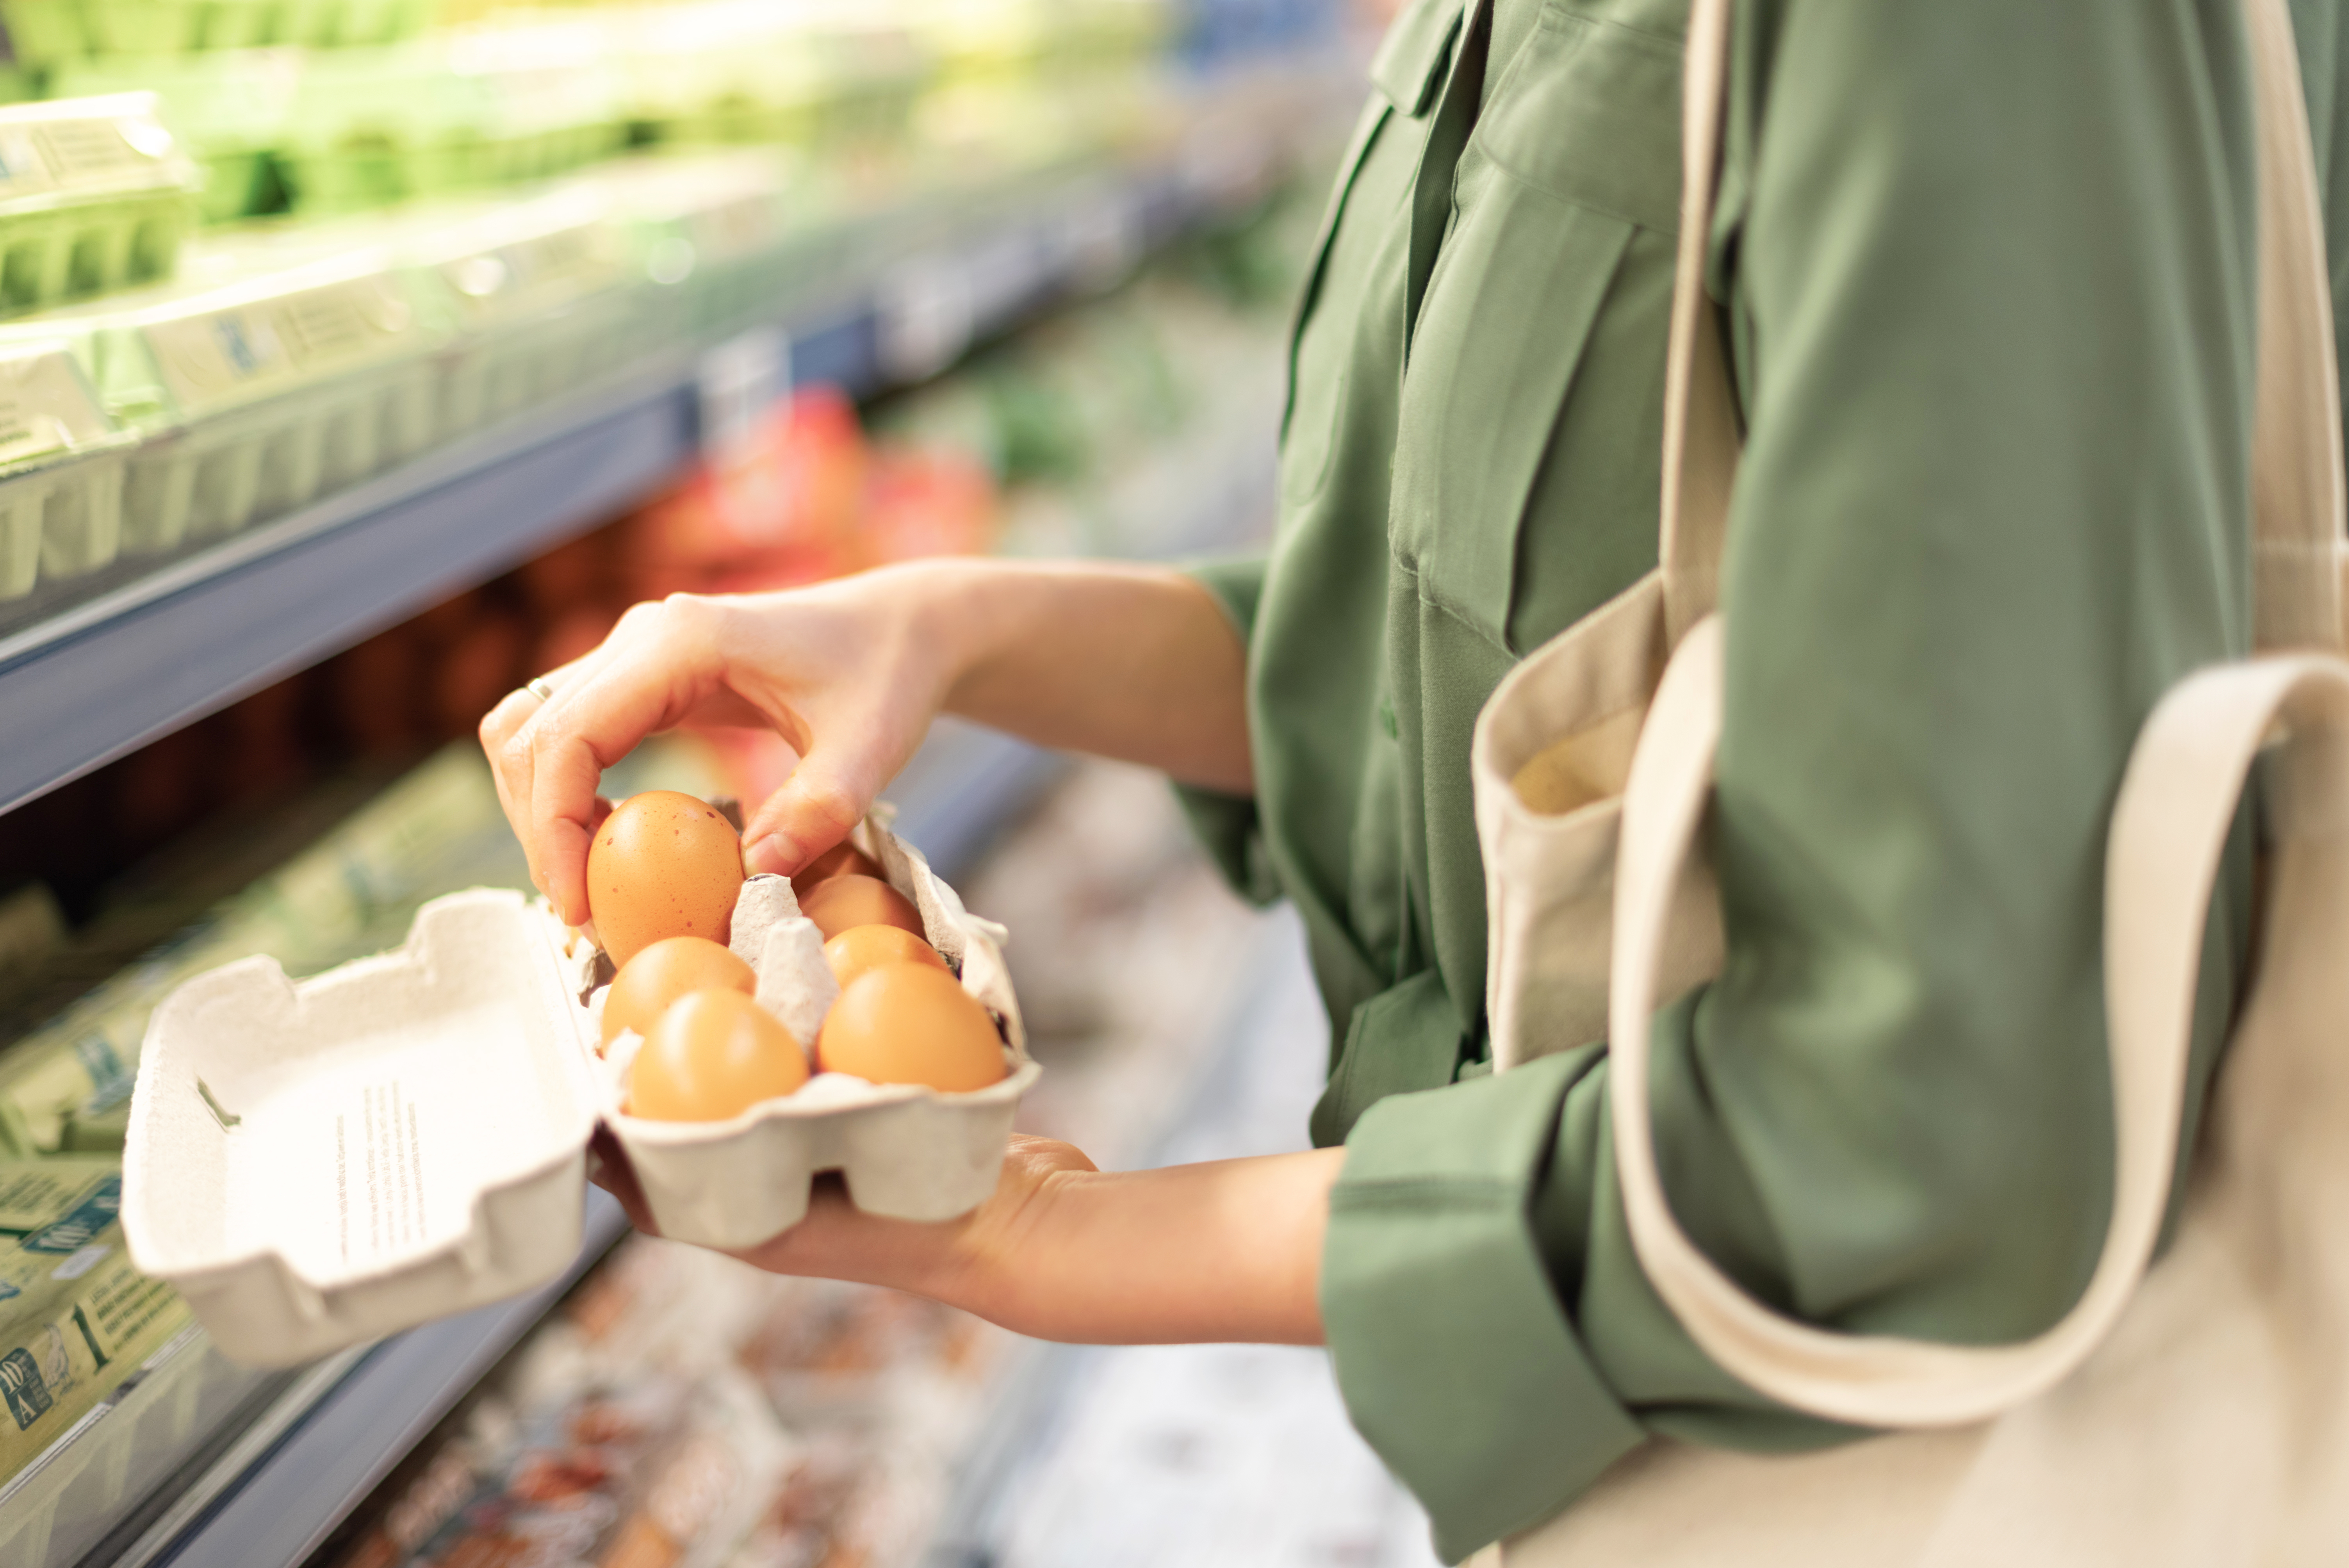
The Canadian egg market including shelled, hard-boiled, liquid, and liquid replacement products represents a $1.6 billion category in Canada.¹ Although shelled egg growth is the largest driver of egg performance, all forms of eggs such as hard-boiled and liquid eggs both grew +8% in dollars vs YA. (Figure 1)
Source: NielsenIQ - NATIONAL EXCL NFLD GB +DR +MM - L52W Period Ending May 31, 2025
Figure 3: Tonne Equivalent % Change
Source NielsenIQ – National All Channels - L52W Period Ending May 31, 2025
Figure 2: Total Eggs
Total Population
Figure 1: $ % Change vs. YA
BREAKFAST
Pickled
8%
1%
Liquid & Replacement Eggs
Shelled
PT. Chg. vs. 2022
+1.0
+0.6
-0.2
-1.4
% Chge
Pt. Chg. v. 2022
+0.3 -0.7 +1.1 +0.2 -0.6 -0.4 +0.2 +1.0 -0.6 -0.5 +0.7 0.0 -0.1 +0.5 -0.1
32% 25% 25% 19% 15% 12% 10% 8% 8% 7% 4% 4% 3% 3% 3%
6's
+0.5 -2.4 -3.1 +0.3 -2.3 +0.4 +1.0 +0.7 +0.5 -0.3 0.0 +0.4 +0.1 +0.1 +0.1
46% 14% 12% 2% 13% 12% 8% 7% 4% 2% 2% 1% 1% 1% 0.3%
EGGS
Shelled eggs has a wide consumer appeal as evidenced by over 92% of Canadian households purchasing a shelled egg product. 2 Despite being a mature sector, which typically experiences limited expansion, the category has shown significant growth of +$139MM or +9.5% vs last year. This trend is driven by shoppers increasing their amount spent on eggs by an average of 6.6% on each shopping trip. (Figure 2)
It's not just revenue that’s growing in the category. Canadian consumption of eggs has increased as tonnage (dozens) is up by 4%. Consumers are clearly moving to larger sizes as both 24 packs and 30 packs have grown tonnage by 37% and 33% respectively. Contrast that by declines in 6’s and 12’s at -15% and -5%. (Figure 3)
Another consistent trend in the category is the growth of specialty eggs. Conventional eggs have grown tonnage by +3% where specialty eggs grew +6% driven by all segments. (Free run +20%, Free range +9%, Omega +8%, Organic 12%) ¹
Unlike most categories, local / provincial brands are important and represent a sizable share of category dollars. Local / Regional egg brands represent a 29.9 dollar share of the shelled eggs category and are growing +9.9% vs nationally branded eggs which represent 12.1 share of dollars and growing at 2.6%. (Figure 4)
Figure 4: Dollar Share
Total Shelled Eggs
% Chge in Buyers
% Chge in $'s Buyer
% Chge in $'s Trip
% Chge in Trips/Buyer
12.1%
1.8%
10.1%
6.6%
-3.2%
8's
12's
18's
24's
30's
All Others
-15%
-5%
37%
33%
-38%
Regionally Branded Eggs
Nationally Branded Eggs
C/L Eggs
100
29.9
12.1
57.9
9.5%
9.9%
2.6%
10.9%
% $ Chg
Sources: 1. Shopper Intelligence, Coffee Category Decision Factors Importance, 12 months ending Q1, 2024. 2. Mintel, The Sustainable Consumer, Canada, December 2023. 3. Coffee Association of Canada, Coffee drinking trends, (n=1,503), December 2023.
The Coffee category has seen continued value growth over the past year, fueled by the rising demand for instant coffee, espresso capsules, and ready-to-drink beverages across grocery stores, drugstores, and mass merchandisers. While traditional coffee and K-Cup® pods remain key stable segments, meeting consumer needs for innovation1, sustainability2, and affordability1 is critical for driving further expansion. Over the last 52 weeks, larger K-Cup® pod formats have gained popularity as consumers navigate economic pressures and tighter budgets. The latest Coffee Association of Canada study reveals that many are stocking up on coffee to manage inflation3. Highlighting sustainability and promoting value-driven messaging will help unlock additional growth opportunities.
Source: 2023 Q4 Shopper Intelligence Grocery Survey, Decision factor importance rank 1 to 10
Rising Influence of Younger Coffee Drinkers (16-34 yrs.)
Source: Coffee Association of Canada, Coffee drinking trends, (n=1,503), December 2023
Coffee Shopper Behaviours
Source: Nielsen NATIONAL EX NFLD GB +DR +MM, L52W period ending June 15 2024, Espresso Caps are compatible Nespresso capsules sold at retail.
Coffee Annual Value
COFFEE
Coffee Disc
$563M
$500M
$73M
$35M
Espresso caps
K-Cup Pods
Traditional Ground
$168M
$233M
$81M
Total Coffee Annual Value $2,661M / +6%
Traditional Beans
Instant
Ready to Drink Coffee
This group is more likely to make unplanned purchases, with
of them indulging in spontaneous buys.
21%
61%
of consumers are stocking up on at-home coffee when it's on sale
of consumers started buying larger packages of at-home coffee to save money
42%
+0%
+39%
-17%
-2%
+2%
+7%
+6%
Sources: 1. Nielsen: Category Performance, National incl NFLD all channels, PE June 14, 2025, units per person = Total Frozen units / Canadian Population (41.8 MM) 2. IPSOS Canada Chats 2025, December 2024; 3. IPSOS Canada 5W, 5YR ending June 2025. Younger Generations = Gen Alpha, Gen Z, Millennials
Despite ongoing economic pressures and changing routines, Canada’s frozen food category continues to show remarkable resilience. In the latest 52 weeks, total tracked frozen food sales surpassed $8.8 billion, with per capita consumption climbing to 32 units per person per year1.
Source: Mintel, May 2025
Top 10 Frozen Motivations
Source: IPSOS FIVE R12ME August 2024 – % Food /Commercial Beverage Occasions; IPSOS Canada Chats, 2025, December 2024
Where Food is Sourced From
Source: Nielsen: Category Performance, National incl NFLD all channels L52W period ending June 14, 2025
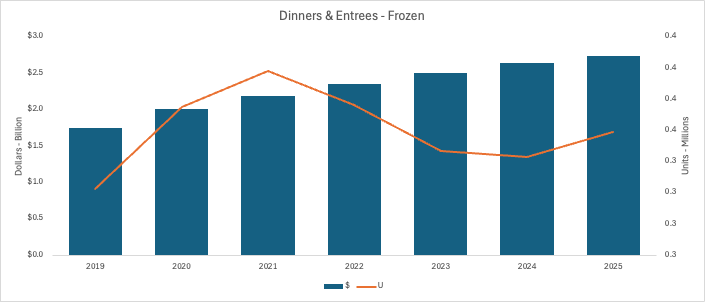
Dinner & Entrees – Frozen
Frozen dinners and entrées, the category’s largest segment, has surged with a 7.7% dollar CAGR, now reaching $2.7 billion in sales. In the latest 52 weeks sales rose +2.3% reflecting strong consumer demand for convenient, high-quality meals1.
A major driver is the shift in where meals are sourced. Retail accounts for over 84% of eating occasions, similar levels seen during the pandemic in 20202. While a 1% increase from 2023 may seem minor, it reflects a meaningful return to at-home dining. Frozen foods are well-positioned to meet this shift, offering value, convenience, and versatility—consistently cited as top purchase drivers3.
With overall frozen food sales and units rising, families with kids (43% of frozen occasions), multicultural households (27%), and younger generations (49%) remain key contributors to category strength, together accounting for a major share of frozen food occasions3.
Innovation is also driving excitement, with globally inspired meals and better-for-you options expanding the aisles. In fact, 24% of food occasions are motivated by a desire for healthy or nutritious choices2. Both Gen Z and Millennials tend to opt for more multiculturally-inspired dishes, underlining the appetite for exploratory taste preferences and cuisines2.
As Canadians continue to balance busy schedules and evolving tastes, frozen foods are set to remain a trusted staple in households from coast to coast.
FROZEN FOODS
Easy to prepare/little or no planning Satisfies my hunger Wanted something tasty Comforting Good value for the money Satisfies a craving Could be eaten quickly Wanted something all the household members... Good to share with friends/family Could be made with items on-hand
34%
27%
25%
23%
19%
18%
Sourced from Retail
Sourced from Foodservice/AO
70%
81%
84%
86%
83%
16%
14%
17%
Dollars - Billions
Units -Millions
$3.0
$2.5
$2.0
$1.5
$1.0
$0.5
0.4
0.3
$
Units
Sources: 1. Mintel Canada, May 2025 2. Nielsen, Exact Weight + Random Weight, NATIONAL EX NFLD GB +DR +MM L52W period ending July 26, 2025
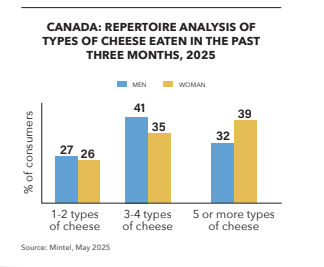
Underscoring its central role in Canadian diets, not only is Cheese consumed by 94% of households but the category continues to show strong growth year over year.1 In total, the category represents $3.7bn, with Exact Weight cheese representing a 94% share.2 Exact Weight, also known as Prepack, is growing +4% in dollars and +2% in volume.2 At least 2/3 of consumers have eaten at least 3 types of different cheese in the last 3 months, confirming that at-home deli drawers hold multiple varieties – and consumers are willing to add additional staples to their rotation.1
Source: Nielsen, Exact Weight, NATIONAL EX NFLD GB +DR +MM during L52W period ending July 26, 2025
Exact Weight, Dollars
Exact Weight – Top 8 Specialty Segments
Specialty cheese is the largest segment, representing 1/3 of the category. Specialty cheese is continuing to show robust growth of +9% in dollars and volume – an indicator that, despite consumers watching grocery prices, there is still significant demand for this segment.2 The top cheese specialty cheese types are Feta, Cheddar and Paneer – a clear reflection of Canada’s evolving demographic.
CHEESE
FETA CHEDDAR PANEER MOZZARELLA & BURRATA SPREADABLE BLOOMY/WASHED RIND PARMESAN GOUDA & EDAM
$111,655,469 $86,464,612 $69,188,378 $68,673,482 $66,093,072 $62,736,700 $45,623,403 $33,090,174
4% 10% 18% 8% 7% 7% 4% 15%
13,831,969 9,068,832 13,068,234 8,739,591 10,356,199 7,947,178 5,666,424 4,325,640
4% 7% 21% 8% 4% 8% 0% 15%
DOLLARS
DOLLARS CHANGE
UNITS
UNITS CHANGE
SPECIALTY
31%
13%
7%
BLOCK
SNACKING
SHREDDED
SLICES
SPREADABLE
DEHYDRATED
Canada: Repertoire analysis of types of cheese eaten in the past three months, 2025
% of consumers
1-2 types of cheese
3-4 types of cheese
5 or more types of cheese
Men
Women
27
41
35
39
Sources: 1. NielsenIQ - National EXCL NFLD GB +DR +MM - L52W Period Ending May 18, 2024 2. NielsenIQ – National All Channels - L52W Period Ending May 18, 2024
In Canada, Eggs in all forms (Shelled, hard boiled, liquid and liquid replacement eggs) is a $1.5B dollar category1. Mature categories rarely generate significant growth yet Canadian consumers have increased total Egg sales by $111.8MM (+8%) vs the same time last year. The value added segments are also contributing to total egg growth (Figure 1).
Source NielsenIQ - National EXCL NFLD GB +DR +MM - L52W Period Ending May 18, 2024
Figure 3 - Average Unit Price
Source: NielsenIQ - National GB+D+MM L52W Period Ending June 29,2024
Figure 2 - $ Sales, $ Share and $% Change
Source: NielsenIQ - National EXCL NFLD GB +DR +MM - L52W Period Ending May 18, 2024
Figure 1 - $ % Chg vs YA
More households are purchasing Shelled Eggs (buyers +2%) and those households who purchased last year are spending more ($’s per HHLD +5.8%).2 (see Figure 4) This trend isn’t surprising as consumers are looking to larger pack sizes in the category to find value. Both 18 Packs (+13%) and 30 Packs (+33%) have increased their share of Eggs significantly versus a year ago.1
Shelled Eggs are the largest segment accounting for 97% of total Egg sales and growing +8%.1 From coast to coast, Shelled Eggs are generating more revenue for retailers. (see Figure 2) It is important to understand segment development for the east vs west to address regional consumer demands.
Although Conventional Eggs (no additional claims) make up the largest share of Shelled Eggs (76.8 dollar share & +9%), Specialty Eggs have been growing significantly as well (23.2 dollar share & +6%).1 Free Run Eggs have been a primary driver of Specialty Eggs growing +14% vs year ago.1 This trend is positive for building bigger baskets in the category as Specialty Eggs retail at a higher price per unit vs Conventional Eggs. (see Figure 3) Optimizing the category requires keeping up with trends on larger packages while offering a strong range of specialty products.
Source NielsenIQ – Homescan - National All Channels - L52W Period Ending May 18 2024
Figure 4 - Shelled Eggs