An Interactive Industry Leadership Report from
CATEGORY
CAPTAINS
2025
Candy & Novelties
Beer
Ready-to-Drink (RTD)
Dry Packaged Dinners
Fresh & Deli
Frozen Foods
Peanut Butter
Protein Snacks
Plant-Based
Specialty Foods
Cold Beverages (NARTD)
Yogurt
TABLE OF CONTENTS
CHECK BACK FOR MORE CATEGORIES ADDED MONTHLY
PROTEIN SNACKS Captain: Jack Link's Canada
SPECIAL PROMOTIONAL FEATURE
CANDY & NOVELTIES Captain: Regal Confections
BEER Captain: MolsonCoors
READY-TO-DRINK Captain: MolsonCoors
COLD BEVERAGES Captain: Coca-Cola Canada
Established Items
PROTEIN SNACKS
2024 CATEGORY CAPTAINS
KEY CATEGORY INFORMATION
CATEGORY DATA
Sources: 1 SimplyProtein/Maru Public Opinion online panel survey, February 8, 2023; 2 Mintel, Future of Animal Proteins, 2024; 3 Canadian Grocer GroceryIQ Study, 2024; 4 Nielsen MarketTrack. National C&G. 52 weeks to Feb. 2024. Total Meat Snacks
Source: 4 SimplyProtein/Maru Public Opinion online panel survey, February 8, 2023; 5 Convenience News article, Shifting Consumer Behaviour, May 2024
2024 CATEGORY CAPTAIN
Within the Protein Snack category, meat snacks have continued to demonstrate consistent year-over-year growth in Canada, fueled by consumers' desire to ensure they are getting enough protein in their diet.
Meat Snacks encompass more than just Beef Jerky. There are many varieties of protein snacks available in the market today that offer choice in protein type, flavour, and format (jerky; meat sticks; tender bites; steaks; and more).
Although consumers face mounting expenses, they prioritize categories offering potential long-term health benefits.
Protein is considered the most important nutrient, and most Canadians think of meat as the main source of protein.
Canadians are turning to snacks with protein in their quest for healthier food options.4
Canadians are turning to snacks with protein in their quest for healthier food options.
46% of Canadian consumers agree they can't get enough protein without eating animal meat.2
At the same time, there continue to be additional varieties of protein snacks available in the market today that offer shoppers choice in protein type, flavour, and format (jerky; meat sticks; tender bites; steaks; and more).
Trends in product innovation, coupled with consumers’ focus on prioritizing nutritional snacking, will continue to fuel the growth of Meat Snacks in Canada.
Meat Snacks Continue to Attract New Shoppers
More Buyers
Source: Nielsen Homescan. Market Summary. 52 weeks to Feb. 2024. Total Outlets. Total Meat Snacks
Frozen Food
Personal Care
Bread
Canned Tomatoes
Coffee
Coffee Creamers
1
2
The Jerky segment delivers more that 50% of category share, making it a critical lever for driving basket size and profit growth.4
Canadians are turning to snacks with protein in their quest for healthier food options.1
When considering snacks at the store, most consumers cite protein as the most important nutritional attribute they seek.5
Meat Snacks attracted +200,000 additional Canadian households to purchase the category in 2023. Shoppers are spending more and putting Meat Snacks in their basket more often.
Meat Snack Segments – Jerky is a Critical Lever in the Category
Jerky & Nuggets
With >50% of category sales volume, growth of Jerky + Nuggets formats is critical to success of the category.
Jerky items have a higher ring resulting in increased basket sizes and increased dollar profit.
Jerky is the anchor of the Meat Snacks section. Retailers must win with Jerky, while leveraging growth and breadth of consumer reach that the additional protein formats and flavours provide.
51%
11%
7%
Meat Sticks
31%
Meat & Cheese Combos
Steaks & Bars
Source: Nielsen MarketTrack. National C&G. 52 weeks to Feb. 2024. Total Meat Snacks
More $ Per Buyer
More Trips Per Buyer
3.4 Million Households
+200,000
BACK TO HOME PAGE
Nearly 1 in 4 health conscious grocery store shoppers indicated that they are interested in the protein content of the foods they purchase.3
Source: Convenience Store News Canada - C-StoreIQ 2024
2025 CATEGORY CAPTAIN
Candy remains one of the most reliable traffic and impulse drivers in convenience stores, delivering moments of joy, comfort, and connection. Shoppers continue to make candy and gum part of their everyday routines, with convenience stores standing out as a preferred destination for these small but meaningful indulgences.
Shoppers Monthly Purchasing at a C-store
In a typical month, 47% of all shoppers purchase at a c-store, the most common outlet when compared to other store types like grocery, mass, dollar and discount grocery.
Purchases of Candy/Gum in a Typical Month
Yes
Overall, 90% of shoppers purchase candy/gum in a typical month across all store types.
90%
10%
2023
The appetite for candy and novelty items is not slowing down. Many are buying these items as much, or more frequently, than before, as the category continues to satisfy a growing desire for affordable indulgence. Younger consumers in particular are driving this uptick, seeking both nostalgia and novelty: a balance between classic comfort flavours and bold new product experiences.
Frequency of Candy or Gum Purchases at C-Stores
Most shoppers (77%) are buying candy or gum as often or more often than last year, with 16% increasing their purchase frequency.
Candy and Gum Pair Well
Candy pairs well with foodservice as one in five (21%) shoppers who purchased prepared foods also bought a candy/gum item, making it the second most popular add-on, outranking bottled beverages and salty snacks, and second only to lottery tickets.
2024
32%
35%
No
42%
27%
Top Reasons for Impulse Purchases at Convenience Stores
Treat Myself
On Sale
Seeking New Products
When it comes to new products in c-stores, 11% of shoppers specifically seek candy, making it the second most popular choice behind chips. Looking at candy and chocolate together, nearly one in five shoppers (19%) are interested.
$160,000,000
3
4
5
A Growing Trend: Over One Third of Canada Convenience Store Shoppers Bought Candy in the Previous Month
In 2024, 35% of Canada convenience store shoppers purchased candy in the previous month, a significant increase vs. 2023 (32%).
Vast Majority of Canada shoppers Buy candy or gum
90% of Canada shoppers report purchasing a candy or gum product in a typical month.
Nearly three in five shoppers (59%) regularly make unplanned or impulse purchases at convenience stores, with the leading motivation being ‘to treat myself’ (43%), followed by taking advantage of a sale or promotion (27%), highlighting how powerful the ‘treat’ factor is.
Source: Convenience Store News Canada, C-Store IQ 2025
Source: Convenience Store News Canada - C-StoreIQ 2025
Sources: Convenience Store News Canada - C-StoreIQ 2024; NeilsonIQ, week ending May 18, 2024.
CANDY & NOVELTIES
2025 CATEGORY CAPTAINS
Candy holds a unique position as a natural complement to other purchases. Whether paired with prepared foods, beverages, or other quick treats, it remains one of the most common add-ons at checkout, underscoring its role as a spontaneous, feel-good choice.
Shoppers are showing stronger curiosity toward candy innovations as well. Candy and chocolate consistently rank among the most sought-after new product types in the convenience channel.
Looking ahead to 2026, candy’s future is set to stay bright, anchored by emotional connection, driven by innovation, and powered by consumers that continue to celebrate the fun, flavour, and comfort candy brings to everyday life.
Younger shoppers are driving candy sales at convenience stores: Millennials (51%), Gen X (49%), and Gen Z (47%) are significantly more likely than Boomers (39%) to purchase candy or gum.
Why Canada Convenience Shoppers Make Impulse Purchases
43%
6
MILLENIALS
GEN X
GEN Z
BOOMERS
49%
47%
39%
DO YOU BUY CANDY OR GUM AT A C-STORE?
4TH
2ND
1ST
3RD
19%
+
16%
61%
23%
77% as often or more
COLD BEVERAGES
BEER
While Beer has been accessible in other provinces for years, Beer is officially here in convenience stores in Ontario, starting September 5, 2024.
Beer has the highest penetration in Total Beverage Alcohol
Ready to Drink (RTD)
Above Premium Beers Trending Upwards
SEGMENT SHARE OF MARKET - TOTAL BEER - NATIONAL
Source: BAC Beer Canada Market Share Data (Beer only), January 2019 - June 2024
Source: IPSOS ACT CANADA
Canadians are seeking for a healthier lifestyle. In the Beer category, total beer volume has declined year over year, however the category has seen a surge in lighter options. The Above Premium segment continues to grow, lead by shoppers searching for these alternatives. In total beverage alcohol, beer remains the highest household penetration rate amongst cider, coolers, wine, and spirits. Along with penetration rate, Beer in 2024 has on average the highest servings per drinker.
Shoppers stopping into convenience stores to purchase beer typically also buy cigarettes, chips, soft drinks, and energy drinks. Beer becomes a destination for convenience stores, with each basket per trip including beer is 20% higher than the average convenience store without beer.
Craft Beer
2019
2020
2021
2022
50%
40%
30%
20%
0%
41%
38%
37%
22%
24%
25%
26%
21%
13%
12%
14%
Value Beer
Premium Beer
Above Premium Beer
Total Beverage Alcohol Beer Cider Total Cooler/PMC incl. Selzter (NET) Wine (NET) Spirits (NET)
2017 100% 68% 11% 16% 65% 51%
2018 100% 70% 11% 17% 65% 55%
2019 100% 67% 11% 16% 63% 53%
2020 100% 65% 11% 19% 62% 53%
2021 100% 63% 11% 22% 62% 53%
2022 100% 66% 9% 24% 61% 53%
2023 100% 65% 11% 24% 58% 53%
2018
68%
2017
70%
67%
65%
63%
66%
Beer Penetration
Beer has the highest servings per drinker Total Beverage Alcohol
Average Servings
Total Beverage Alcohol Beer Cider Total Cooler/PMC incl. Seltzer (NET) Wine (NET) Spirits (NET)
2017 22.4 14.3 3.6 4.3 10.8 8.9
2018 23.7 14.5 3.6 4.6 11.2 9.1
2019 21.5 12.9 3.6 4.8 11.3 8.7
2020 22.0 13.2 4.0 5.4 11.6 8.9
2021 21.6 13.0 3.9 5.6 11.3 8.9
2022 21.7 13.3 3.8 5.5 11.0 8.6
2023 21.1 14.0 3.2 4.8 10.8 7.8
13.2
13.0
14.3
14.5
12.9
14.0
13.3
15
14
13
12
beer is declining in volume, but premiumizing
READY-TO-DRINK (RTD)
The RTD category continues to grow in volume year over year. Similar to Beer, more and more Canadians are seeking for healthier options, turning to Ready-To-Drink beverages. Now that the RTD segment has existed for a few years, Seltzers/Soda make up 38% of the RTD category, with coolers, Iced Teas, Cocktails, Caesars, and all others, making up the rest of the category.
Seltzers comprise the greatest proportion of RTDs, but have declined recently in proportion of total, while Cocktails and Iced Teas have increased their proportion of RTDs
Total RTD volume is growing
Volume In HL
Source: ACD (Association of Canadian Distillers), Beer Canada Market Share Data, Provincial Point-of Sale Data Sources
While Seltzers/Soda comprise the greatest proportion of RTDs, it has recently declined slightly in proportion of the total, while Cocktails and Iced Teas are increasing their proportion of RTDs. The category has also seen 8% growth in household penetration from 2019 to 2024 from 16% to 24%.
4,000,000
3,500,000
3,000,000
2,500,000
2,000,000
500,000
RTD penetration has seen growth since 2019
RTD Penetration
Total Cooler/PMC incl. Seltzer (NET)
2017 16
2018 17
2019 16
2020 19
2021 22
2022 24
2023 24
17%
25
20
10
1,500,000
2,186,943
2,991,728
3,613,546
3,559,334
3,613,637
CAGR 2019 to 2023:
CAGR 2020 to 2023:
+13.4%
+6.5%
% of Total RTD
Cocktail (without Seltzer/Soda)
Iced Tea
Seltzer/Soda
Cooler
All Other
Caesar
Penetration (% Drinkers)
NON-ALCOHOLIC READY-TO-DRINK (NARTD)
Meat Snacks attracted +200,000 additional Canadian households to purchase the category in 2023.
Shoppers are spending more and putting Meat Snacks in their basket more often.
Non-Alcoholic Beverages are an important and dynamic part of the convenience and gas landscape. Delivering sustainable dollar growth +3% (L52w), beverages have exceeded the total channel performance of -1% over the same period. Coke Canada has been able to lead beverage growth, overdelivering share of the channel with 67% of the total beverage growth. Accomplishing this requires balancing the need to keep perennial favorites in stock daily while adding meaningful innovation to generate excitement and expand consumption. With a consumer centric mindset, beverages have been able to deliver value in the eyes of shoppers, which in turn created sustainable growth for retailers.
Source: NielsenIQ, MarketTrack; National Convenience & Gas Banners; Beverage $ Vol & Abs $ Chg, YTD to Aug 9, 2025
Top SKUs Drive Sales and Growth
Source: NielsenIQ, MarketTrack; National Convenience & Gas Banners; Beverage $ Share & $ % Chg, YTD to Aug 9, 2025. Innovation = SKUs with no sales in PY or over +150% increase in sales and +75% increase in Distribution VYA. Exit = Items with a reduction in Distribution by -50% or more VYA
Beverage Growth Requires Balancing Core Availability and Variety
SKU Status Contribution Nat'l C&G YTD to Aug 9, 2025
Source: C-Store IQ 2025
Sustaining SKUs make up over 85% of all Beverage sales and contribute to growth – ensuring in-stocks of key SKUs drives is critical to drive a Positive Experience. Innovation drives $92.1MM in growth for the channel YTD adds to the Product Variety perception.
Top Descriptors of POSITIVE Experience
$ Volume Growth (Nat'l C&G YTD to Aug 9, 2025)
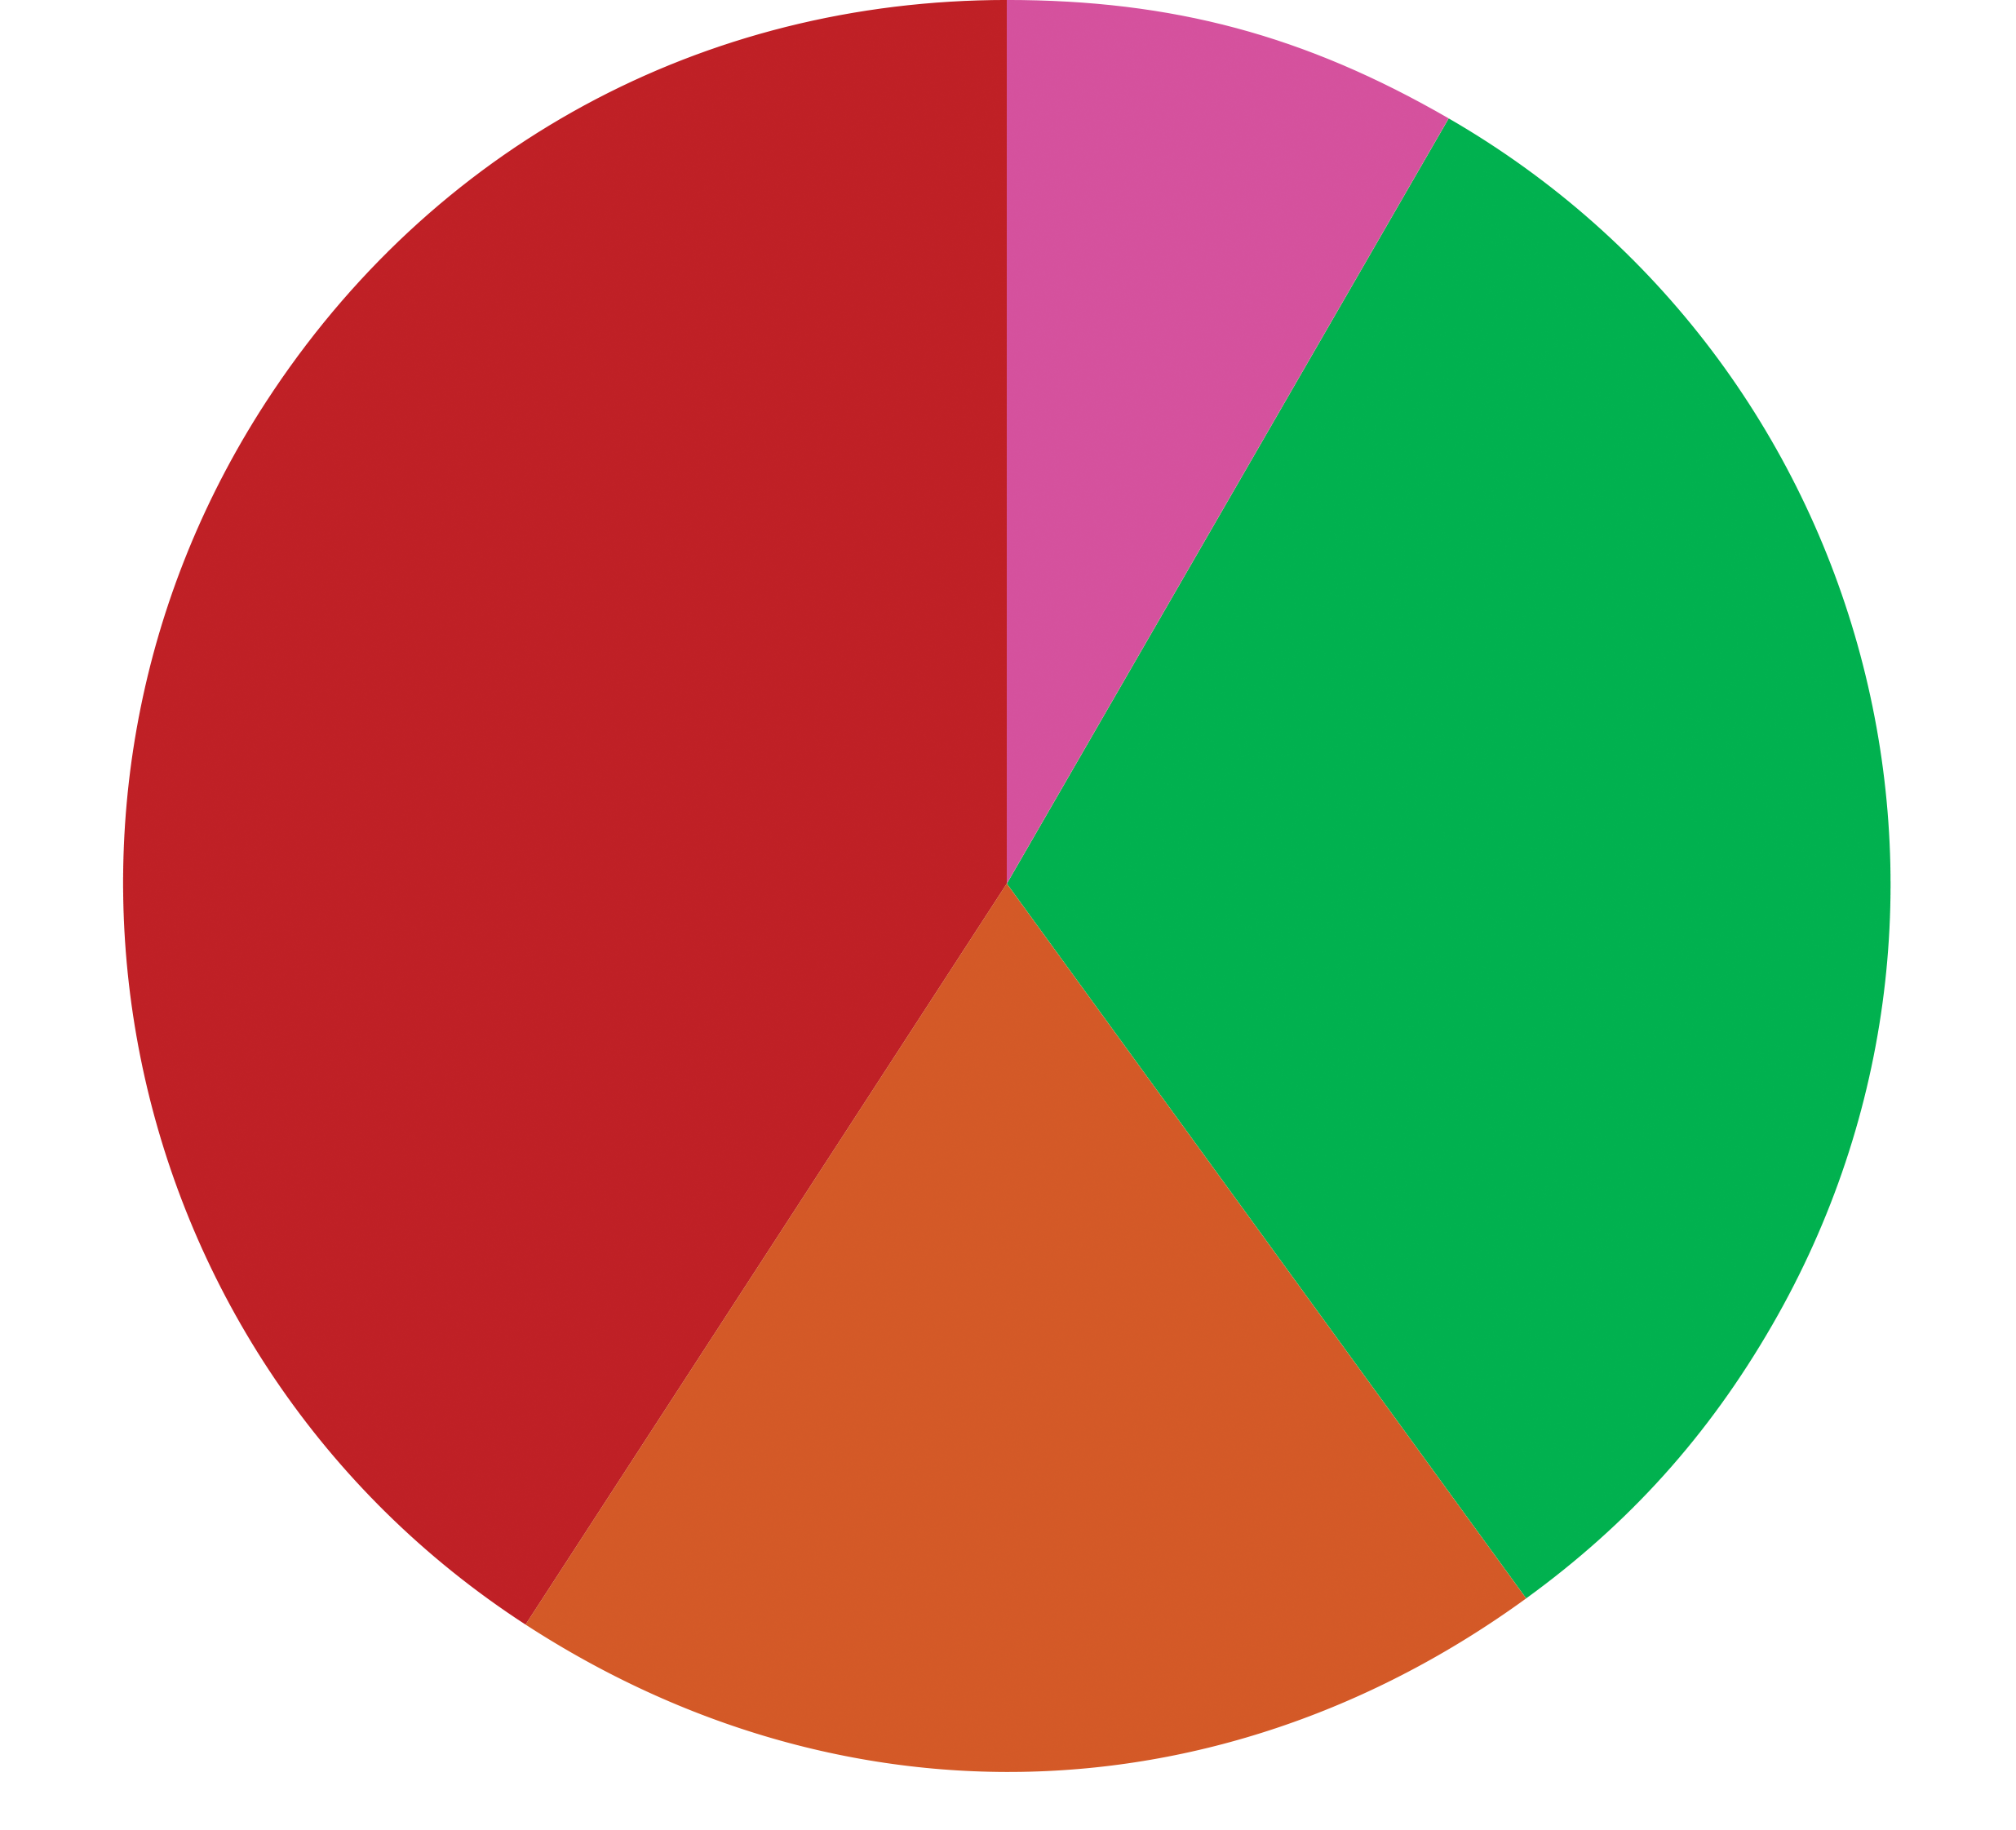
Boxed Novelty Pieces Bars Singles Multi Junior King Size
(Under $1 M)
$302.5M
$1.9M (0.6% $ Shr)
$2.3M (0.8% $ Shr)
$26.8M (8.8% $ Shr)
ADVENT
$18.2M (6.0% $ Shr)
$39.1M (12.9% $ Shr)
$48.0M (15.9% $ Shr)
$186.5M (61.7% $ Shr)
Total Christmas $ Sales: $302.5M
PRIVATE LABEL
OTHER
$350M $300M $250M $200M $150M $100M $50M $0M
Source: NielsenIQ, MarketTrack; National Convenience & Gas Banners; Beverage $ Share & $ % Chg, YTD to Aug 9, 2025
Key Manufacturer $ Share
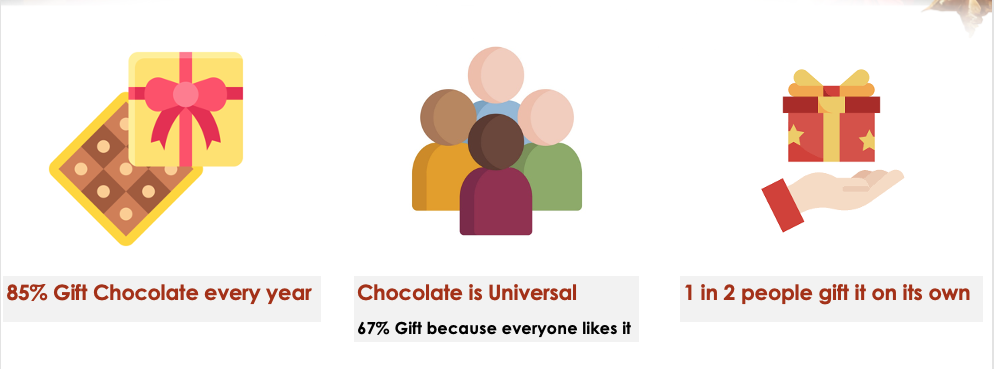
85% gift Chocolate every year
Chocolate is Universal 67% gift because everyone likes it
1 in 2 people gift it on its own
Source: NielsenIQ, MarketTrack; National Convenience & Gas Banners; Total Tracked Sales—UPC items only*; Latest 52 and 12 Weeks ending June 28, 2025
NARTD Beverages are Driving Sustained Growth for the C&G Channel
Beverages drive sustainable growth to the channel. Providing consumers with a variety of beverage choices to fulfill their needs and satisfy their thirst.
Total C&G Tracked Sales
8.3%
30.7%
21.5%
39.6%
Valentine's Day 2024 Easter 2024 Halloween 2024 Christmas 2024
$63.4M
$234.9M
$144.1M
SKU Status Contribution Nat'l C&G TYD to Aug 9, 2025
$ Volume Growth (Nat'l C&G TD to Aug 9, 2025)
Source: NielsenIQ, MarketTrack; National Convenience & Gas Banners; (2) Beverage $ Share & $ % Chg, YTD to Aug 9, 2025
Source: NielsenIQ, MarketTrack; National Convenience & Gas Banners; (1) Total Tracked Sales—UPC items only*; Latest 52 and 12 Weeks ending June 28, 2025
16.4%
28.9%
39.9%
0.8%
1%
1.5%
2.3%
1.8%
1.4%
($ in thousands)
Coke Canada is leading beverage growth for the channel.
The Top 10 SKUs make up 16.5% of Total YTD NARTD Sales
The Top 10 Innovation SKUs are contributing an additional 3.7% of Total NARTD Sales this year
The growth from the Top 10 Growth SKUs are contributing 4.1% in additional sales VYA