UNLOCK STUDY RESULTS
Shifting Routines Shopper Experience Value Seekers Habits Redefined Expanding Basket Made-in-Canada Building BevAlc Sustainability Loyalty + Tech Foodservice Facts Nicotine News The Bottom Line
Here's what shoppers across Canada had to say about:
The convenience-gas channel is evolving into a multi-purpose destination driven by younger generations, technological integration, category expansion and wider foodservice expectations. In turn, convenience stores are increasingly a fundamental part of the everyday lives and routines of shoppers across Canada, who are looking more beyond traditional categories to fill their baskets with grocery items, alcohol and health products. According to the 2026 C-Store IQ National Shopper Study, which surveyed 2,000 shoppers, convenience stores are successfully transitioning from occasional "fill-in" stops to habitual hubs for immediate-access essentials. This shift is being led by younger generations—specifically generation Z and millennials—who are driving growth in nearly every category and transforming the way these stores operate. With EIQ Research Solutions, Convenience Store News Canada surveyed more than 2,000 shoppers across the country to capture valuable insights into Canada’s ever-evolving convenience and forecourt landscape. This report marks the sixth installment of the annual shopper study, offering a comprehensive analysis of shopper preferences and behaviours. The study establishes a measurable baseline, providing valuable insights into evolving trends and consumer expectations as the channel navigates and strategizes for 2026 and beyond.
Click here to UNLOCK key themes
Introduction Shifting Routines Shopper Experience Value Seekers Habits Redefined Expanding Basket Made-in-Canada Building Bevalc Sustainability Loyalty + Tech Foodservice Facts Nicotine News The Bottom Line
EXPAND KEY THEMES
2026 C-store IQ National Shopper Study
ON A MISSION
Data-driven insights into the evolving wants, needs, perspectives and habits of today’s convenience and forecourt customers
BY MICHELLE WARREN • ILLUSTRATION BY YUKAI DU
Shifting Routines
Back to Top
Introduction
Frequency of Shopping Store Type
What ‘Convenience’ Means to Shoppers
% Shop Same Convenience Store Each Time
Frequency of Convenience Store Visits: Gasoline Only vs. In-Store Only vs. Both
Mean Trip Spend
Overall, shopping frequency remains consistent with 50% of shoppers saying they visit a c-store once a week or more—43% report shopping at a chain convenience store, while 36% shop at an independently-owned c-store. However, on a more granular level, there are shifting habits, driven largely by younger c-store shoppers (when we say younger, this includes Gen Z and millennials, while older is Gen X and boomers). For instance, younger shoppers showing a particular affinity for chain c-stores. 48% of Gen Z and 50% of millennials report shopping at a chain convenience store once a week or more. In addition, a growing number of shoppers report making daily trips to chain c-stores—8% compared to 6% a year ago—driven by gen Z (11%) and millennials (9%). This increase likely reflects the growing role of c-stores in younger shoppers’ daily routines, driven by convenience, smaller missions and expanded foodservice offerings.
Payment Used
Mean Trip Spend = $18.02
Shopper Experience
Significant increase/ decrease vs. 2025 at 95% confidence level
Importance of 'Experience' When Choosing Which Store to Shop At
Factors that describe a positive shopping experience
Slightly/Not Important
The overall importance of the shopping experience is statistically comparable year over year; however, the share of c-store shoppers who rate it as very important is rising and remains an area to watch. When defining a positive experience, price has declined in influence, while employee helpfulness and cutting-edge technology have gained importance. To drive more frequent visits, the top area for improvement is pricing, cited by twice as many shoppers as the next item. While pricing is slightly less influential than in 2025, access to local or Canadian-made products is gaining importance, particularly among older shoppers.
23%
31%
Moderately Important
46%
Very Important/Important
41%
27%
Performance Ratings for Convenience Store Shopped Most Often
Areas Where Convenience Stores Must Improve to Encourage More Shopping
Likelihood to Visit Different Store if Items Unavailable at Current Store Shopped
22%
Not Very/Not At All Likely
38%
Somewhat Likely
40%
Extremely/Very Likely
(n= # of shoppers that rated service/excludes those that selected ‘not applicable’)
Value Seekers
Nine-in-10 shoppers notice the same or a greater volume of price increases compared to a year ago, with a majority seeing more. Most will leave without buying or opt to go to another store, while Gen Z and millennials are more likely to choose a less expensive brand or private label. NEW IN 2026 With the increased price sensitivity and focus on value, new this year, shoppers were asked: “For which of the following categories have you purchased store brand or private label products at convenience stores in the past month?” Private label is gaining relevance in this value-driven environment. Packaged snacks and candy are the most common private-label purchases—core c-store categories with room to grow. Perceptions of quality vary by age. Most shoppers see store brands as comparable to name brands (55%) though one-fourth view them as lower quality (27%). Older shoppers are more favourable (61% of Gen X and 64% of boomers say quality is about the same), while millennials are more critical, with 31% saying quality is much or somewhat lower.
Frequency Noticing Higher Prices on Items Typically Purchased vs. Year Ago
Perceived quality of name vs. store/ private-label products at convenience stores
Much/Somewhat Lower
55%
About the Same
13%
5%
Don't Know/Have Not Tried Name Brand Much/Somewhat Higher
Action taken when desired product too expensive at convenience store
Habits Redefined
Much/Somewhat Higher
Convenience stores are successfully transitioning from occasional "fill-in" stops to habitual hubs for immediate-access essentials. This shift is being led by younger generations—specifically Gen Z and millennials—who are driving growth in nearly every category and transforming the way these stores operate. Increased visits are driven more by habitual behaviours focused on proximity, time savings and trip consolidation. For instance, nearly one-third report purchasing more from c-stores for health and beauty, alcoholic beverages and edible grocery, reinforcing a growing role in fill-in trips beyond traditional snacks. Packaged snacks is the only category to see a decline, signalling a potential need for refreshed assortment and value messaging. Overall, at least three in four shoppers across all categories report purchasing the same or more versus last year. Compared to 2025, shoppers in 2026 are making impulse purchases at c-stores more frequently, moving from ‘some’ to ‘most of the time.’ This shift is driven largely by Gen Z and millennials, with unplanned buys often serving as a treat or a way to capitalize on a deal.
Factors Influencing Convenience Store Visit
Occasions Typically shop at Convenience Store
46% 31% 30% 27% 26% 25% 22% 19% 12% 11% 11% 8%
To purchase gas Running errands Late-night snacking Special trips from home Afternoon snack/break Travelling for pleasure Travelling to/from work/school To purchase hot bev/breakfast To purchase lunch Travelling for business While working from home To purchase dinner
15%
16%
28%
35%
33%
Time of Day When Typically Shop at Convenience Stores
6am-8:59am
9am-10:59am
11am-1:59pm
2pm-3:59pm
4pm-6:59pm
7pm-9:59pm
10pm or later
Reasons Choose to Not Shop In-Store at Convenience Stores
39%
“Pas besoin de rien et trop cher.”
“Just don’t need anything."
"Too expensive and when I go out cheaper alternatives are available.”
“Prices are always higher.”
“The products are usually overpriced and not having a good quality or variety.”
“I would rather purchase at a grocery store where prices are more reasonable.”
“I have other things to do.”
“Just easier to do curbside or delivery.”
No reason to/don’t need items sold in-store
4%
Safety/unpleasant
Only purchase gas/pay at pump
“I have 2 kids in car seats so pay at the pump is way easier for me.”
21%
Items too expensive/ better prices elsewhere
9%
Limited selection/ prefer other stores
Too busy/no time to go in-store
TYPES OF TRIPS
75%
34%
Quick in-and-out Less than 5 minutes
Browse a bit 5 – 15 minutes
Hang out, eat and drink at store Over 15 minutes
Aspects that Influence Purchase Decision When Shopping In-Store
Frequency of Unplanned Purchases at Convenience StoreS
All of the time
Most of the time
Some of the time
Rarely
Never
42%
7%
10%
Reasons FOR Purchasing "More” at Convenience Stores
Reason for Recent Impulse Purchase at Convenience Store
To treat myself On sale/promotion To avoid going to another store New item I want to try Looked too good to pass up Curious about new flavour/variety To treat someone else Limited time offer/seasonal Child with me asked to purchase Item I wanted was not available Employee recommendation Recommendation from someone I know Item I wanted was too expensive
26%
18%
11%
8%
6%
43%
30%
25%
“It’s so flipping scary.”
“Some can be unsafe.”
45%
Purchase Frequency of Items at Convenience Store Today vs Last Year
Close/proximity Time savings/quick trips Lifestyle changes Category-specific needs Driving more/to purchase fuel Product availability/variety Alcohol now available Cost/value perception Extended/late-night hours Promotions/loyalty/app offers
53%
17%
Health and beauty care (n=117) Beer/Wine/Cider/RTD (n=422) Edible grocery (n=209) Non-edible grocery (n=171) Other tobacco products (n=365) Prepared food (n=360) Cigarettes (n=541) Hot dispensed beverages (n=665) Packaged beverages (n=656) General merchandise (n=263) Cold/frozen dispensed beverages (n=797) Candy/gum (n=914) Packaged snacks (n=759)
Expanding Basket
Food products purchased at convenience store in past month
Supercentres/Mass Grocery store Online stores Dollar store Club Discount supermarket Drug store Convenience store Local independent stores Specialty/Natural store No influence
Candy/Gum Cold/Frozen dispensed bevs Packaged snacks Packaged beverages Hot dispensed bevs Cigarettes Prepared food Other tobacco General merchandise Edible grocery Non-edible grocery Health and beauty
Channels where shoppers purchase items in typical month
Beverage products purchased at convenience store in past month
Food purchases over the past month largely mirror 2025, though full-size salty snacks have declined significantly, with snack-size options moving into third place. Chocolate, candy and gum continue to drive on-the-go treat purchases, reinforcing c-stores’ strength in impulse and convenience.
Beverage purchases are largely comparable to 2025, with the only significant shifts being growth in energy shots and a decline in frozen drinks.
Non-foods products purchased at convenience store in past month
Among non-consumable items, lottery tickets remain the most popular, purchased by nearly half of shoppers. Gasoline purchases have declined versus 2025, largely driven by lower incidence among Gen Z and millennials.
Category purchase levels at convenience stores remain unchanged versus 2025. Overall behaviours are relatively stable. At the same time, a growing share report not purchasing non-edible grocery and health and beauty items, suggesting a pullback on non-essential purchases and/or younger shoppers relying more on family or friends for these needs.
Purchase frequency of items at convenience store today vs last year
Store types shopped to discover new products
Nearly all shoppers (91%) can be influenced to visit specific stores to discover new products, led by mass, grocery and online. Millennials show the strongest overall appetite for discovery, with Gen Z joining them when it comes to c-stores specifically.
Preferred types of new products at c-stores
Product discovery at c-stores is beverage-led more, with energy, functional and limited-edition drinks driving interest. Prepared foods are gaining ground as everyday meal solutions, while snacks remain anchored in flavour innovation and novelty.
BEVERAGES
SALTY SNACKS
SWEET SNACKS
NON-CONSUMABLE ITEMS
PREPARED/FRESH FOODS
12% Energy drinks 8% Soft drinks/Sodas 5% Coffee/Tea 4% Alcoholic bevs 4% Functional/Health bev
14% Chips 4% Jerky/Meat snacks 3% Savoury bakery/ Crackers/Snack mixes 2% Better-for-you salty snacks
12% Candy & chocolate 4% Baked goods 3% Ice cream 2% Limited-edition/ Trending snacks
5% Personal care/Beauty 4% Household items/ Cleaning 3% Tech accessories 3% Apparel/Novelty
7% Ready-to-eat meals 4% Hot foods 3% Fresh bakery/ Breakfast 2% Produce
(n=# of shoppers that purchase item at a convenience store in typical month)
Traditional convenience products, including chocolate (37%), candy (31%) and gum (26%) remain the dominant on-the-go treats, however nearly one-third of shoppers are now purchasing more health and beauty products, alcoholic beverages and edible groceries at convenience stores than they did a year ago. This reinforces the sector's growing role in supporting daily household needs. Overall, data shows consumers are making more frequent, smaller trips to combine quick purchases with their on-the-go lifestyles.
Usage of expanded service at convenience stores
Compared to 2025, shoppers are making impulse purchases at c-stores more frequently, moving from ‘some’ to ‘most of the time.’ This shift is driven largely by Gen Z and millennials, with unplanned buys often serving as a treat or a way to capitalize on a deal.
Frequency of Unplanned Purchases at Convenience Stores
Nearly one-third report purchasing more from c-stores for health and beauty, alcoholic beverages and edible grocery, reinforcing a growing role in fill-in trips beyond traditional snacks. Packaged snacks is the only category to see a decline, signalling a potential need for refreshed assortment and value messaging. Overall, at least three in four across all categories report purchasing the same or more versus last year.
Made-in-Canada
*New in 2026
Made-in-Canada Movement
New in 2026 The study explored changes in purchasing behaviour tied to the made-in-Canada and buy-local movements, prompted by increasing tensions with the United States. We asked shoppers: “Compared to a year ago, which of the following changes, if any, have you noticed in the products you buy at convenience stores in Canada?” The results point to a clear shift: more than one-third of shoppers (36%) say they are deliberately buying more Canadian-made products than a year ago, while 27% are consciously purchasing fewer U.S.-made items. This trend reflects a growing emphasis on supporting domestic products, influenced by economic, cultural and trade considerations—and presents a meaningful merchandising opportunity for operators.
Special promotion (e.g., BOGO, bundle deal) Checkout counter sign or display Shelf signage Window signage Freestanding floor or aisle display Product samples or demos Wall posters or signage Cooler stickers Ceiling banners or signage Digital display or video Floor stickers In-store audio or radio None of the above
C-store purchasing changes made compared to last year
36%
I am buying more Canadian-made products than a year ago
I am noticing more Canadian-made products in stores than a year ago
I am buying fewer U.S. made products than a year ago
No noticeable changes compared to a year ago
Building BevAlc
(e.g. Budweiser Zero, Molson Exel, Coors Edge, Heineken O.O)
Building Beverage Alcohol
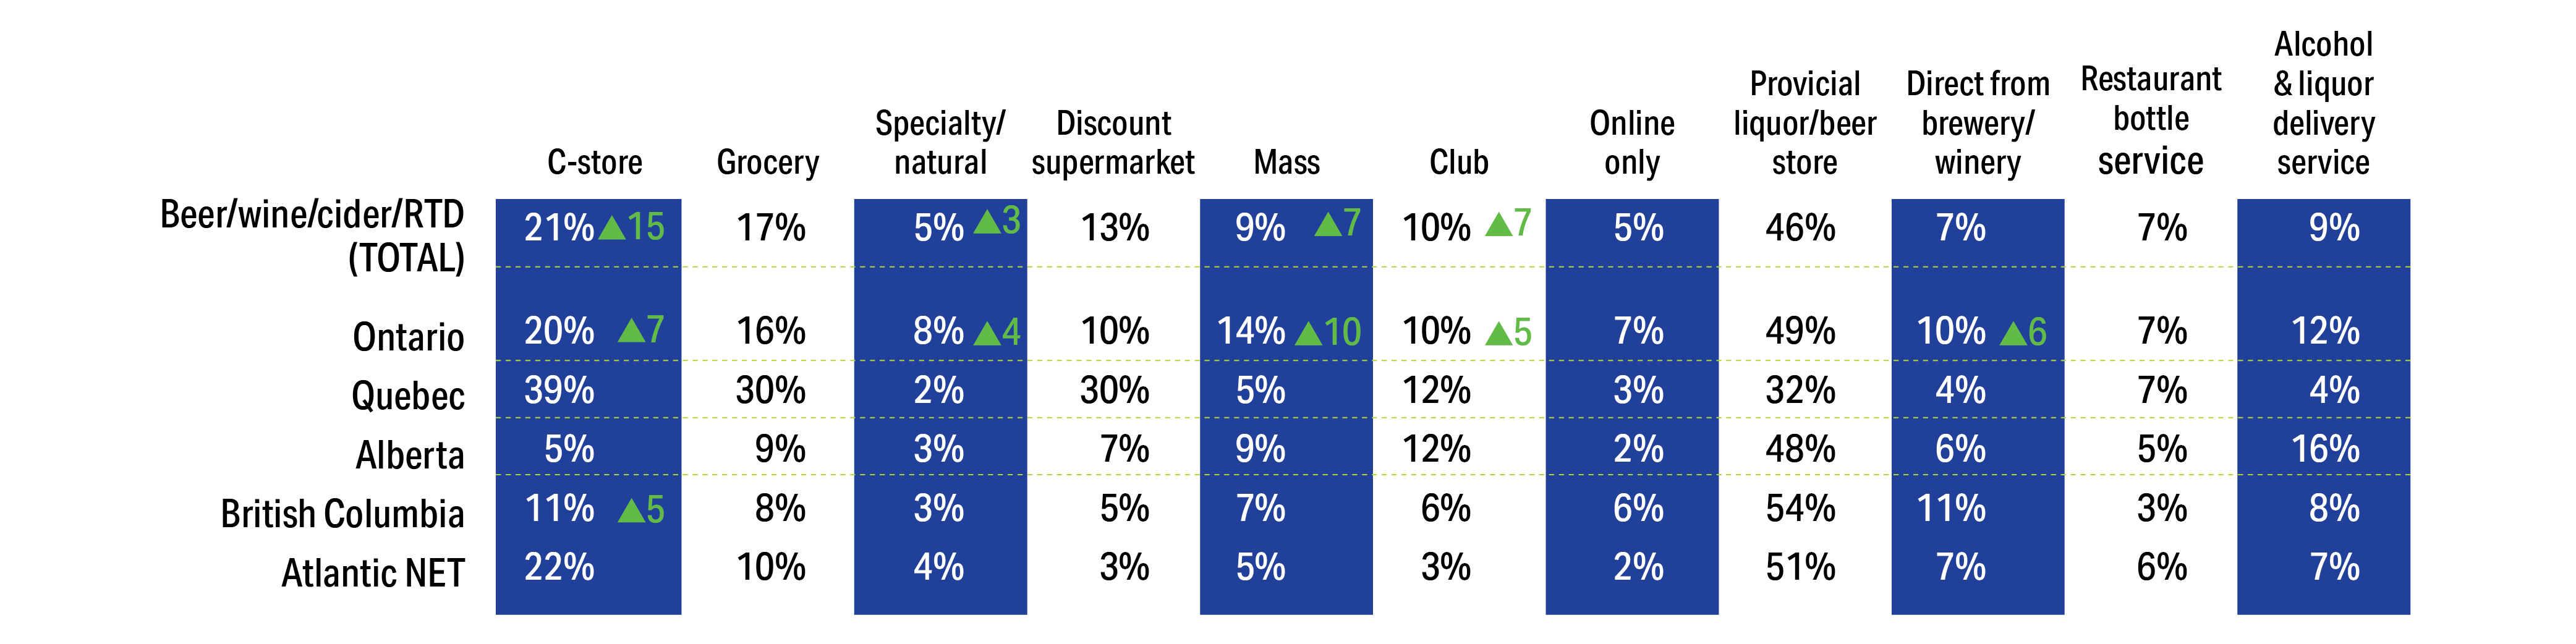
Channels Shoppers Purchase Beer/Wine/Cider in Typical Month
In many provinces, convenience stores are firmly established as go-to destinations for beer, wine, cider and ready-to-drink cocktails—second only to provincial liquor and beer stores as shoppers’ preferred destination. And, in further good news, most shoppers are highly satisfied with the alcoholic beverage assortment at c-stores. Channel shopper purchase of alcoholic beverages at convenience stores is steady, with 21% saying they purchase from a c-store in a typical month—that number is notably (and unsurprisingly) higher in Ont. (26%) and Que. (32%). Overall, the percentage of those shopping at provincial liquor and beer stores is declining, likely as shoppers in some regions adjust to new regulations giving c-stores a piece of the action. While satisfaction is high, particularly boomers (70% say they are highly satisfied), new data shows opportunities remain to expand the beer selection, increase overall variety through additional flavours and brands, and offer more premium, imported and sparkling wine options.
My province allows beer/wine/cider at convenience stores
Yes, I would like to see beer/wine/ cider available
No, I would not like to see beer/wine/ cider available
Types of Beer Purchased at Convenience in Past Month
Alcoholic/Non-Alcoholic Products Purchased at Convenience Store in Past Month
Package Type of Beer/ Cider/Coolers/Hard Seltzer/RTD Purchased
Size/Package Type of Wine Purchased
Reasons Purchased at Convenience Stores Over Alternative Store Types
interest in beer/wine/cider availability at c-stores
Why Beer/Wine/Cider/ Coolers Should Be Available
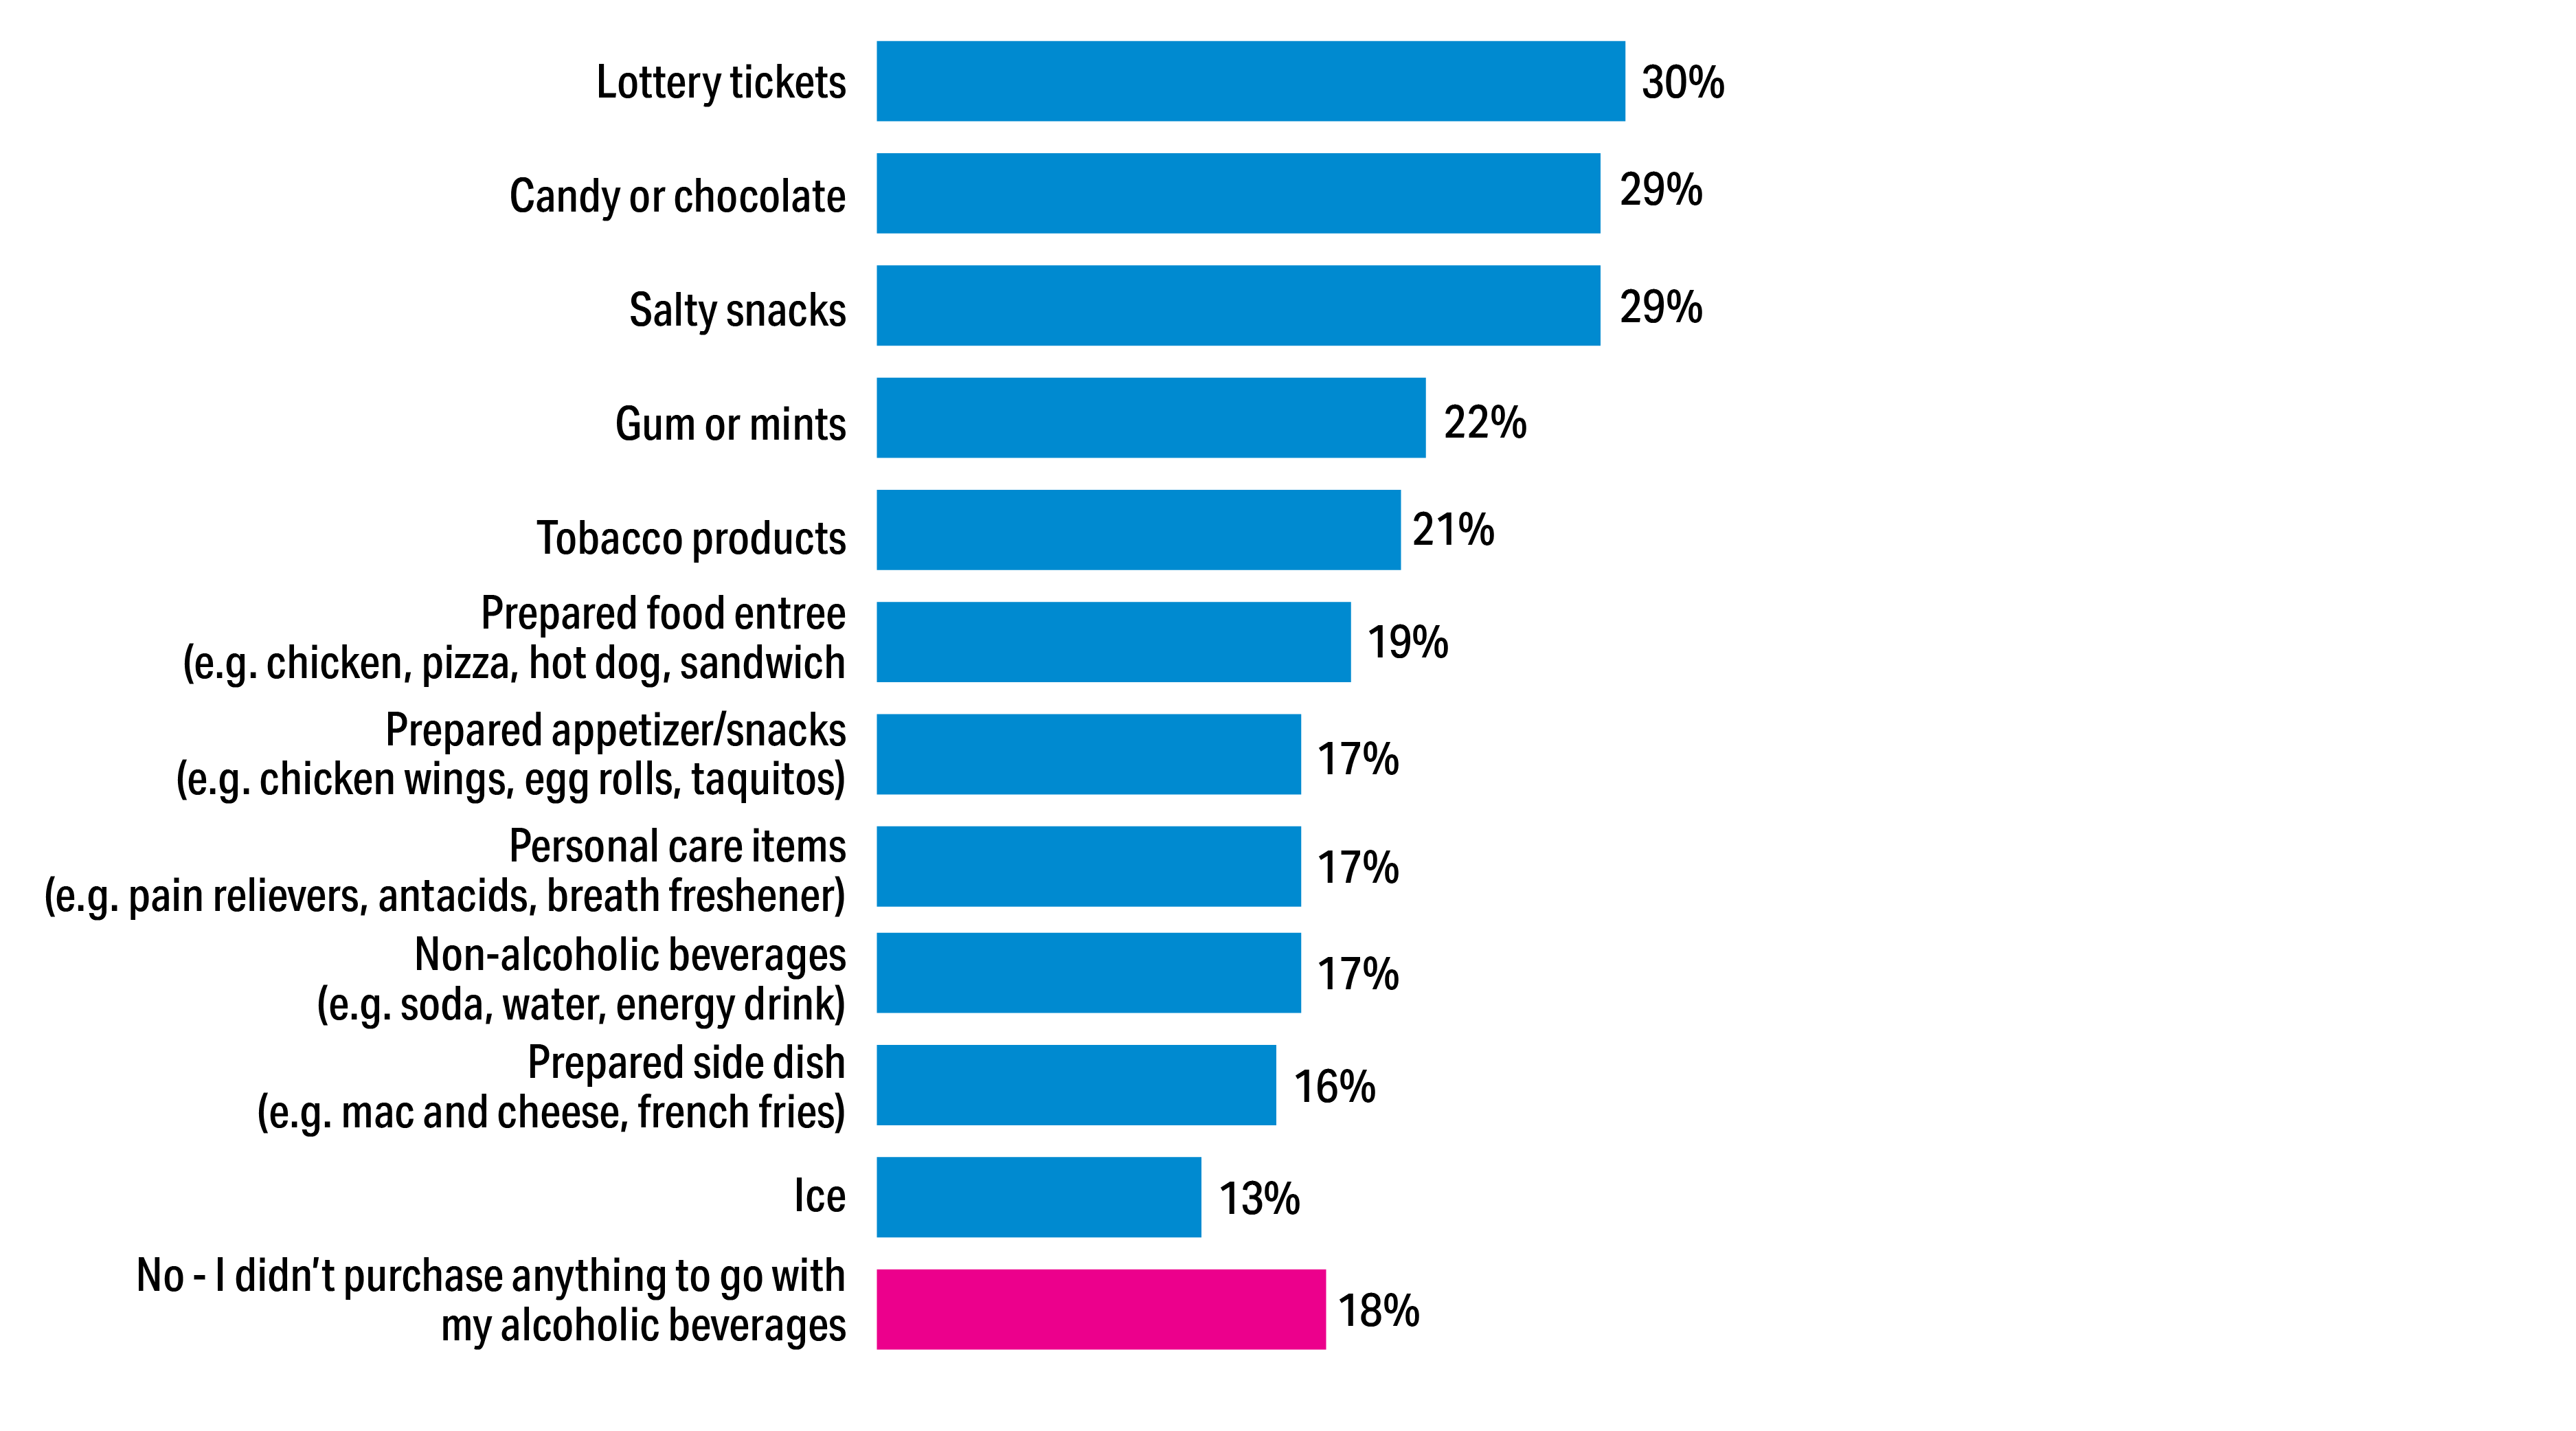
Additional Items Purchased with Beverage Alcohol
(e.g. Coors Light, Molson Canadian, Budweiser)
37%
VALUE/EVERYDAY BEER
(e.g. Labatt Blue, Busch Lager, Laker Lager, Pabst Blue Ribbon)
(e.g. Corona, Stella Artois, Heineken, Guinness)
(e.g. Bud Light, Molson Ultra, Michelob Ultra, Sleeman Clear etc.)
(e.g. Amsterdam, Big Rock, Hop Valley, Mill Street, Steam Whistle, Unibroue)
32%
IMPORT BEER
LIGHT BEER
24%
LOCAL/CRAFT BEER
PREMIUM BEER
44%
NON-ALCOHOLIC/ LOW ALCOHOL BEER
My province allows: 64% Quebec 41% Ontario 27% Atlantic NET
Yes, I would like to see available (by province): 60% British Columbia 51% Atlantic NET 50% Alberta 43% Ontario 29% Quebec
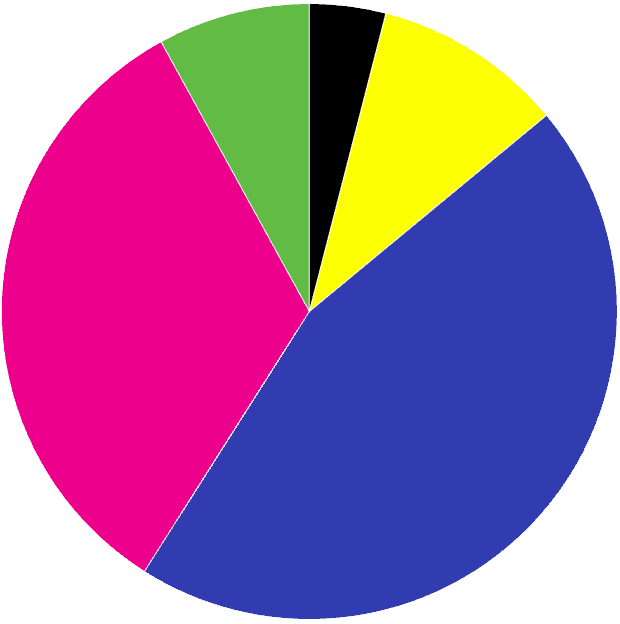
Basket bump: 80% of shoppers purchase additional items when buying alcoholic beverages, making them high-value customers. Lottery tickets take the top spot this year after an eight-point increase versus 2025. Salty snacks and candy/chocolate round out the top three. Market shifts: While overall c-store purchase rates are steady year-over-year (YOY), there is a slight increase in non-purchasers (up three points from 18% to 21%). What we are likely seeing here is a shift to sober lifestyles and healthier living, as well as a demographic of core c-store shoppers who do not drink for religious reasons. Declining traditional retail: Purchases at provincial stores are declining, with a notable shift toward delivery services as a preferred fulfillment method. The rise of ready-to-drink: RTD cocktails, both alcoholic and non-alcoholic, are a major source of growth for younger cohorts. Beer notes: Premium beer remains the top seller at convenience, driven largely by Gen Z shoppers, while value/everyday beer has moved into second place. Light beer and craft beer are seeing declines among c-store shoppers, suggesting a "budget-conscious trade-off" where consumers are moving toward value-tier options. Non-alcoholic growth: There is significant momentum in the "non-alcoholic" and "low alcohol" sectors, specifically driven by Gen Z and millennials. Size matters: Six-packs are the most preferred size for beer, cider, cooler and RTD purchases, rising six points compared to 2025. For wine, the 750 mL bottle dominates at 58% of purchases, while half bottles and 1.5 L bottles round out the top three (though 1.5 L bottles have declined in popularity compared to last year). Of note, 28% of Gen Z likes the 500 mL carton, compared to the average of 13% Habit forming: Shoppers most often purchase alcoholic beverages from c-stores because of a convenient location, while other factors such as price, speed, extended hours, one-stop shopping and product availability are similarly cited. Younger shoppers (Gen Z and millennials) are particularly likely to make impulse purchases or buy alcohol to accompany prepared food purchase. “I want what they have”: Interest in allowing the purchase of beverage alcohol at c-stores remains strong year over year: Among regions expressing the most interest, B.C. and Atlantic Canada lead, with more than half of shoppers wanting to be able to buy alcohol at c-stores.
8 key insights
satisfaction with c-store variety/assortment of alcoholic beverages
WHAT’S MISSING FROM THE SELECTION OF ALCOHOLIC BEVERAGES AT THE C-STORE YOU VISIT MOST OFTEN?
Not Very/At All Satisfied
Somewhat Satisfied
58%
Extremely/Very Satisfied
Single 4 pack 6 pack 8 pack 12 pack 15 pack 24 pack
19%
20%
3%
187 ml mini bottle 375 ml half bottle 750 ml standard bottle 1.5 litre bottle 3 litre+ bottle 500 ml carton 3 litre box 5 litre+ box Single-serving can Multipack of cans/ mini bottles
12%
Beer
Variety/Selection
Wine
Liquor/Spirits
RTD Hard Seltzers
Availability
Price/Discounts
Why Beer/Wine/Cider/ Coolers Should NOT Be Available
Sustainability
Convenience (one stop shop) Close proximity to home Better prices Faster service and less wait time Better variety
A steadily growing number of shoppers (72%) are likely to switch allegiance to a convenience store that demonstrates a stronger commitment to sustainability and the commitment is even higher among Gen Z and millennial shoppers. Every year since asked about sustainability, interest has grown—in 2025 70% of shoppers said they were “somewhat/very/extremely” likely to switch, compared to 68% in the 2024 report. One in four shoppers are highly likely to switch, with 27% of Gen Z and 30% of millennials saying they want to shop at stores that show a strong commitment to sustainability. On the local front, most shoppers (53%) say they now purchase made-in-Canada products always or often, a significant increase versus a year ago at 45%. This commitment is strongest among boomers—an incredible 72% are committed to shopping Canadian, followed by Gen X at 54%, millennials at 47% and Gen Z at 38%. In the wake of the ‘Elbows Up’ movement, notably, 41% of Canadian shoppers cite protest purchasing as a key motivator, underscoring how country-of-origin is more a values-driven choice.
Importance of Stores Demonstrating Commitment to Sustainability
Likelihood to Switch to a Store Demonstrating Stronger Commitment to Sustainability
Donate food instead of throwing out Locally sourced products Recycling containers for local use Movement towards zero waste Reusable bag incentives Ethical sourcing policies Eliminate plastic bags/packaging Energy-efficient equipment/fixures
29%
Not Very/At All Likely
47%
Rarely/Never
Sometimes
Always/Often
Purchase local products
Reason for purchasing local products
Don't Know/Not Sure
To supoort Canadian economy To support local businesses Trust Canadian safety/ quality standards To protest U.S. trade actions/tariffs Feel quality is better Sustainable/Better for environment More unique Other
59% 54% 46% 41%
31% 28% 24% 2%
Loyalty + Tech
Among the 39% of Shoppers that follow a Convenience Store on Social Media
26% Facebook
20% Instagram
18% YouTube
12% TikTok
8% X/Twitter
Preferred Check-out Method
Following Convenience Stores by Social Media Platform
3.15 4.06 4.2 4.29
MEAN RANK
% Ranking type of reward
Cash back rewards
Gas discount
Free/ discounted prepared food
Free/ discounted beverages
Sweepstakes - large chance/ small prize
Opportunity to try new products first
Sweepstakes - small chance/ large prize
Local charitable donation
Not Very Comfortable
Not At All Comfortable
Somewhat Comfortable
Very Comfortable
Comfort With Loyalty Program Providing Personalized or Targeted Ads Based on Previous Purchases
Follow a convenience store on social media
Self check-out payment using AI sensors
(e.g., card charged automatically via sensors upon exit) (e.g., automatic card payment via sensors upon exit
52%
At register with human interaction
Self check-out at register
Active loyalty program usage has increased significantly, reflecting shoppers’ pursuit of rewards and savings. While Gen Z and millennials are more likely to be enrolled but not actively using, this points to a clear engagement opportunity. Over half of users are highly satisfied, indicating that participation delivers meaningful value. Nearly two-thirds of active loyalty program users leverage a mobile app, especially Gen Z, millennials and Gen X. Boomers are less engaged digitally, indicating that app-centric programs may drive growth with younger users but require alternative approaches for older shoppers. Nearly one-third of shoppers are very comfortable with personalized ads, with millennials most receptive and boomers least. This generational divide suggests c-stores should tailor approaches when possible, using personalization for younger shoppers while addressing privacy concerns for older shoppers.
Awareness and Enrollment in Convenience Store Loyalty Program
I don't know
Would not enroll even if they did
If they did, I would enroll
I am not enrolled
I am enrolled but do not use
I am enrolled and actively use
No, convenience store shopped most often does not have a loyalty program
60%
Yes, convenience store shopped most often has a loyalty prgram
Satisfaction with loyalty program
Checkout preferences remain nearly evenly split year over year. While overall preferences are stable, generational differences are pronounced: Gen Z and millennials are significantly more likely to prefer self-checkout, whereas older shoppers still lean toward human interaction.
Two in five shoppers follow a c-store on social media, with engagement highest among Gen Z and millennials, half of whom do so. Social media use is relatively fragmented across platforms, with Facebook and Instagram leading.
6% LinkedIn
Foodservice Facts
Ranked in Top 3 Ranked 1st
Prepared food purchases are comparable to 2025, still being driven primarily by Gen Z and millennials. Sales peak midday to early evening, with the highest activity 4 p.m. to 7 p.m. Prepared food still drives overall sales, as 71% of purchasers also buy other items, though Gen Z is most likely to visit c-stores solely for prepared foods.
Purchased Prepared Food at Convenience Store in Past Month
Lunch Snack Dinner Breakfast None
Purchased prepared food at convenience store in the past month
Purchase prepared foods only
71%
Combined with other items/gasoline
39% 38% 32% 17% 9%
2.05
Average # of times prepared foods purchased at convenience stores in the past month
Time of Day When Last Prepared Food Purchase Made at Convenience Store
Typical Prepared Foods Trip Type
14%
No Preference
Grab-and-Go/ Refrigerated
Made-to-Order/ Freshly Made
Types of Prepared Foods Purchased at Convenience Store
Satisfaction with Most Recent Prepared Foods Purchase at Convenience Store
48%
Place Where Last Purchase was Consumed
Occasions Where Prepared Foods Purchased from Convenience Store to Share with Household
Preference for Prepared Foods at Convenience Store
Additional Items Purchased with prepared foods
Consumed prepared food item(s) at home
Consumed prepared food item(s) outside of the home
*modified for 2026 survey
27% In the car
14% At work
12% In the store
3% At school
2% Purchased for someone else
Most prepared foods are consumed on the go, though boomers are significantly more likely to eat them at home. When shared with their household, purchases are evenly split between lunch and dinner, with snacks closely following.
93%
of shoppers who bought prepared foods also purchased other items.
NEW IN 2026
OUT-OF-WAY VISITS
One-third of prepared foods shoppers say they would go out of their way to visit a specific c-store for a unique foodservice item. While the items that drive this behaviour are diverse, salty snacks, prepared foods, and frozen drinks rise to the top.
Snacks/Chips Prepared Food Slurpee/Slushie Coffee/Hot Drink Tobacco Dairy
9% 8% 6% 5% 5% 4%
UNIQUE ITEMS THAT DRIVE OUT-OF-WAY VISITS
“Is there a convenience store you would go out of your way to visit because it offers a specific or unique foodservice item you can't get anywhere else?”
WE ASKED:
Would go out of their way to visit a specific c-store because it offers a unique foodservice item.
41% Gen Z
40% Millennials
16% Boomers
Nicotine News
Cigarette use among convenience shoppers is up slightly year over year, and convenience stores remain the primary purchase destination for smokers: Three-quarters of smokers say they purchase cigarettes at convenience stores, reinforcing the channel’s central role in tobacco sales. Millennials are playing an outsized role in cigarette purchasing. More than one-third (34%) say they smoke regularly, and 79% report buying cigarettes at convenience stores. The cohort also has a higher rate of vaping and e-cigarette use, with 19% reporting regular use compared with the 16% overall average. Gen Z, however, still drives the vaping subcategory. Nearly three in 10 Gen Z shoppers (29%) say they use vaping or e-cigarette products regularly. The data also suggests a shift in where consumers are buying these products. Fewer users report purchasing from specialty vape shops, down nine percentage points year over year to 53%, narrowing the gap with convenience stores and signalling a growing opportunity for the channel.
Brand loyalty remains strong across both cigarette and vape users. More than one-third of users (36%) say they are likely to switch stores if their preferred brand is unavailable. That figure rises to 43% among millennials, underscoring the importance of in-stock execution and assortment discipline. Smoking cessation products also present a potential area for growth. Gen Z (13%) and millennials (11%) are the most likely to purchase cessation aids. Nearly half of these shoppers prefer to buy such products at convenience stores, while purchases at grocery stores still decline. With appropriate regulations in place, the findings suggest convenience stores are well positioned to capture a greater share of the cessation category, particularly given their established role as a primary destination for smoking-related products.
The Bottom Line
The annual C-store IQ National Shopper Study is an important benchmark, tracking the evolving wants, needs, perspectives and behaviours of convenience and forecourt visitors across Canada. With comprehensive data by age demographics and geographical locations, C-store IQ data represents a cross-section of shoppers across the country. The 2026 data paints a clear picture: convenience stores play a vital role in Canadians’ daily lives, but expectations are rising—especially among younger shoppers who are expanding the role of the c-store in their daily routines. As fuel’s influence softens, success will hinge on experience, value, foodservice, digital engagement and relevance. Operators who understand generational differences—and respond accordingly—will be best positioned to capture trips, build loyalty and remain indispensable in an increasingly competitive retail landscape.
PRINT AND/OR DIGITAL MAGAZINES
E-NEWSLETTERS
SUBSCRIBE NOW
FULL STUDY IN PDF FORMAT
DOWNLOAD PDF
Subscriber Access & Terms of Use Existing Subscribers: Your download is complimentary as part of your subscription. You are welcome to share and reference these findings in internal or external presentations, articles or reports. Please ensure all citations and charts are attributed to the 2026 C-Store IQ National Shopper Study from Convenience Store News Canada. If you find these insights valuable and want to share the report with colleagues, please direct them to this webpage for the full digital experience. New Visitors: By clicking download, you agree to receive a complimentary digital subscription to our newsletters and digital magazine from Convenience Store News Canada. You can access your new benefits or manage your preferences at any time.