UNLOCK STUDY RESULTS
Routines Redefined Focus on Experience New in 2025 Tracking Behaviours Spending Habits Unpacked Beverage Alcohol Boon New with Nicotine Making an Impact Foodservice Facts Tech Talk Moving Forward
Here's what shoppers across Canada had to say about:
The C-store IQ National Shopper Study debuted in the magazine in January 2020 and so much has changed in five years. With the pandemic largely in the rearview mirror, the focus now is on everything from artificial intelligence to global unrest, economic threats, tariffs, new technologies and more disrupting the retail and consumer experience. However, new data emphasizes that among all this movement and change, one thing remains consistent; the channel continues to play an important role in the everyday lives of shoppers, while earning its place as a cornerstone in communities across Canada. C-store IQ is the only convenience and gas specific study delving into wants, needs, perspectives and habits of consumers in Canada. With EIQ Research Solutions, Convenience Store News Canada surveyed more than 2,000 convenience shoppers across the country to capture valuable insights to inform Canada’s ever-evolving convenience and forecourt landscape. With comprehensive data by age demographics and geographical locations, C-store IQ is your window into the wants, needs and habits of shoppers across the country, with information designed to inform business decisions and drive success.
Introduction Routines Redefined Experience New 2025 Tracking Behaviours Spending Unpacked BevAlc Boon Nicotine News Doing Good Foodservice Facts Tech Talk Moving Forward
Click here to UNLOCK these 11 key themes
NATIONAL SHOPPER STUDY 2025
ON THE MOVE
Data-driven insights into the evolving wants, needs, perspectives and habits of today’s convenience and forecourt customers
Routines Redefined
Back to top
Introduction
Experience
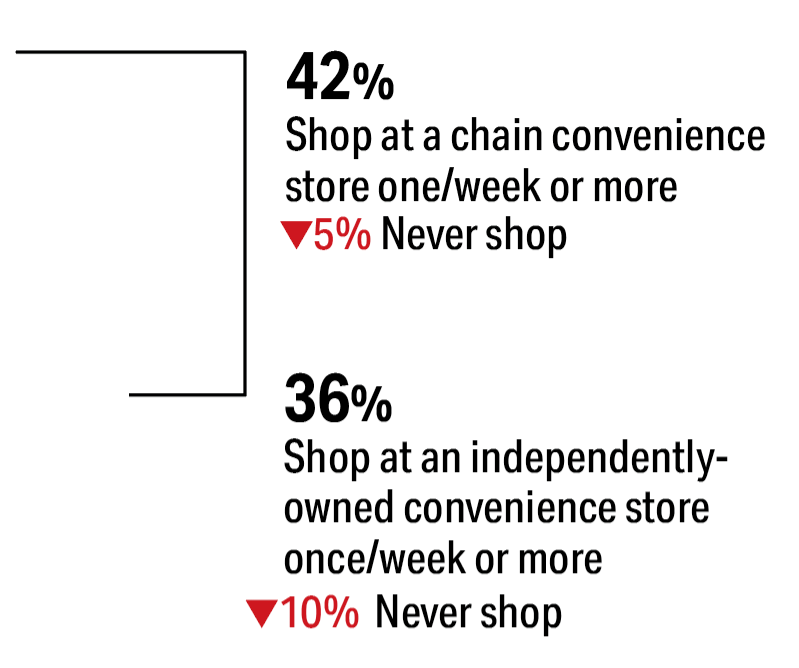
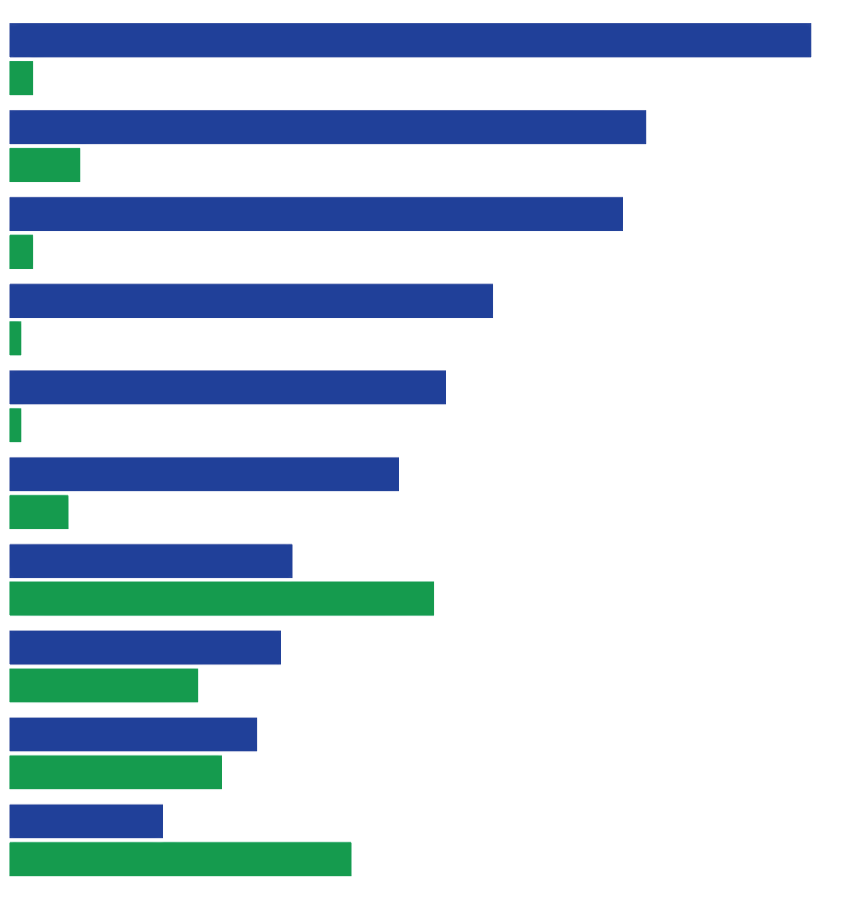
Frequency of Shopping Store Type
50%
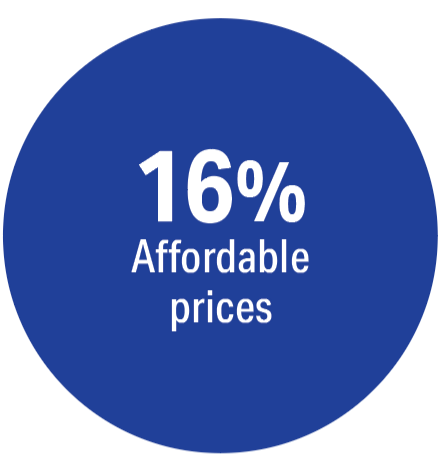
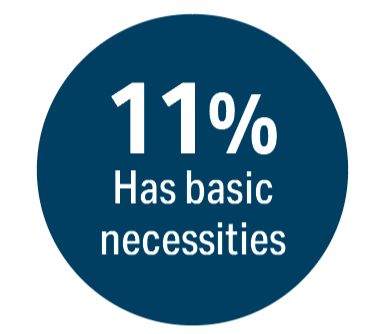
What ‘Convenience’ Means to Shoppers
68%
Those who shop the same convenience store each time
% Shop Same Convenience Store Each Time
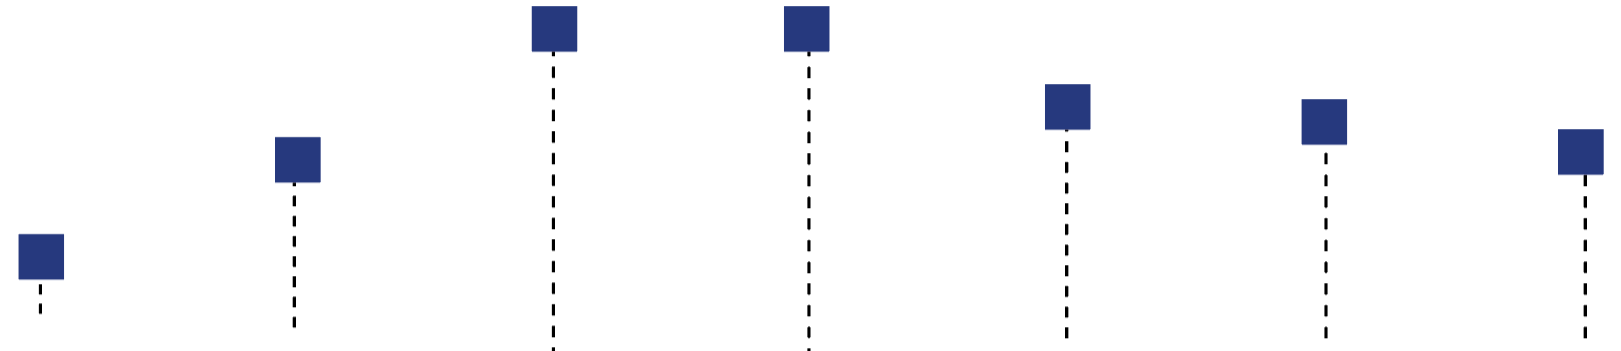
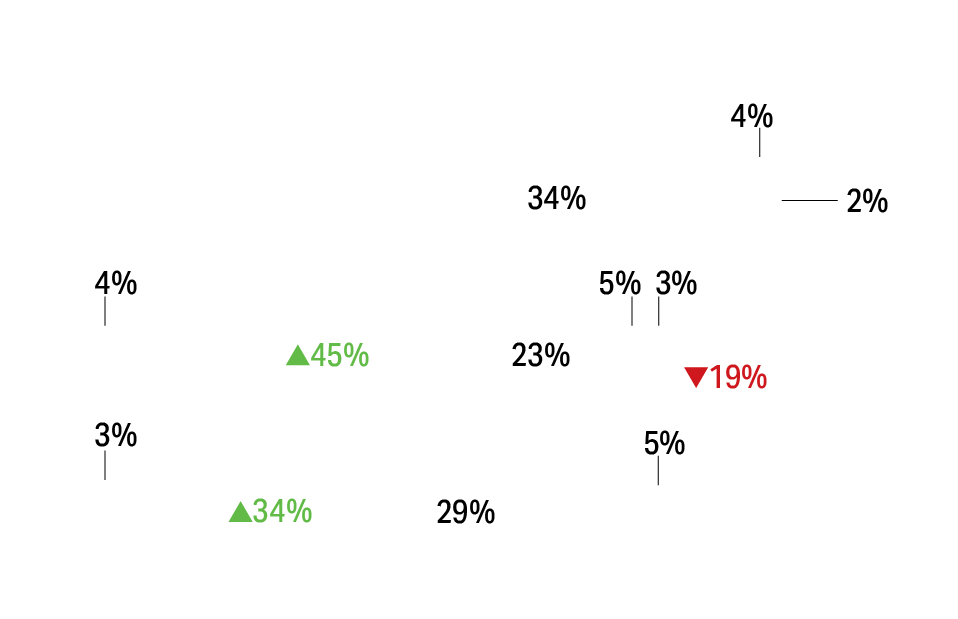
Frequency of Convenience Store Visits: Gasoline Only vs. In-Store Only vs. Both
Mean Trip Spend
50% of shoppers visit a convenience store once a week or more, which is up slightly from 47% a year ago. In addition, weekly visits that include a fuel purchase increased significantly year over year.
2%
8%
21%
15%
14%
13%
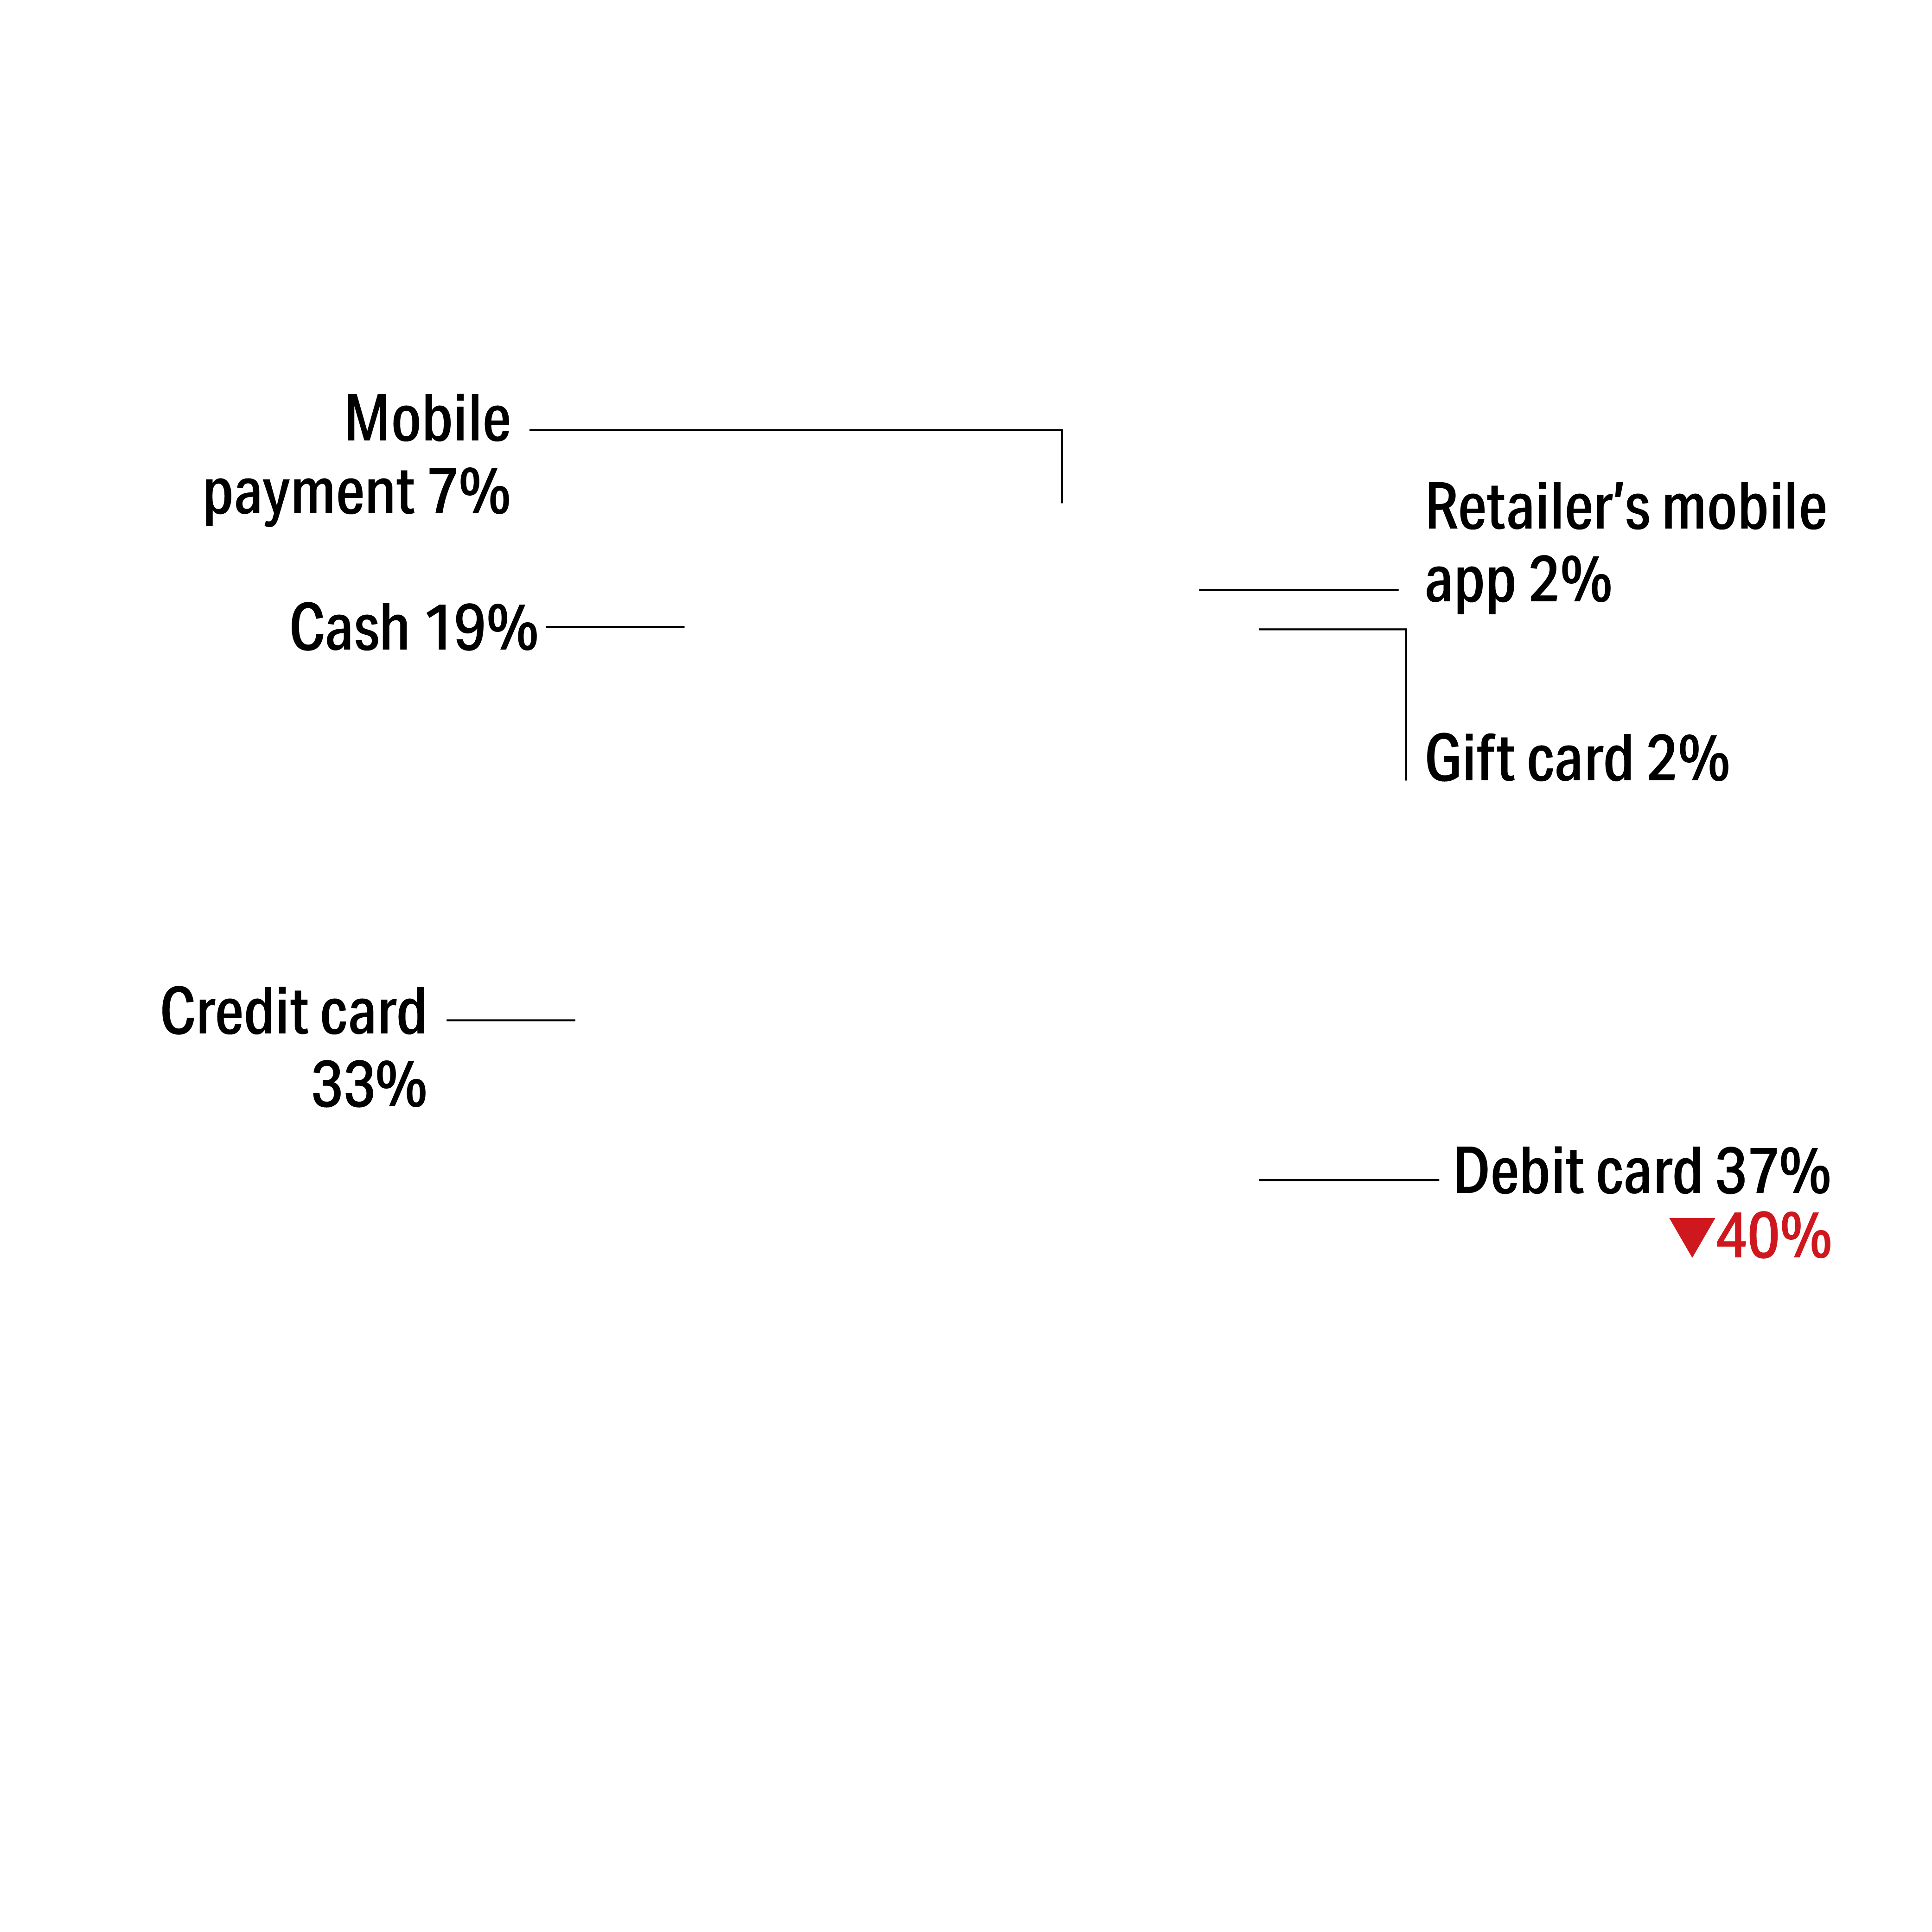
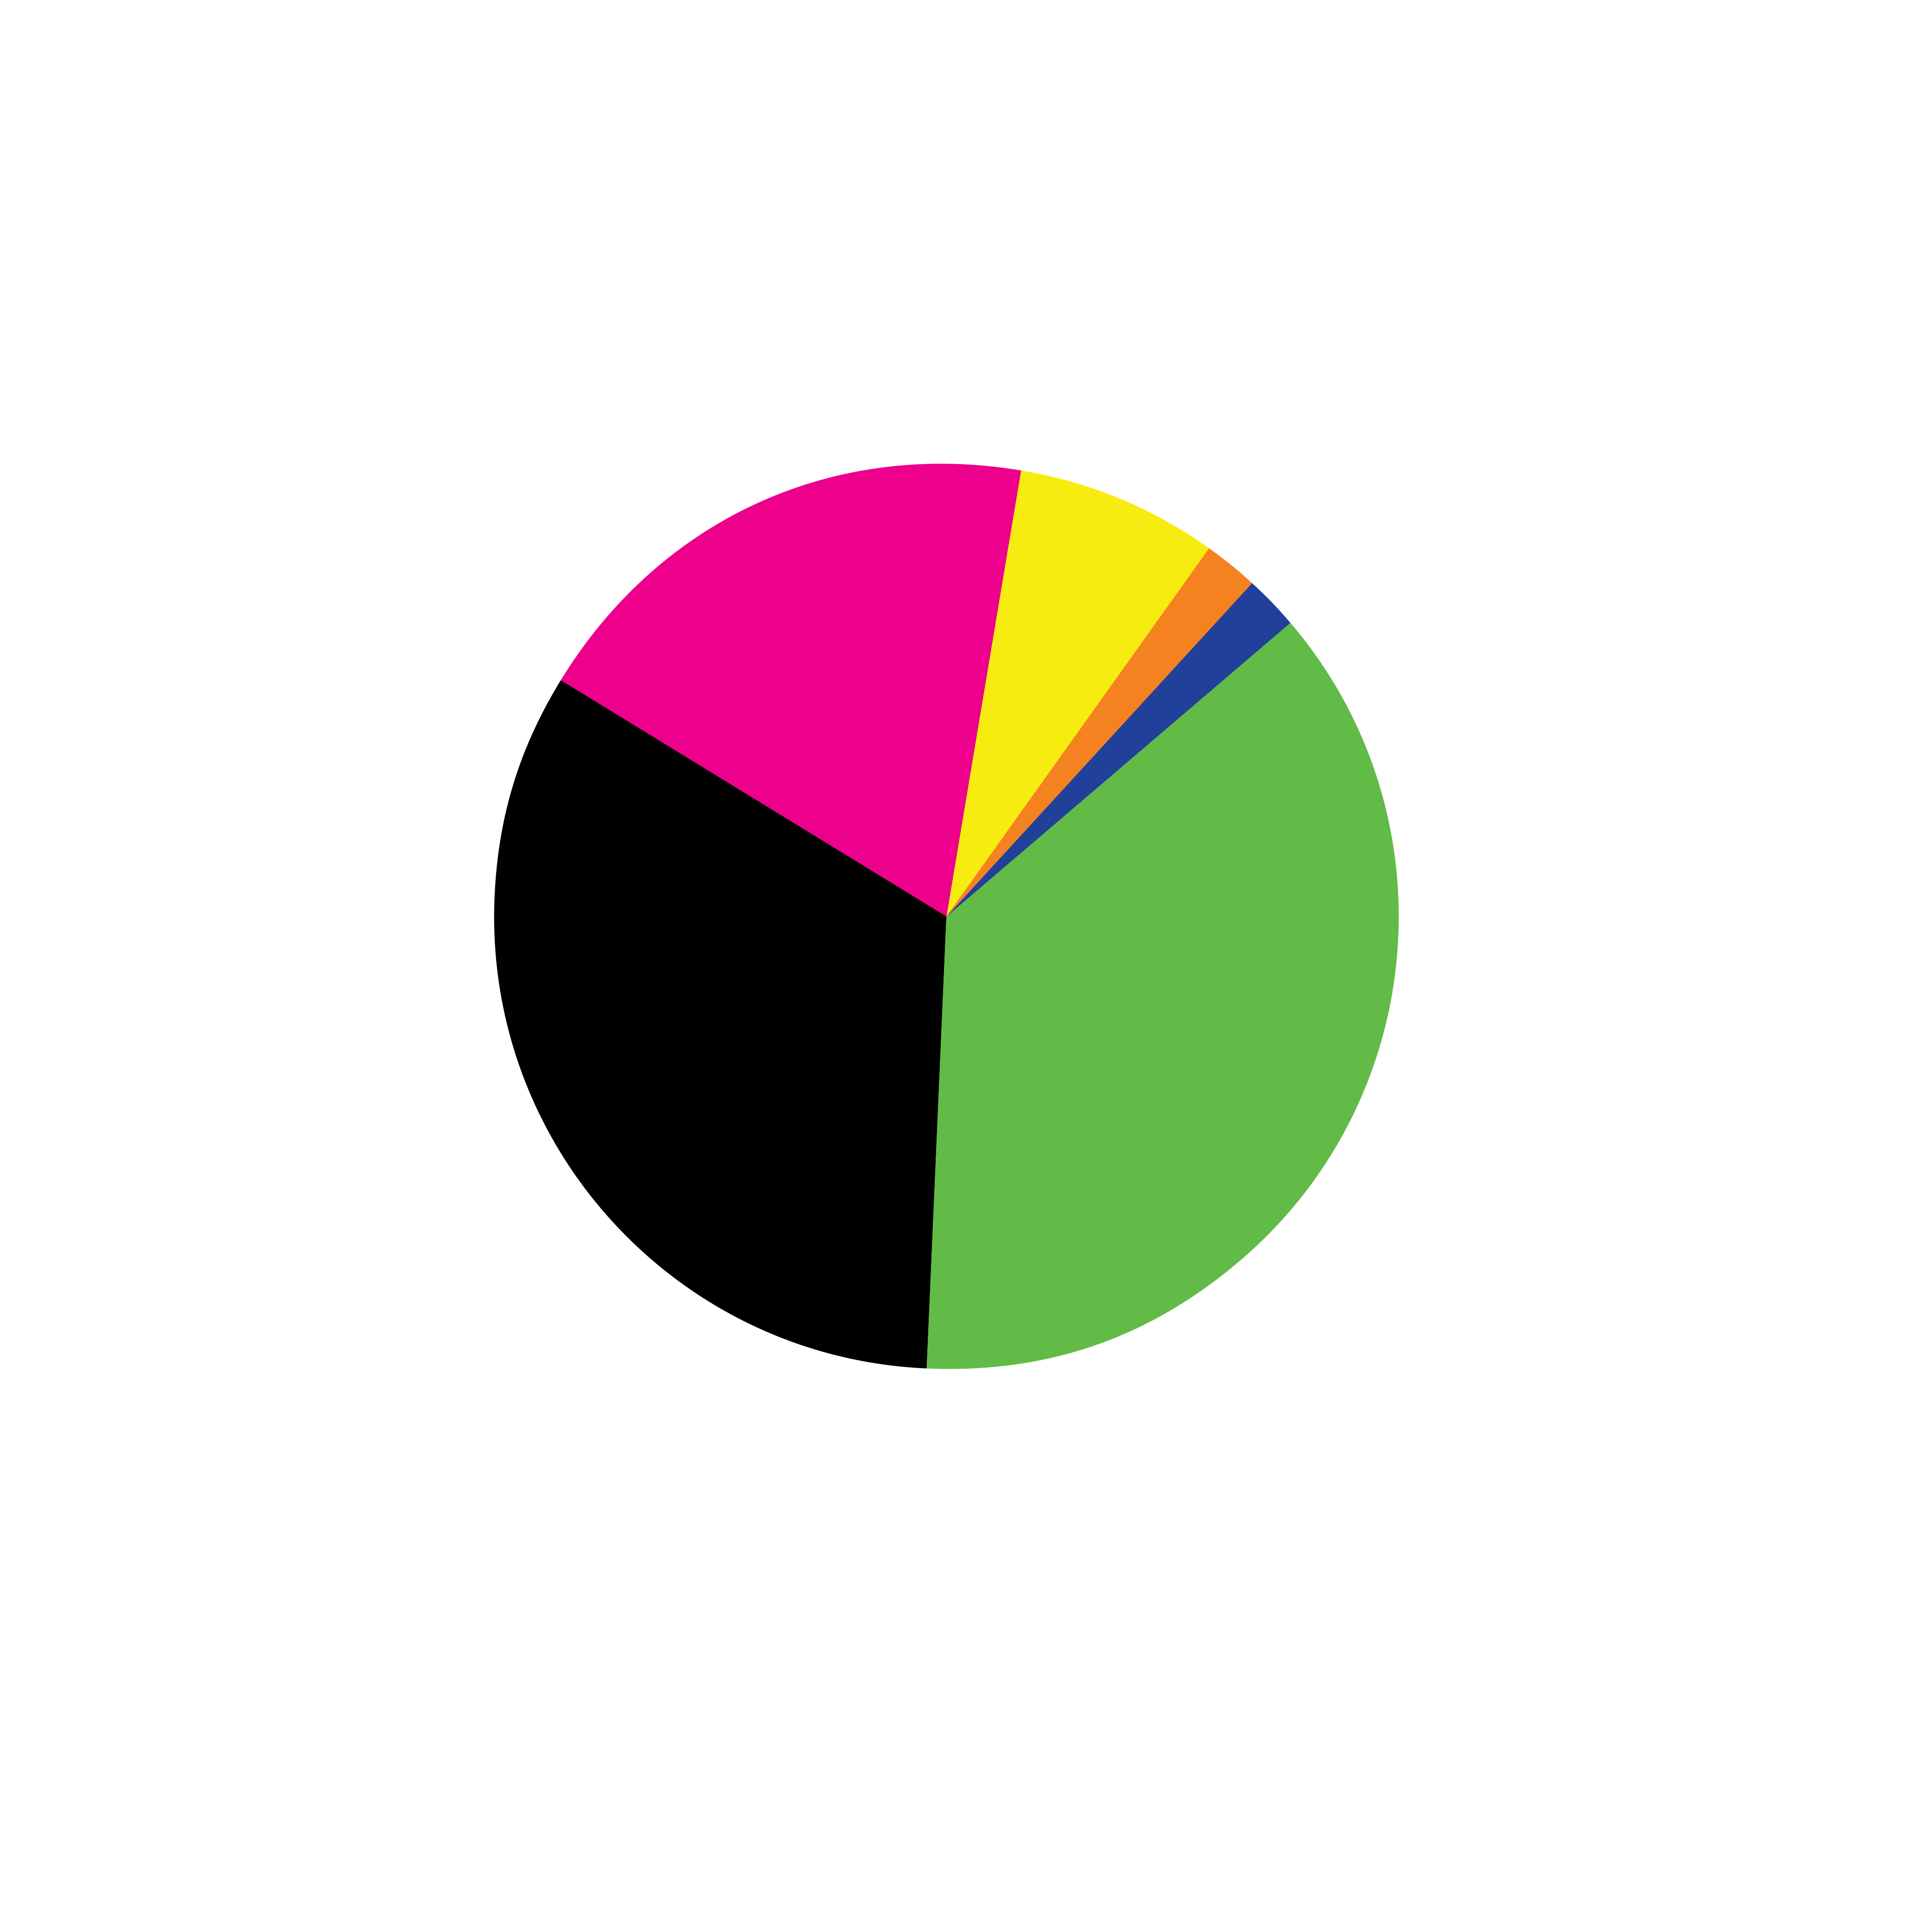
Payment Used
NATIONAL SHOPPER STUDY 2025: ON THE MOVE
Significant increase/ decrease vs. 2024 at 95% confidence level
Mean Trip Spend = $17.66
Focus on Experience
New 2025
Importance of 'Experience' When Choosing Which Store to Shop At
Factors that describe a positive shopping experience
Slightly/Not Important
The overall shopping experience is becoming more significant, with nearly half rating it as very important or important.
24%
29%
Moderately Important
47%
Very Important/Important
41%
27%
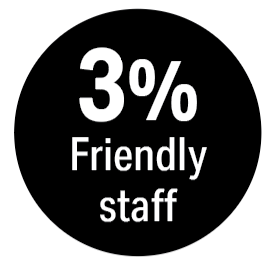
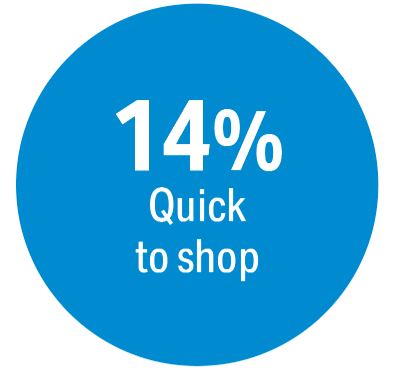
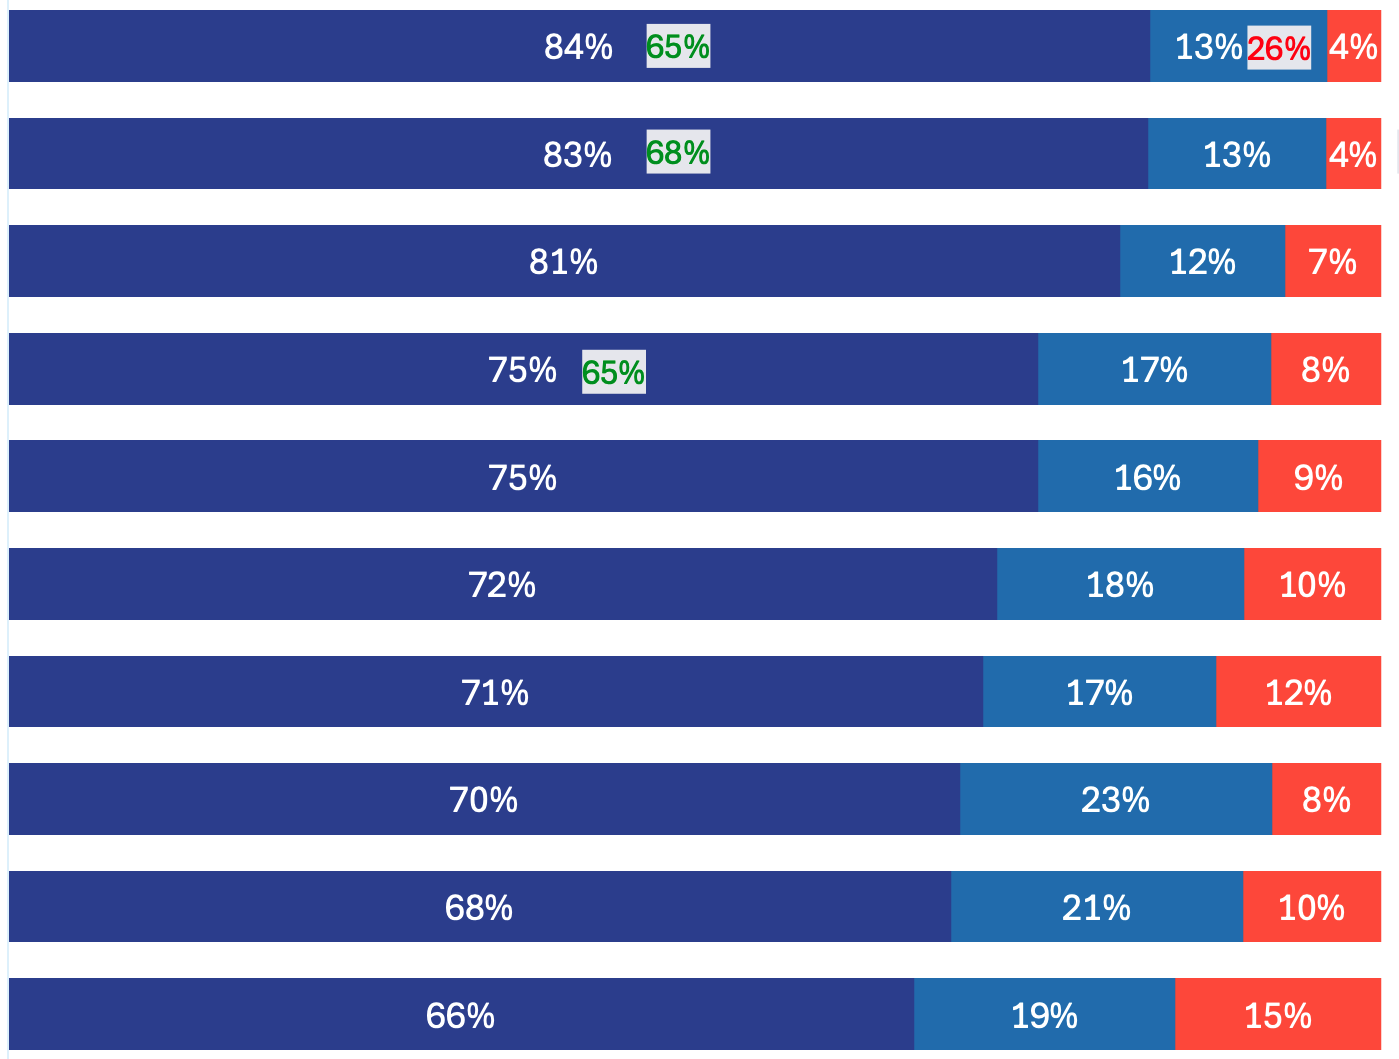
Quality of prepared food Employee friendliness Speed of shopping trip Organization of store Employee helpfulness
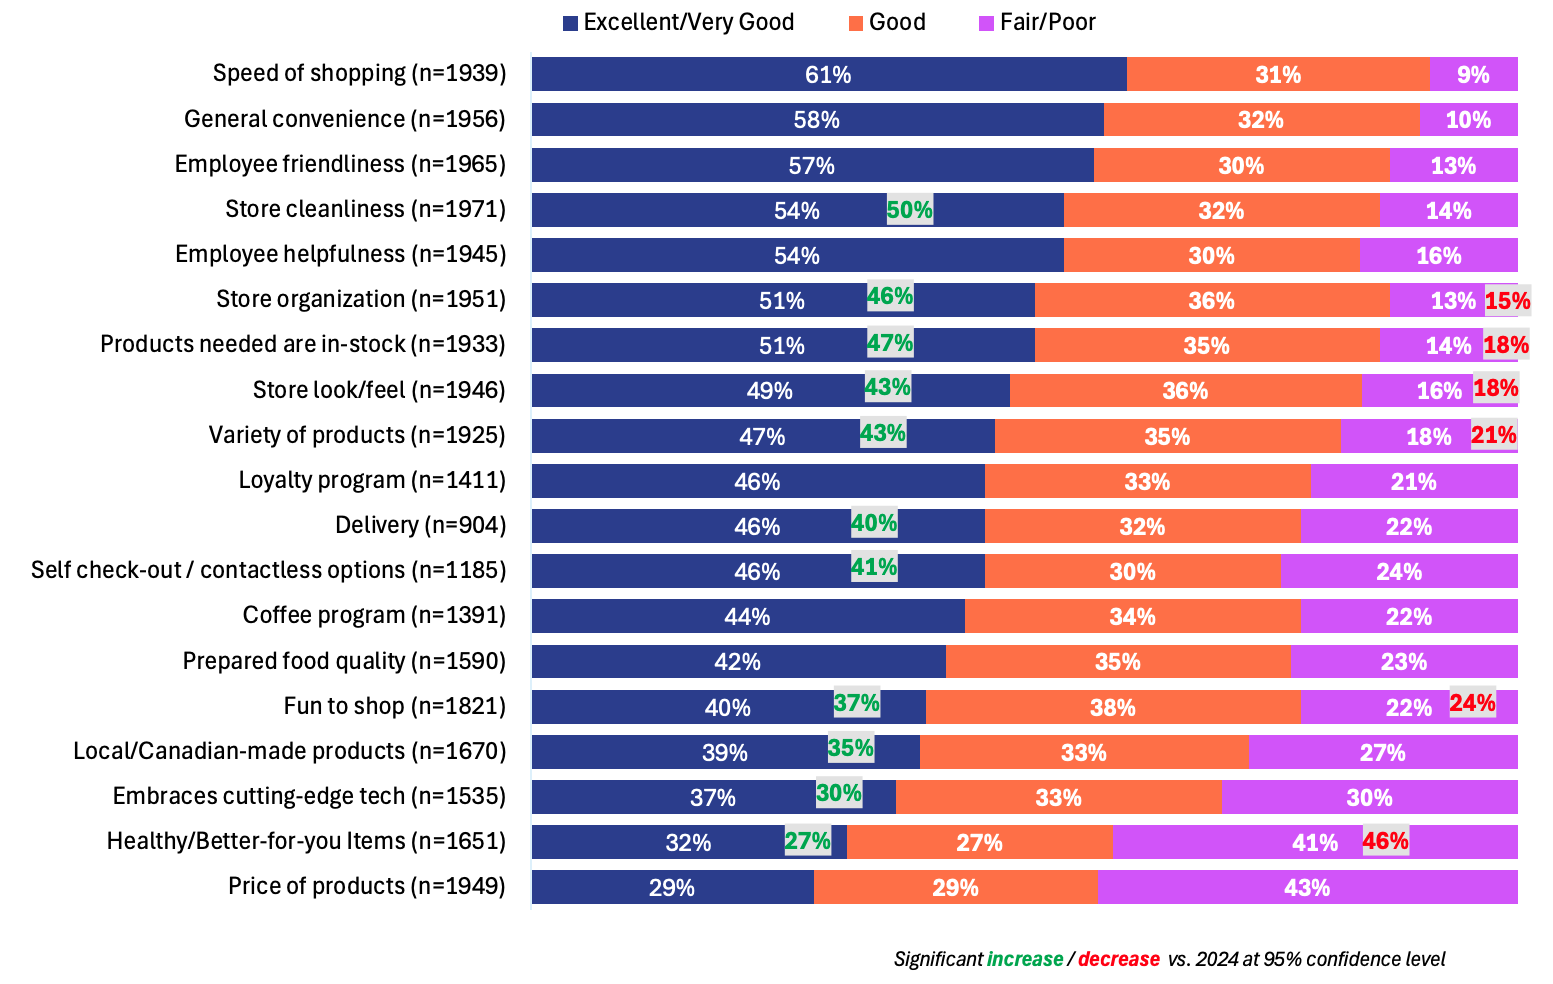
Performance Ratings for Convenience Store Shopped Most Often
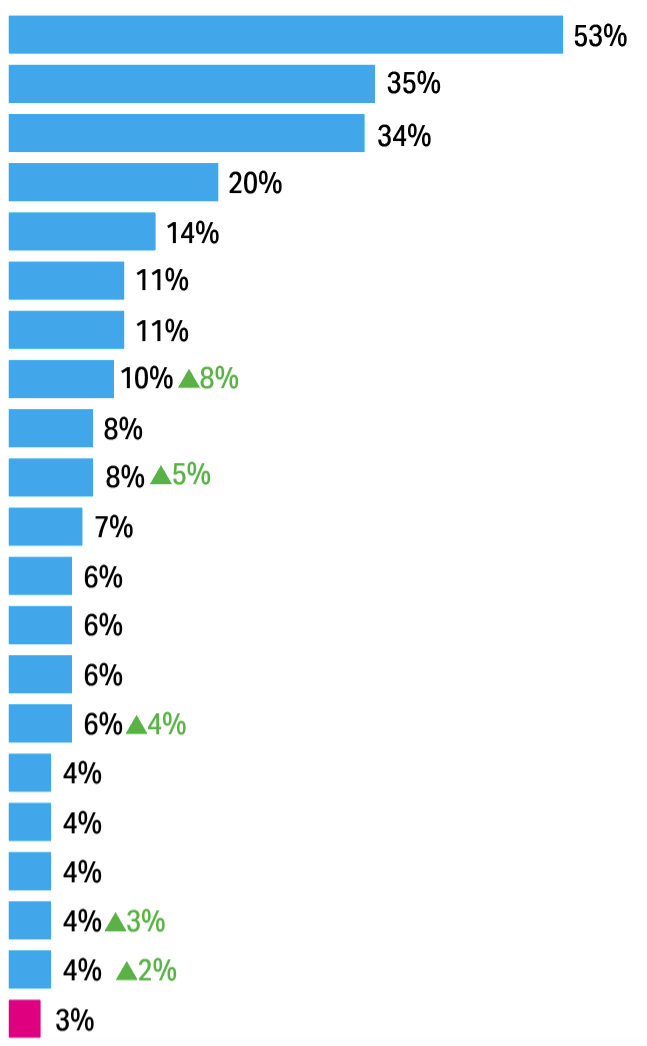
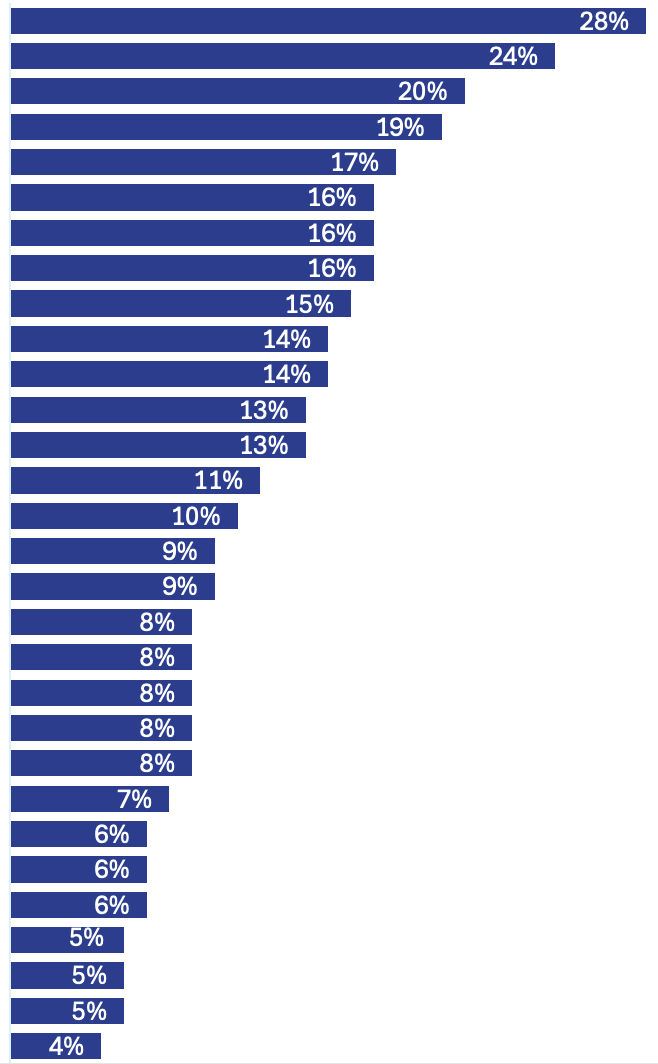
Price of products Variety of products offered Loyalty/rewards program Products I need are in-stock Quality of prepared food Healthier/better-for-you items Cleanliness of store Friendliness of employees Variety of prepared food/beverages Local or Canadian-made products Look and feel of store Speed of shopping trip Helpfulness of employees Larger package sizes/more bulk items Organization of the store Coffee program Fun to shop Self check-out/contactless shop options Commitment to sustainability/recycling Delivery Embraces cutting-edge technology
Areas Where Convenience Stores Must Improve to Encourage More Shopping
Likelihood to Visit Different Store if Items Unavailable at Current Store Shopped
Not Very/Not At All Likely
38%
Somewhat Likely
Extremely/Very Likely
Price of products Products I need are in-stock Loyalty/rewards program Variety of products offered Store cleanliness and hygiene General convenience
Fun to shop Offers delivery Availability of self check-out/contactless shopping Look and feel in terms of design Offers curbside pick up Embraces cutting-edge technology
(n= # of shoppers that rated service/excludes those that selected ‘not applicable’)
New in 2025
Tracking Behaviours
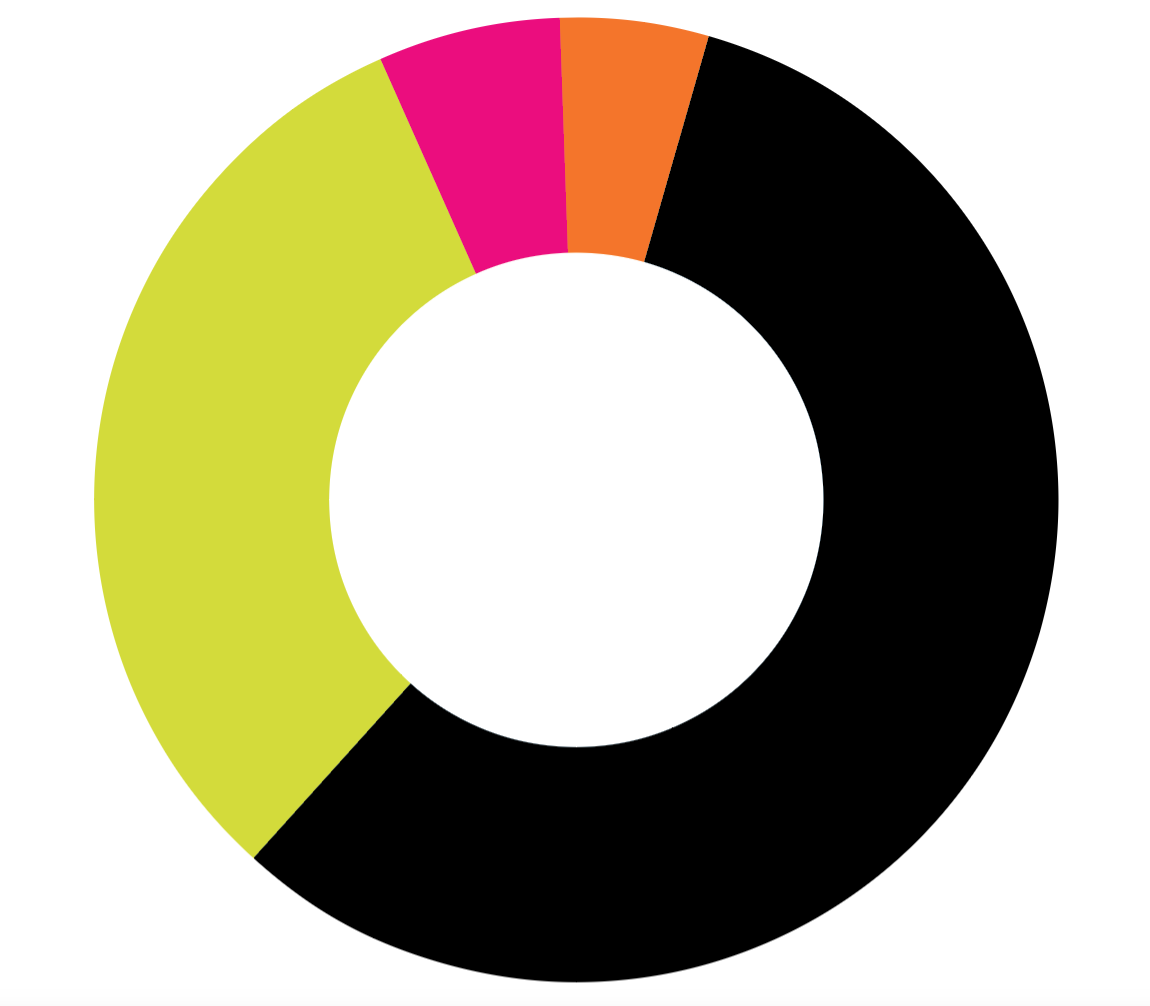
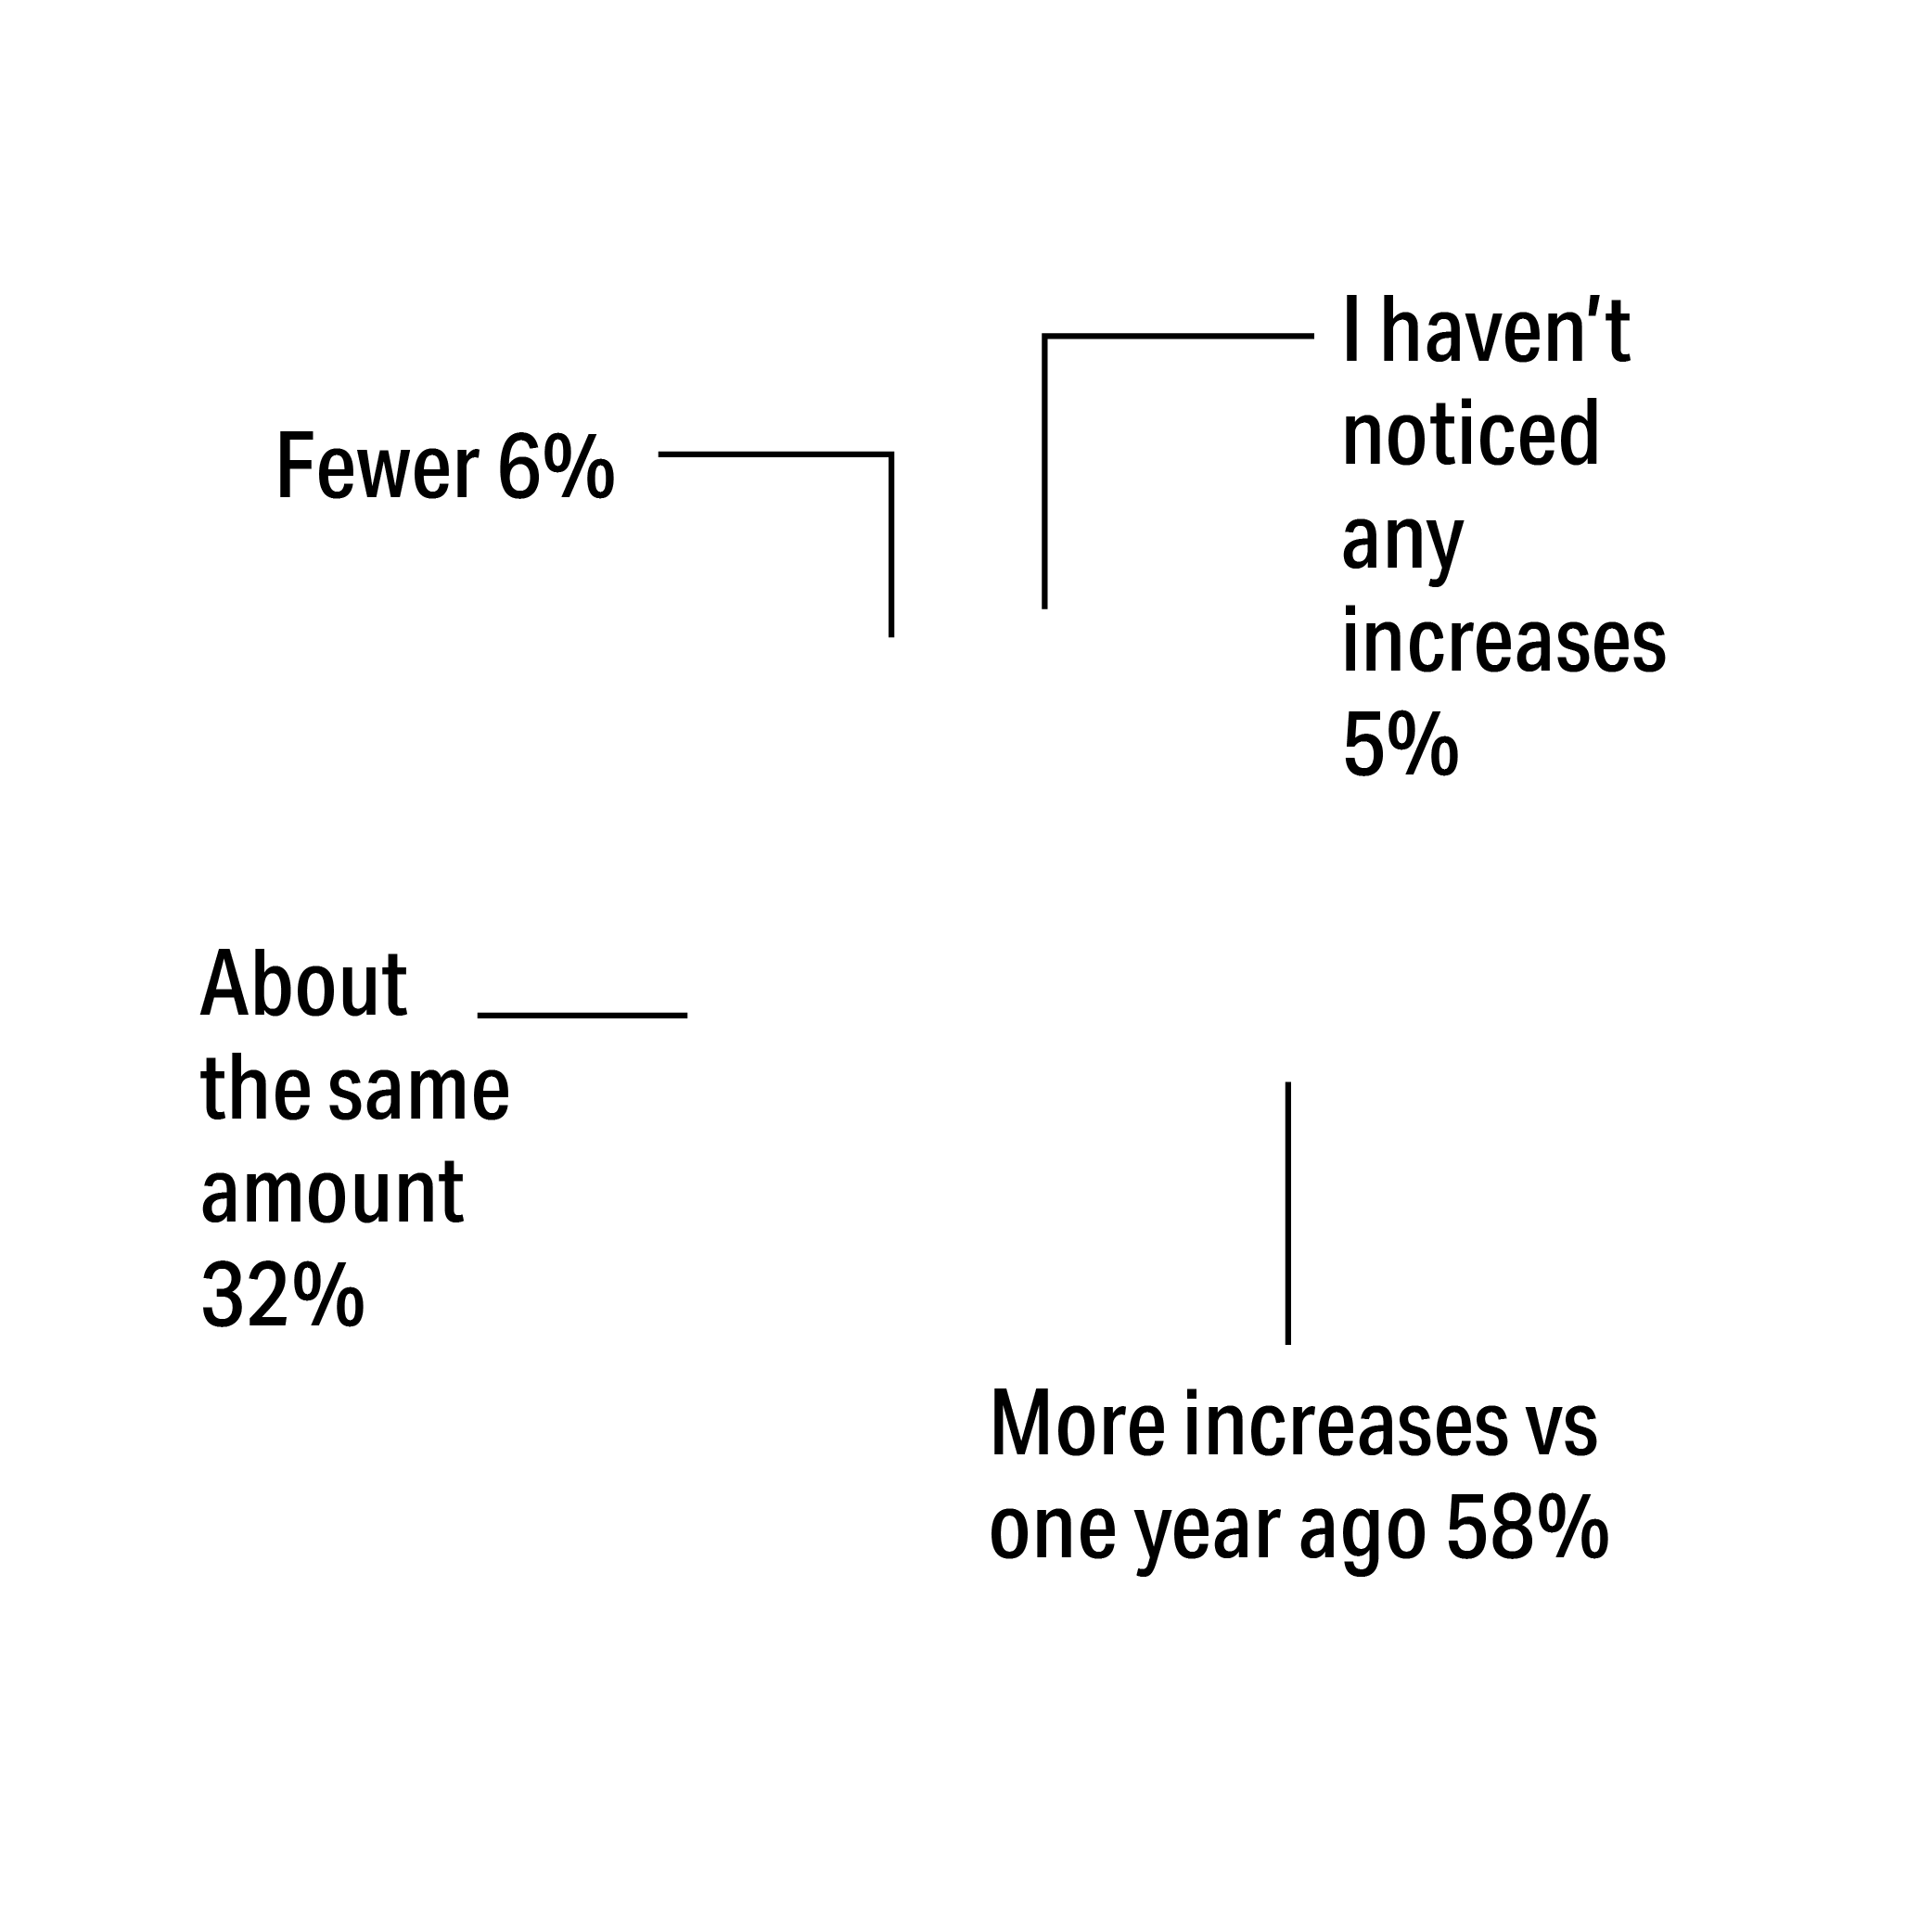
For the first time, we asked shoppers: “Compared to one year ago, when shopping at convenience stores, how often are you noticing price increases/higher prices on items that you usually purchase?” and “When a product you wanted to purchase at a convenience store is too expensive, what have you done instead?” No surprise, most shoppers say they’ve observed more price increases compared to a year ago. What’s alarming, however, is that when faced with a product that's, in their evaluation, too expensive at a convenience store, the two most common responses are leaving without making a purchase or choosing to shop at a different store, resulting in lost sales.
Frequency Noticing Higher Prices on Items Typically Purchased vs. Year Ago
Action Taken When Desired Product Too Expensive at Convenience Store
Left without making a purchase Went to a different store instead Purchased it anyway because I needed it Purchased the same product type, less expensive brand Purchased a different product type instead Purchased the same product, but private label None of the above
40% 30% 23% 19% 19% 15% 5%
Spending Unpacked
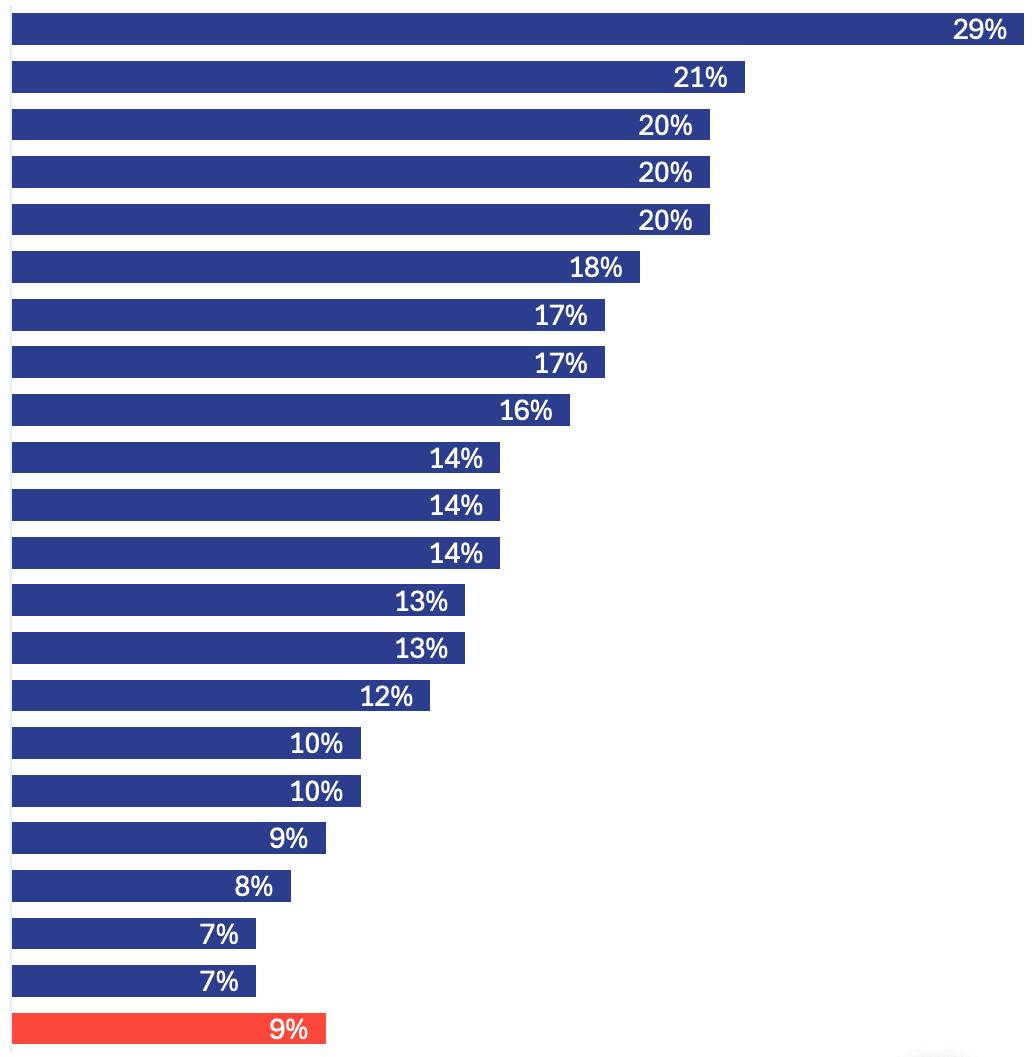
Among the top occasions for shopping at c-stores, almost half of shoppers cited buying gas, followed by nearly one-third who mentioned late-night snacking or running errands. Gen Z is leading the charge in late-night snacking, with 35% hitting their local c-store for a late-night nosh, compared to the average of 31%. Overall, there’s a notable uptick in visiting during business travel compared to last year (11% vs. 9%), with gen Z and millennials leading these occasions at 14%. As mentioned, fuel visits are on the rise, likely a reflection of more people commuting to and from work. This makes sense, too, as researchers note a shift in mid-day visits, “shopping by daypart remains steady, with trips peaking in the late afternoon/early evening. However, lunch visits have significantly increased compared to one year ago.”
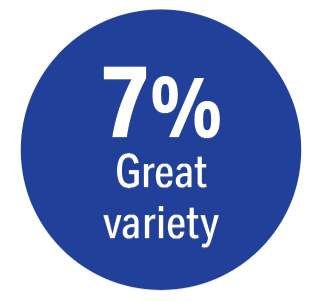
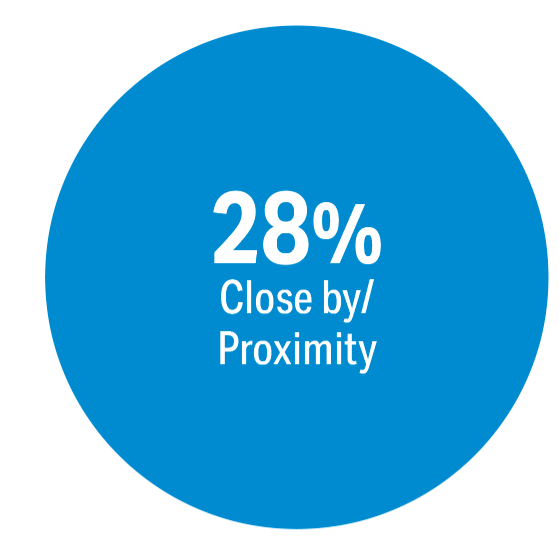
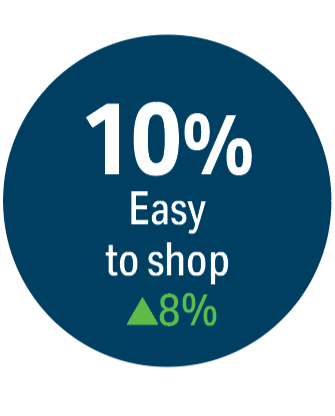
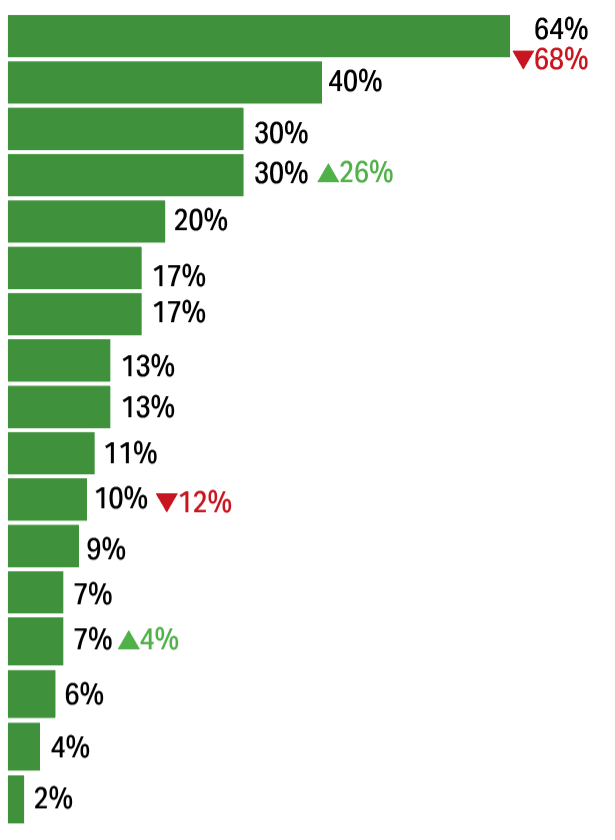
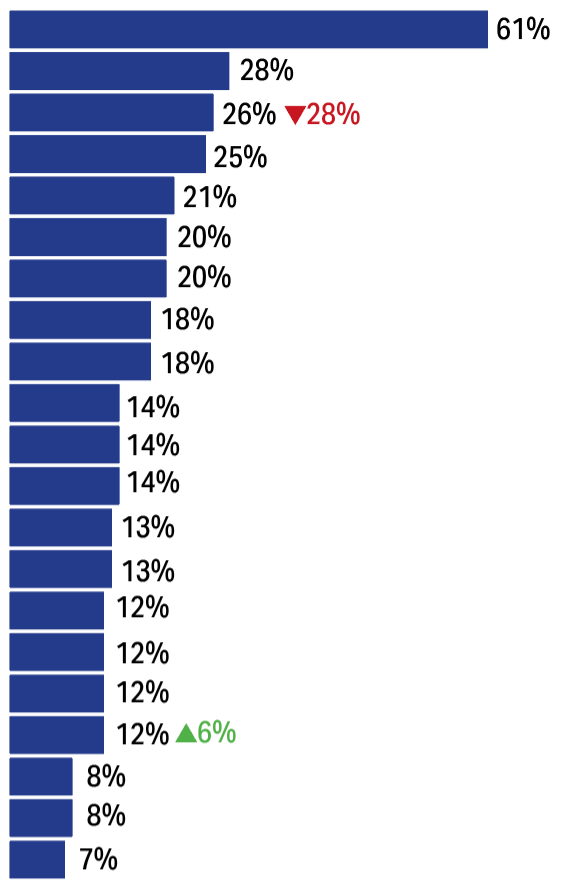
Factors Influencing Convenience Store Visit
Occasions Typically shop at Convenience Store
Proximity/close by To purchase gas Longer hours Loyalty program Products I can’t buy anywhere else Coupon Quality of foodservice Word of mouth Gas price app Self check-out/contactless shopping Mobile app offer Social media promotion/messaging Private label brands Drive-thru Mobile ordering Email Outdoor ad Text message Radio or TV advertisement Curbside pickup None of the above
46% 31% 30% 27% 26% 25% 22% 19% 12% 11% 11% 8%
In-store only Gasoline only Both gasoline and in-store
To purchase gas Late-night snacking Running errands Special trips from home Afternoon snack/break Traveling for pleasure Traveling to/from work/school To purchase hot bev/breakfast To purchase lunch While working from home Traveling for business To purchase dinner
9%
17%
25%
26%
34%
33%
16%
22%
Time of Day When Typically Shop at Convenience Stores
6am-8:59am
9am-10:59am
11am-1:59pm
2pm-3:59pm
4pm-6:59pm
7pm-9:59pm
10pm or later
Reasons Choose to Not Shop In-Store at Convenience Stores
36%
“If I don’t need to buy anything, I don’t go in."
“Usually, I am just getting gas and then on my way.”
“Paying for my fuel at the pump is convenient.”
”I like to pay directly at the pump for time savings.”
“C-stores typically offer only a limited range of items.”
“I prefer larger grocery stores.”
“Sometimes there’s ‘sketchy’ people inside.”
“Because as a woman, I don’t feel safe.”
No reason to/don’t need items sold in-store
6%
Too busy/no time to go in-store
Items too expensive/better prices at other stores
“Too expensive! Only use in emergencies!”
“C-stores are way more expensive.”
18%
Only purchase gas/pay at pump
Limited selection/ prefer other stores
Safety/unpleasant
TYPES OF TRIPS
76%
32%
4%
Quick in-and-out Less than 5 minutes
Browse a bit 5 – 15 minutes
Hang out, eat and drink at store Over 15 minutes
Special promotion (e.g., BOGO, bundle deal) Checkout counter sign or display Shelf signage Window signage Freestanding floor or aisle display Product samples or demos Wall posters or signage Cooler stickers Ceiling banners or signage Digital display or video Floor stickers In-store audio or radio None of the above
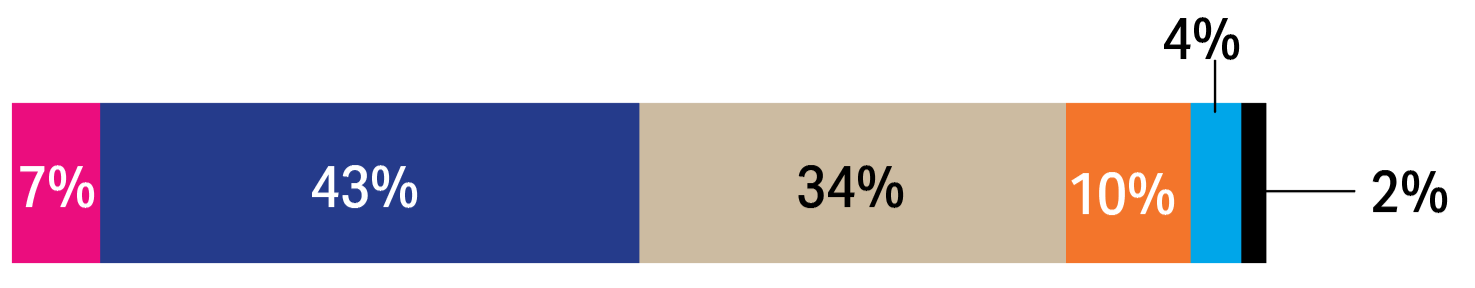
Aspects that Influence Purchase Decision When Shopping In-Store
Frequency of Unplanned Purchases at Convenience Store
All of the time
Most of the time
Some of the time
Rarely
Never
10%
45%
Reasons Purchasing ‘More” at Convenience Stores
7%
Driving More/To Purchase Fuel
Closer to home | Stop on way to work | Easier to access
Responding to Lifestyle Changes
Moved to new location | Changes in job or lifestyle | Family changes (more adults, having a baby)
Availability of specific items (alcohol, snacks, energy drinks) | Wider range of products than before | New products/exclusive items
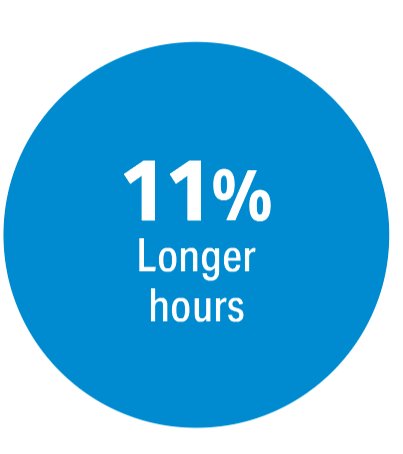
Fits better with personal schedule | Open late or 24-7
Seen as more affordable for certain items | Special promotion/deal | Loyalty program
12%
Product Availability/ Variety
Longer Hours of Operation/24-7
Cost/Value
Close/Proximity
Time Savings
Combined with fuel stop | Saves on fuel costs for longer trips
Quicker than going to larger stores | Fast for small purchases
Reason for Recent Impulse Purchase at Convenience Store
To treat myself On sale/promotion To avoid going to another store Looked too good to pass up To treat someone else New item I want to try Curious about new flavour/variety Child with me asked to purchase Limited time offer/seasonal Item I wanted was not available Employee recommendation Item I wanted was too expensive Recommendation from someone I know
43%
19%
11%
Spending Habits Unpacked
BevAlc Boon
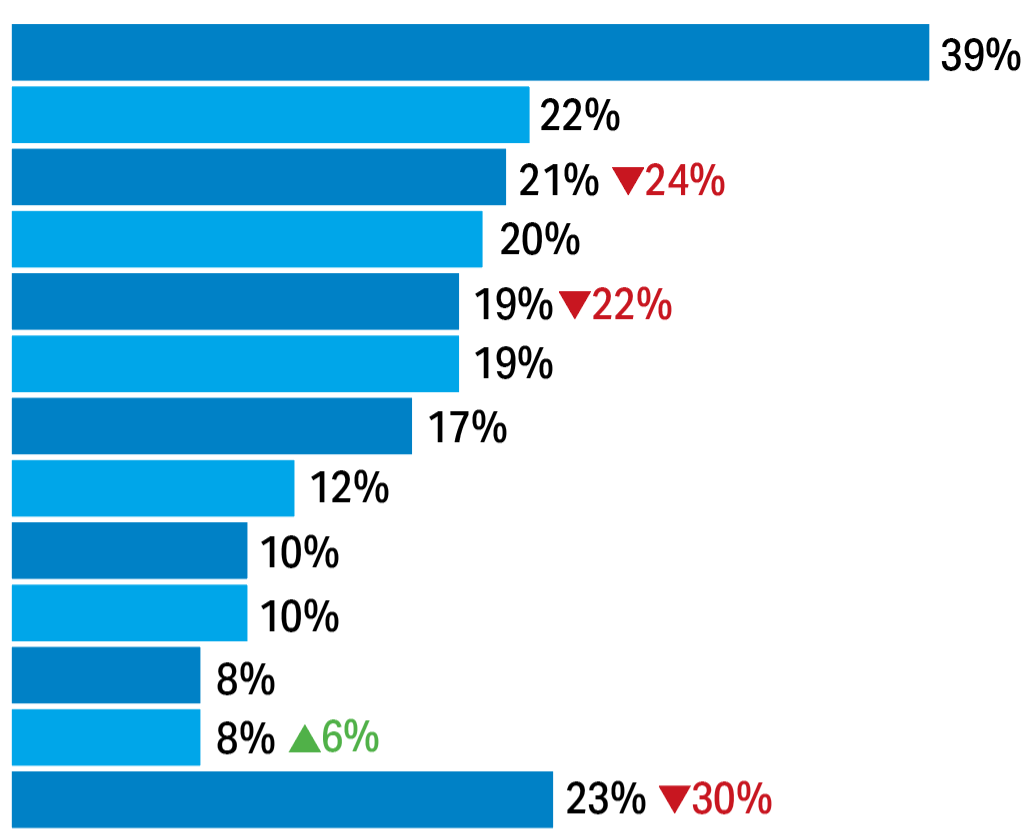
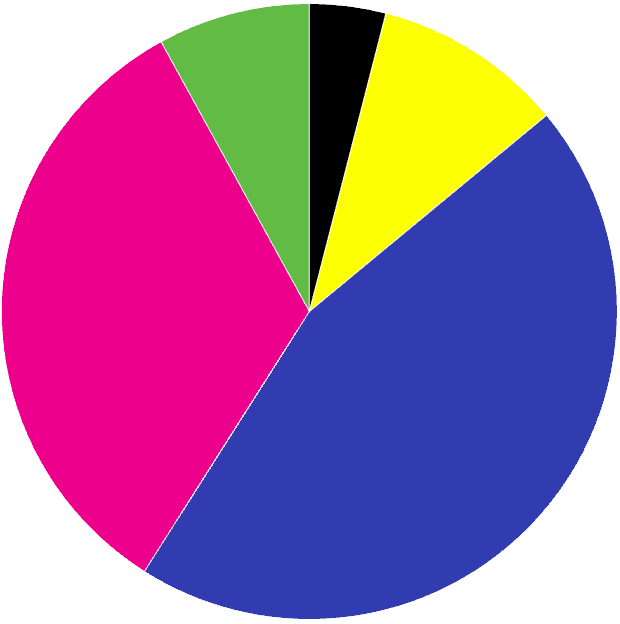
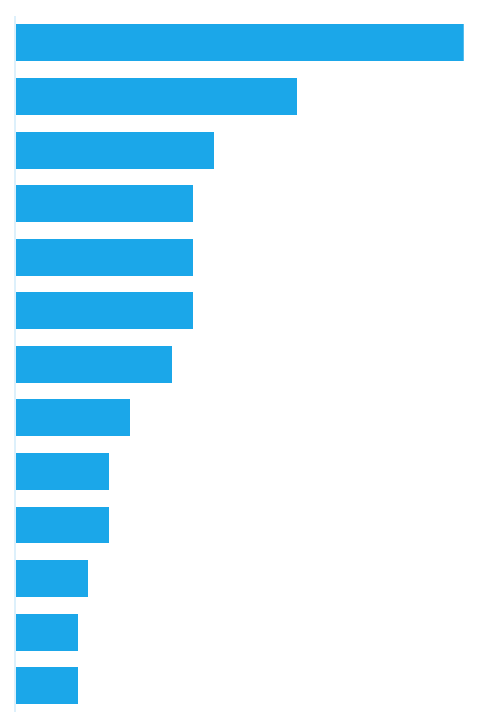
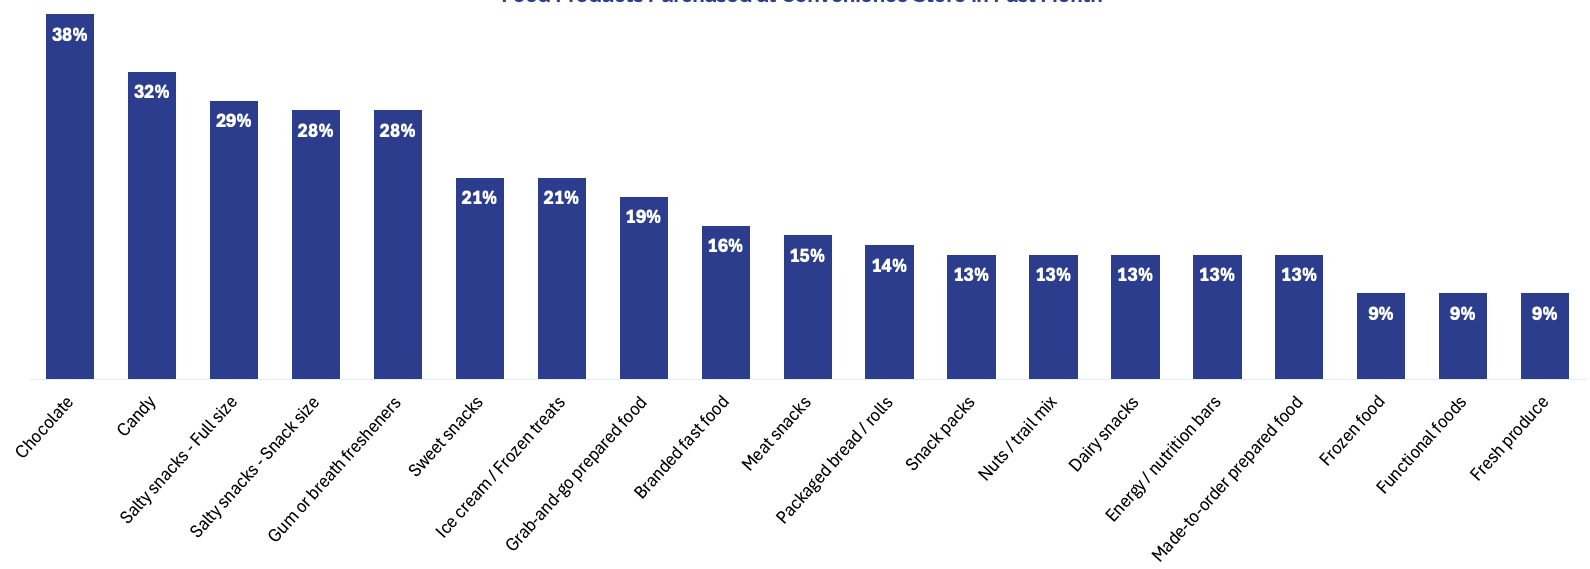
Food products purchased at convenience store in past month
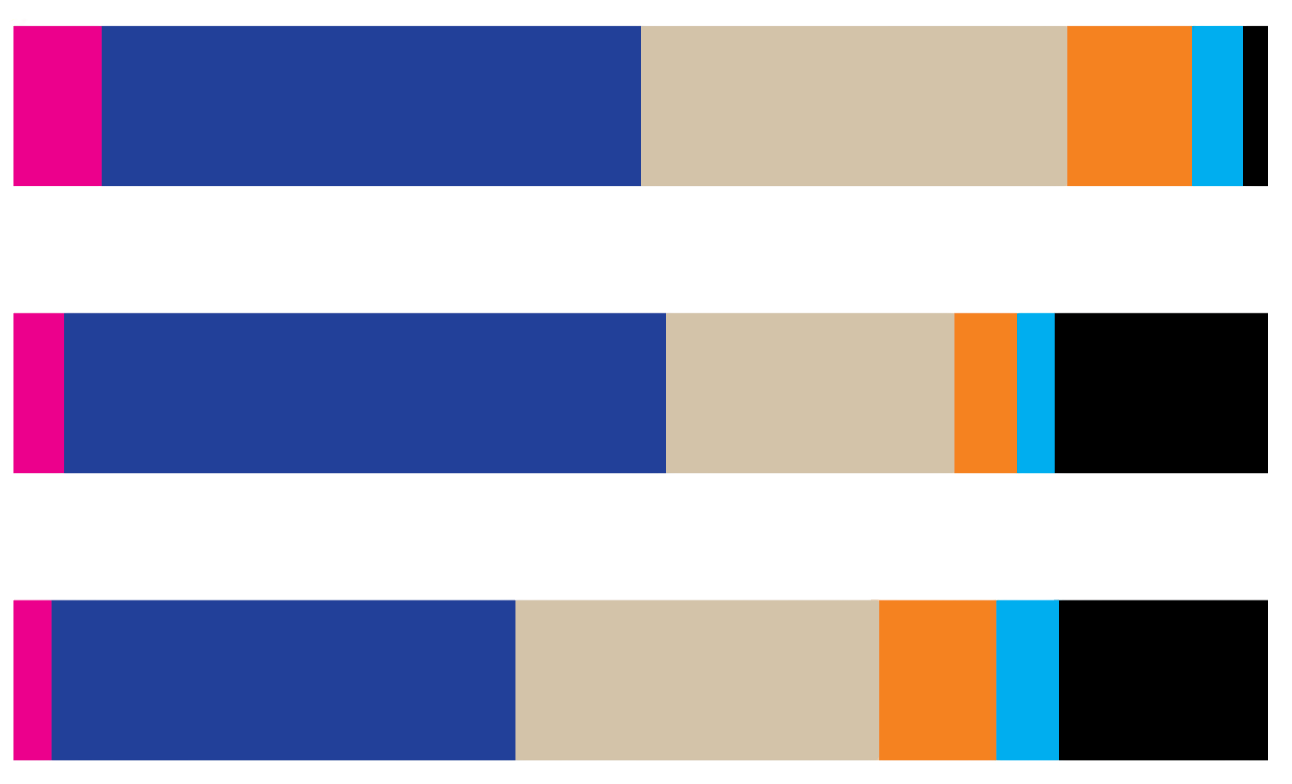
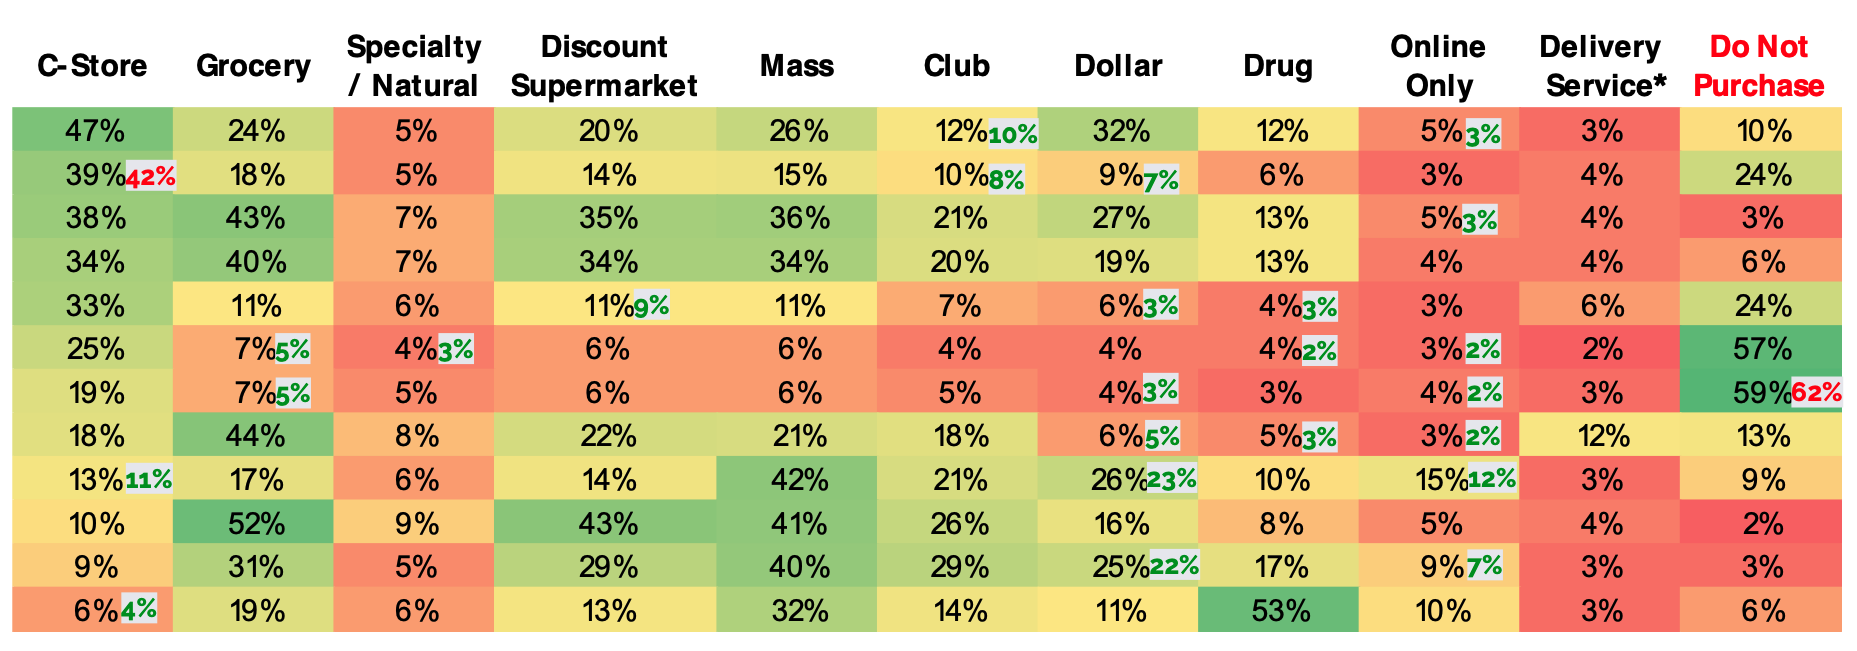
Supercentres/Mass Online stores Grocery store Dollar store Club Discount supermarket Drug store Convenience store Local independent stores Specialty/Natural store No influence
Candy/Gum Cold/Frozen dispensed bevs Packaged snacks Packaged beverages Hot dispensed bevs Cigarettes Other tobacco Prepared food General merchandise Edible grocery Non-edible grocery Health and beauty
Channels where shoppers purchase items in typical month
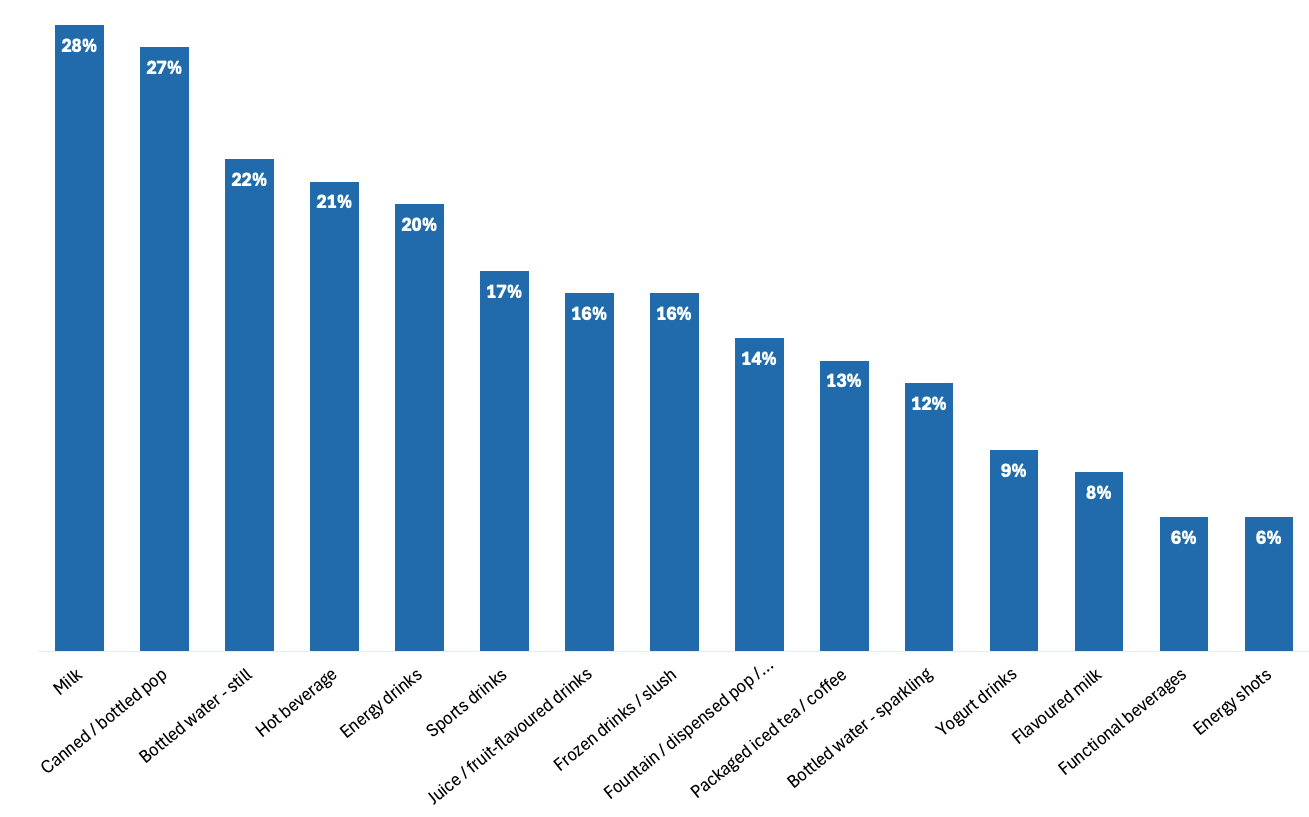
Beverage products purchased at convenience store in past month
Types of foods selected at convenience stores remain consistent with last year, but made-to-order prepared food purchases have risen significantly, with millennials (16%), as well as shoppers in British Columbia (19%) and Atlantic (17%) driving the shift.
Milk reclaimed the top spot among (non-alcoholic) beverage types purchased in the past month, just slightly ahead of canned and bottled pop, which saw a significant decline compared to last year.
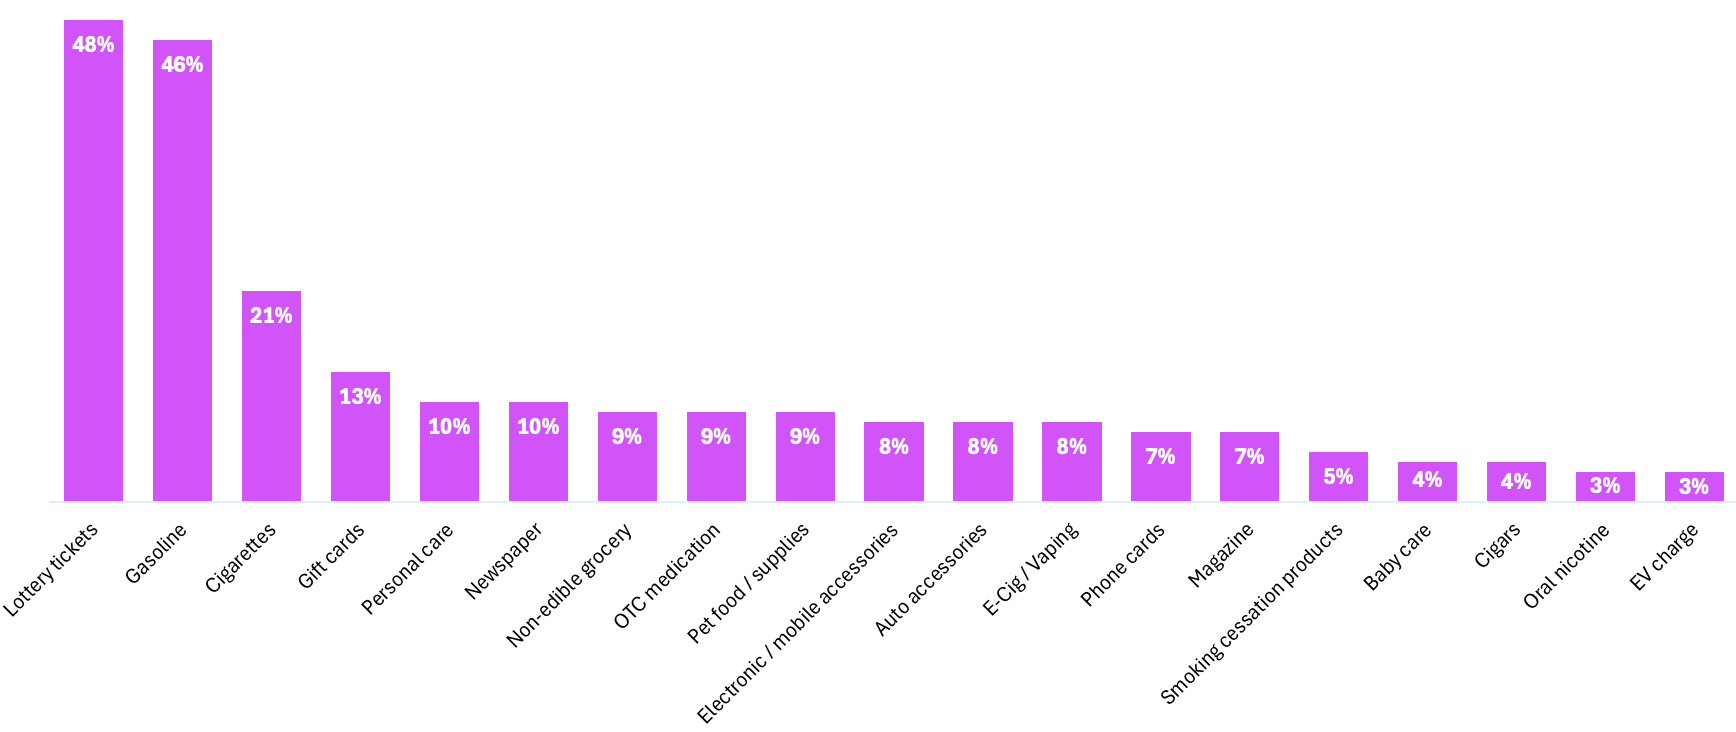
Non-foods products purchased at convenience store in past month
Non-consumable products have delivered growth since last year, with significant increases in lottery, gasoline, pet supplies, e-cigarettes and cigars.
44%
42%
3%
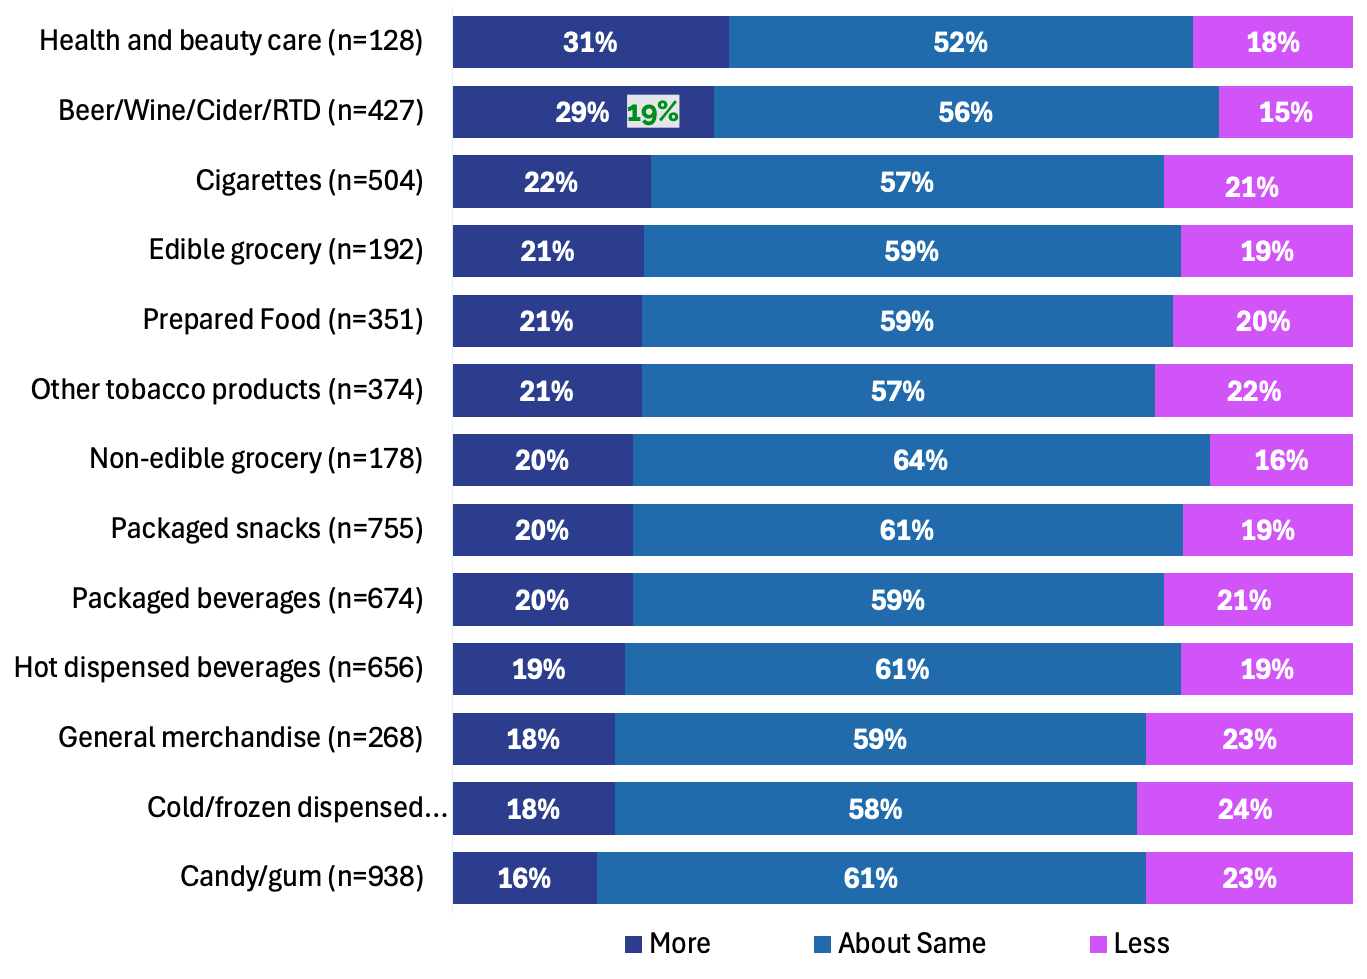
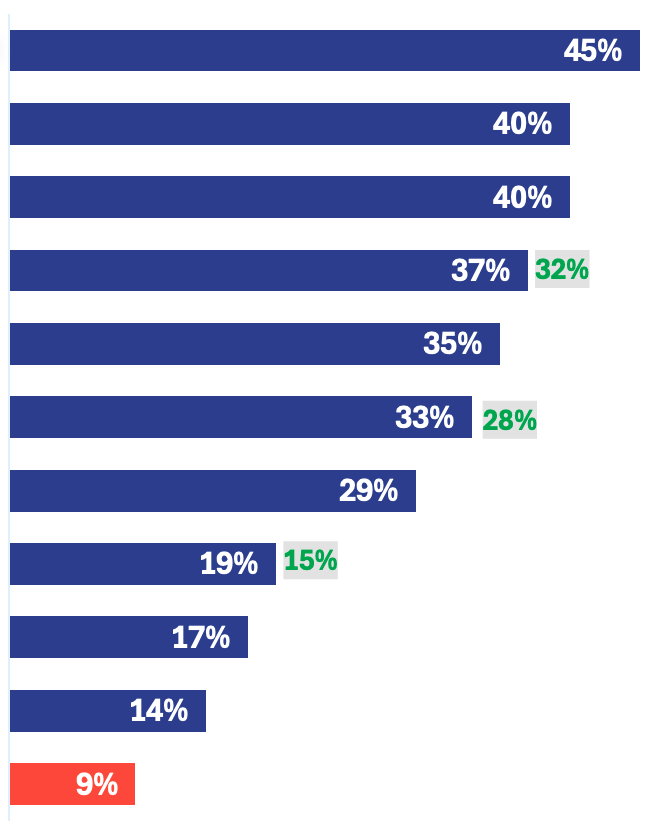
Convenience experienced a growth in share for general merchandise and health and beauty over the past year.
Purchase frequency of items at convenience store today vs last year
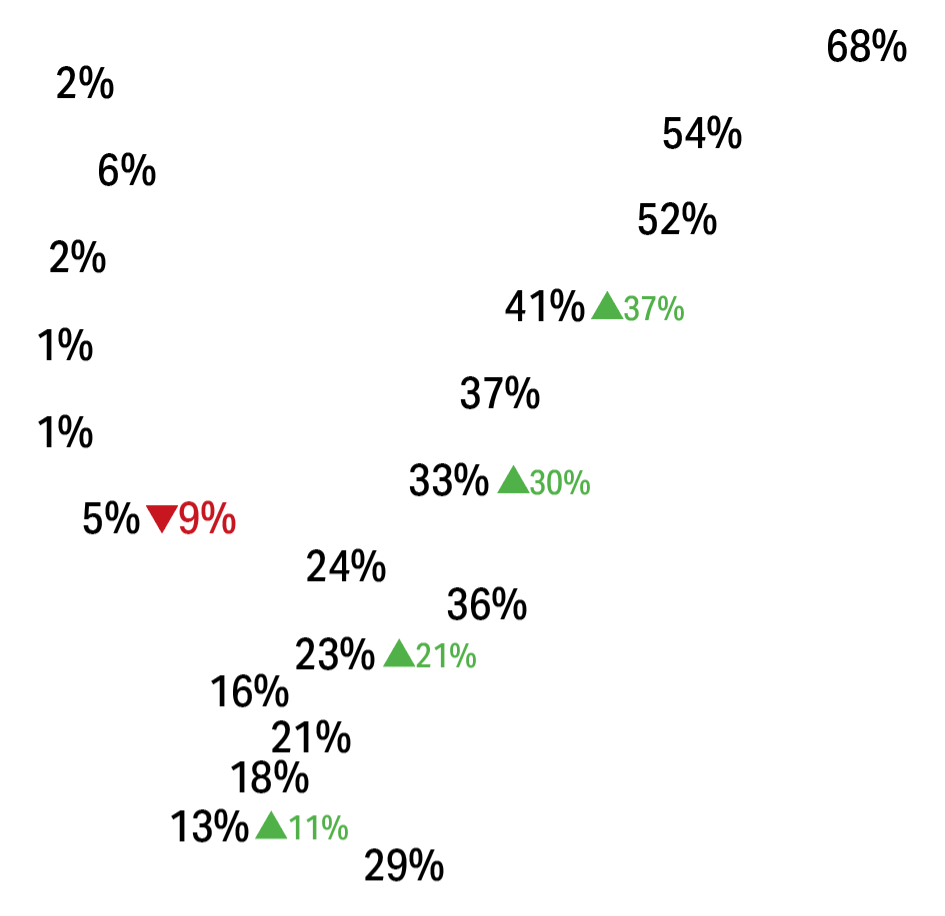
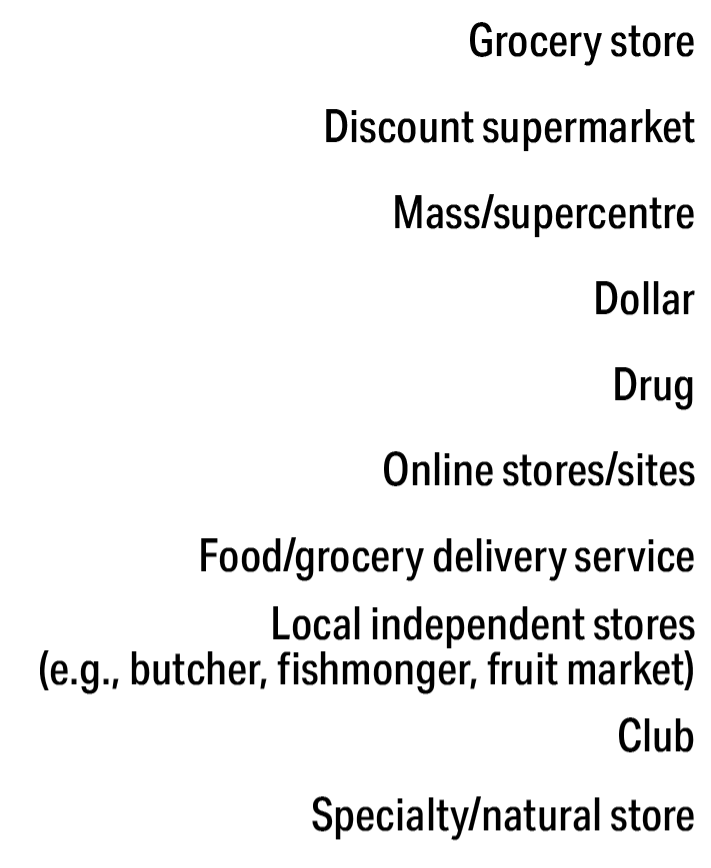
Store types shopped to discover new products
Nine in 10 shoppers are motivated to visit specific stores for the chance to discover new products. Convenience was one of only three formats to see significant growth in this trend over the past year. It’s worth noting that for generation Z (24%) and millennials (24%), c-stores are a significant destination for discovering new products, compared to gen X (16%) and boomers (8%).
Preferred types of new products at c-stores
Many shoppers value unique or limited-edition flavours and products that cater to convenience and novelty, highlighting the opportunity for convenience stores to be seen as hubs for quick, diverse and interesting items.
BEVERAGES
SALTY SNACKS
SWEET SNACKS
NON-CONSUMABLE ITEMS
PREPARED/FRESH FOODS
8% Energy drinks 7% Soft drinks/Sodas 4% Coffee/Tea 4% Alcoholic bevs 3% Other drinks
19% Chips 4% Nuts and other
11% Candy 8% Chocolate
5% Health and beauty 4% Household items 3% Lottery 2% Electronics/Accessories 2% Automotive
6% Ready-to-eat meals 4% Bakery 3% Produce
(n=# of shoppers that purchase item at a convenience store in typical month)
Prepared food
Cold/frozen dispensed beverages (n=656)
Beverage Alcohol Boon
Nicotine News
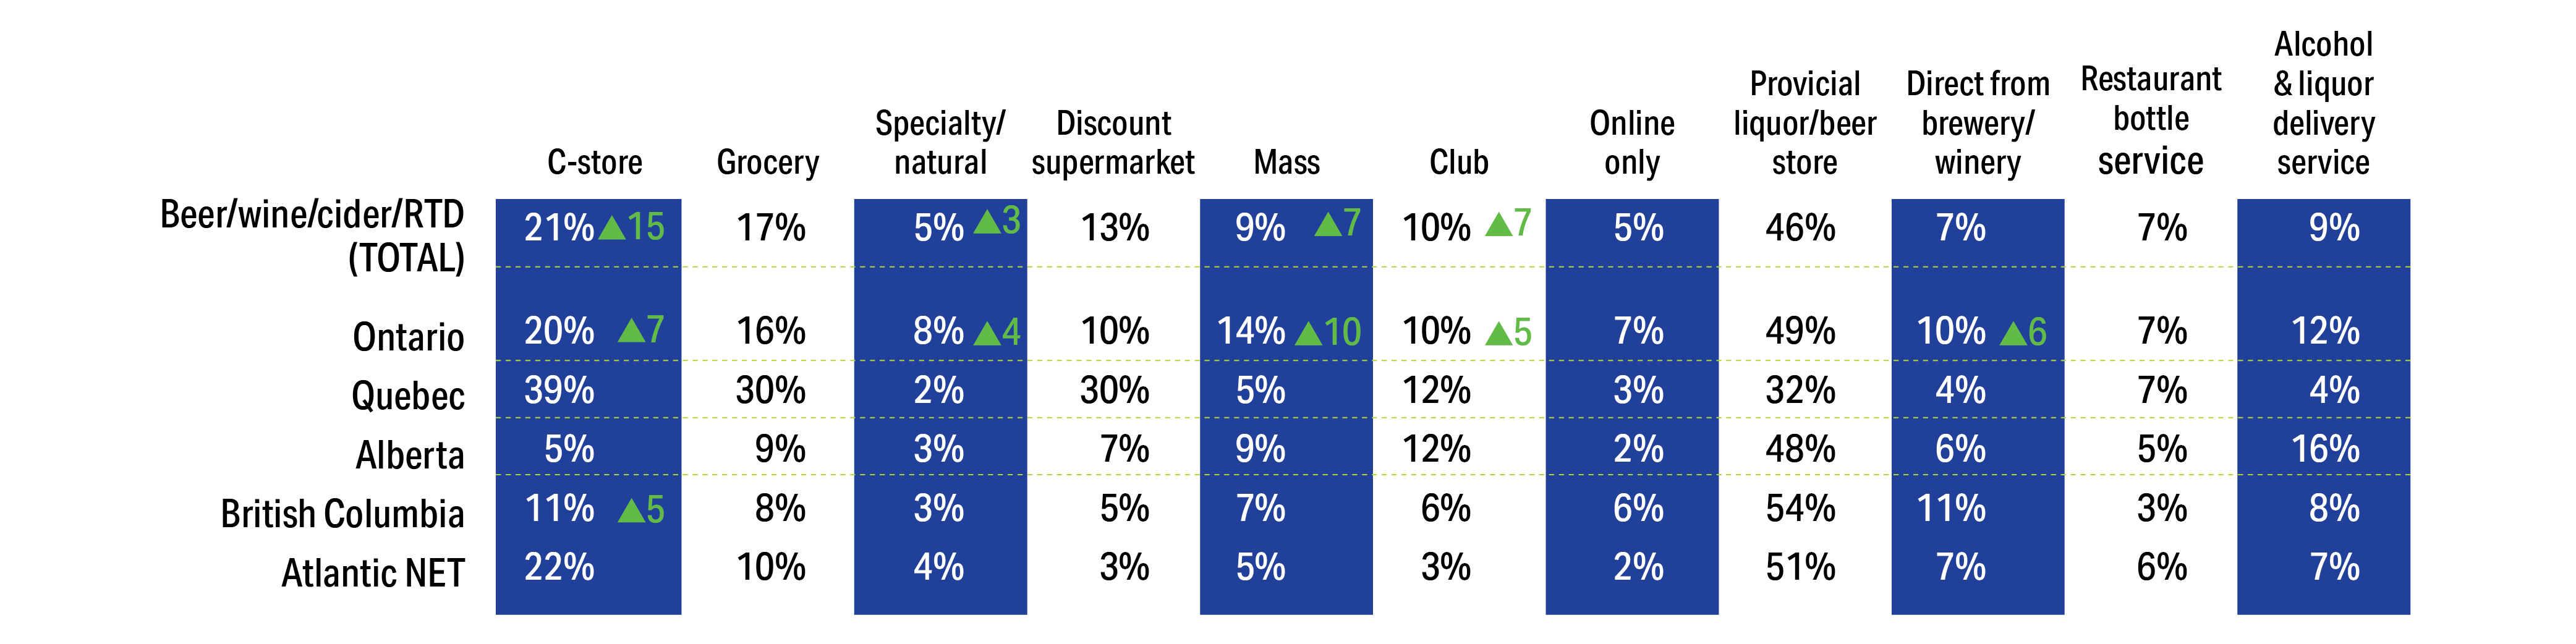
The percentage of convenience shoppers buying beer, wine, cider, or ready-to-drink cocktails in a typical month is up significantly (four points) compared to last year and convenience stores are second only to provincial liquor and beer stores when it comes to the preferred shopping destination. In the wake of the provincial government allowing c-stores to sell beer, wine, cider and RTD cocktails as of September 5, 2024, Ontario shoppers are driving much of these gains, with 20% saying they buy from convenience stores, compared to 7% a year ago (likely linked to LCBO Convenience Outlets or inter-provincial shopping). In addition, numbers are up in British Columbia, where 11% of shoppers say they turn to c-stores for beverage alcohol, compared to just 5% a year ago.
Channels Shoppers Purchase Beer/Wine/Cider in Typical Month
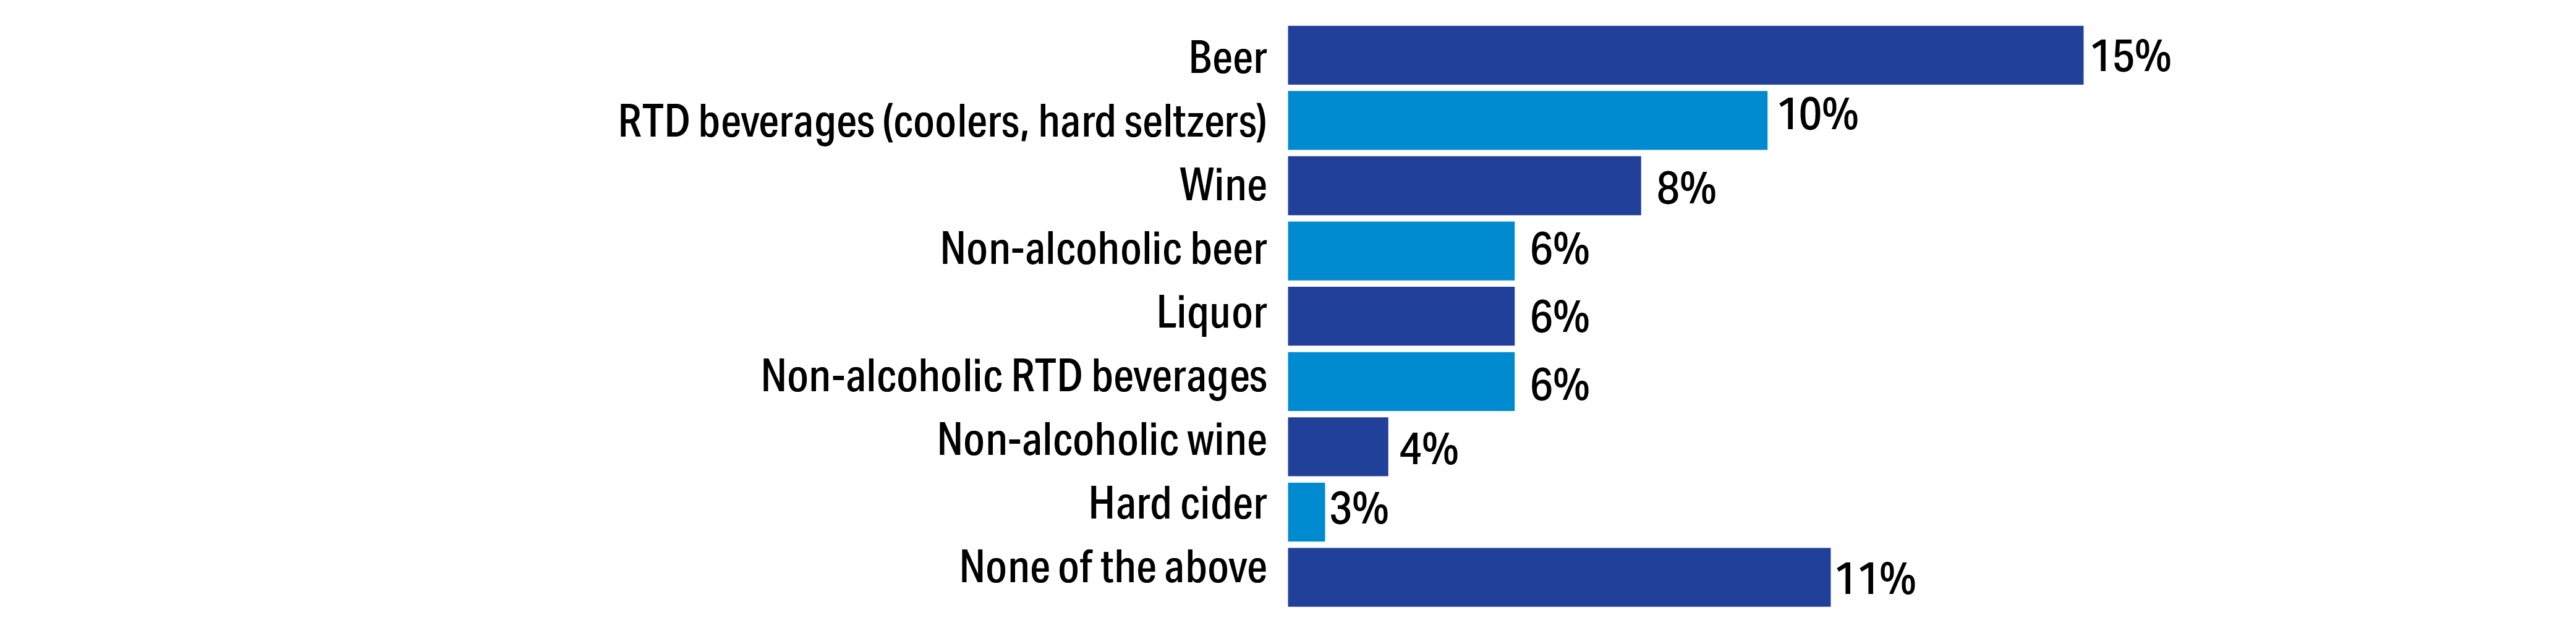
Alcoholic/Non-Alcoholic Products Purchased at Convenience Store in Past Month
53% 48% 36% 29% 24%
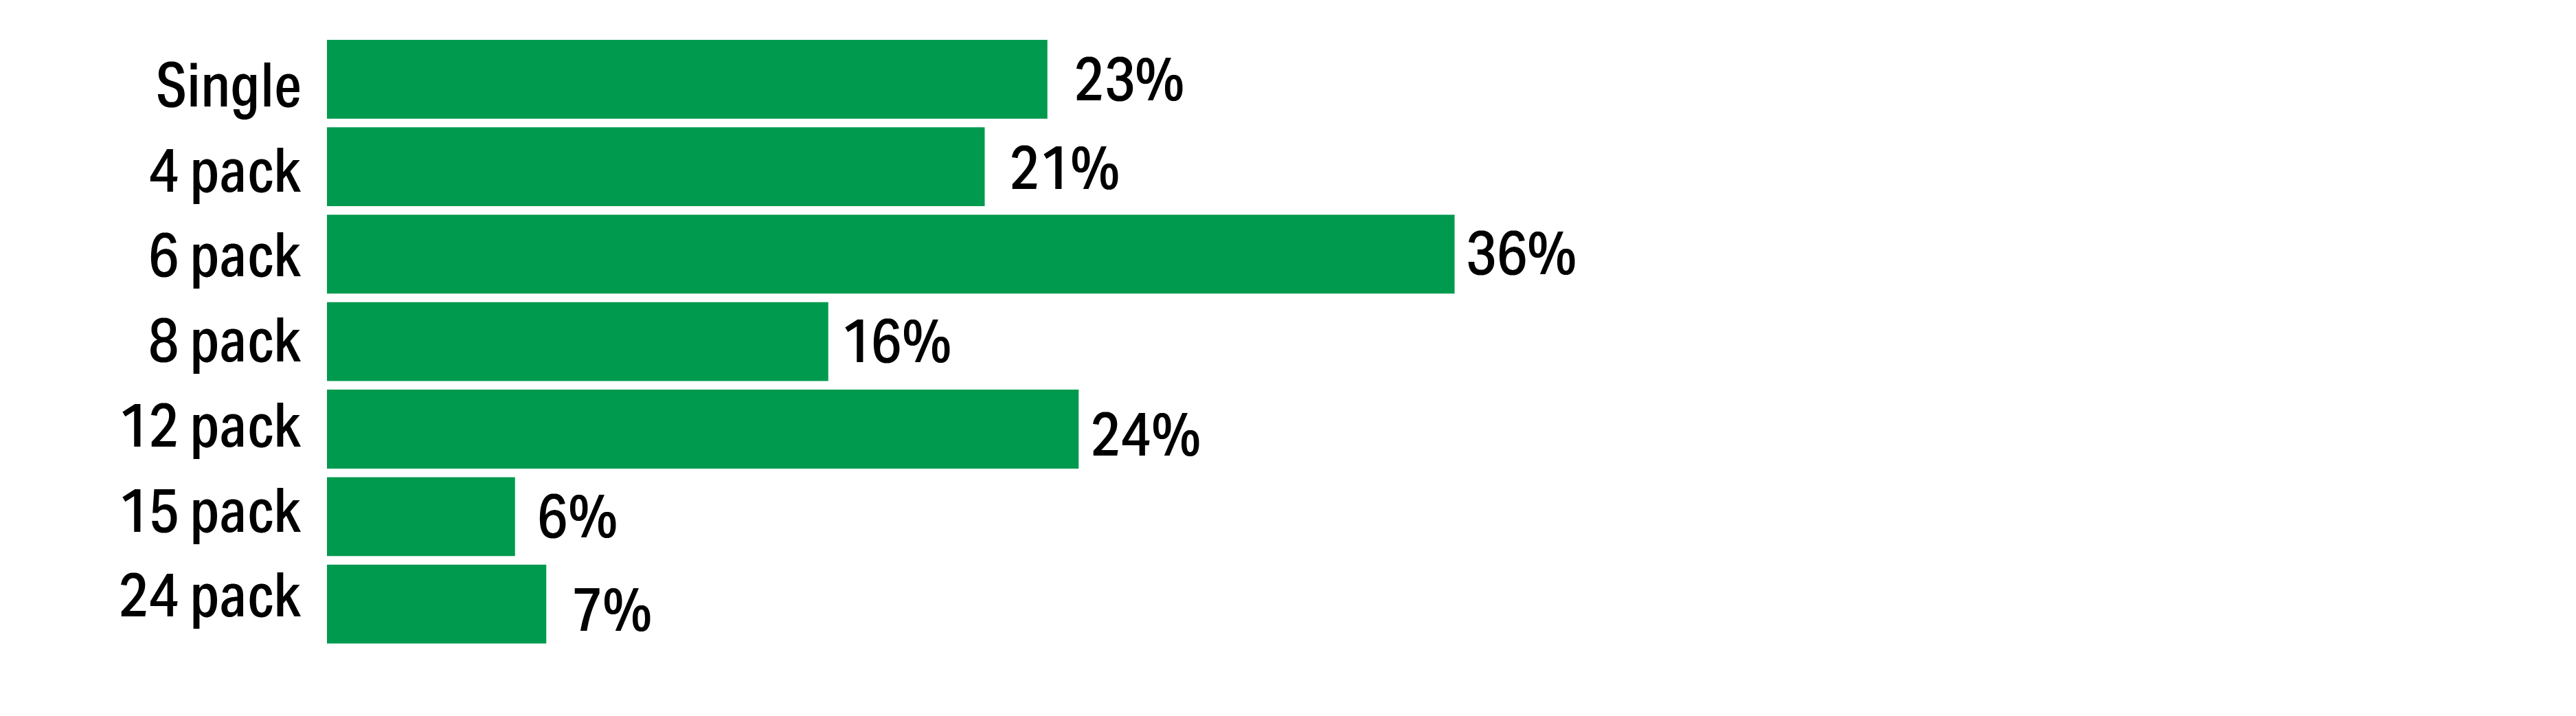
Package Type of Beer/Cider/ Coolers/Hard Seltzer/RTD Purchased
Convenience (one stop shop) Close proximity to home Faster service and less wait time Better prices Better variety
31%
Types of Beer Purchased at Convenience in Past Month
(e.g. Coors Light, Molson Canadian, Budweiser)
(e.g. Bud Light, Molson Ultra, Michelob Ultra, Sleeman Clear etc.)
(e.g. Labatt Blue, Busch Lager, Laker Lager, Pabst Blue Ribbon)
(e.g. Amsterdam, Big Rock, Hop Valley, Mill Street, Steam Whistle, Unibroue)
PREMIUM BEER
20%
NON-ALCOHOLIC/ LOW ALCOHOL BEER
37%
IMPORT BEER
(e.g. Corona, Stella Artois, Heineken, Guinness)
LIGHT BEER
35%
VALUE/EVERYDAY BEER
LOCAL/CRAFT BEER
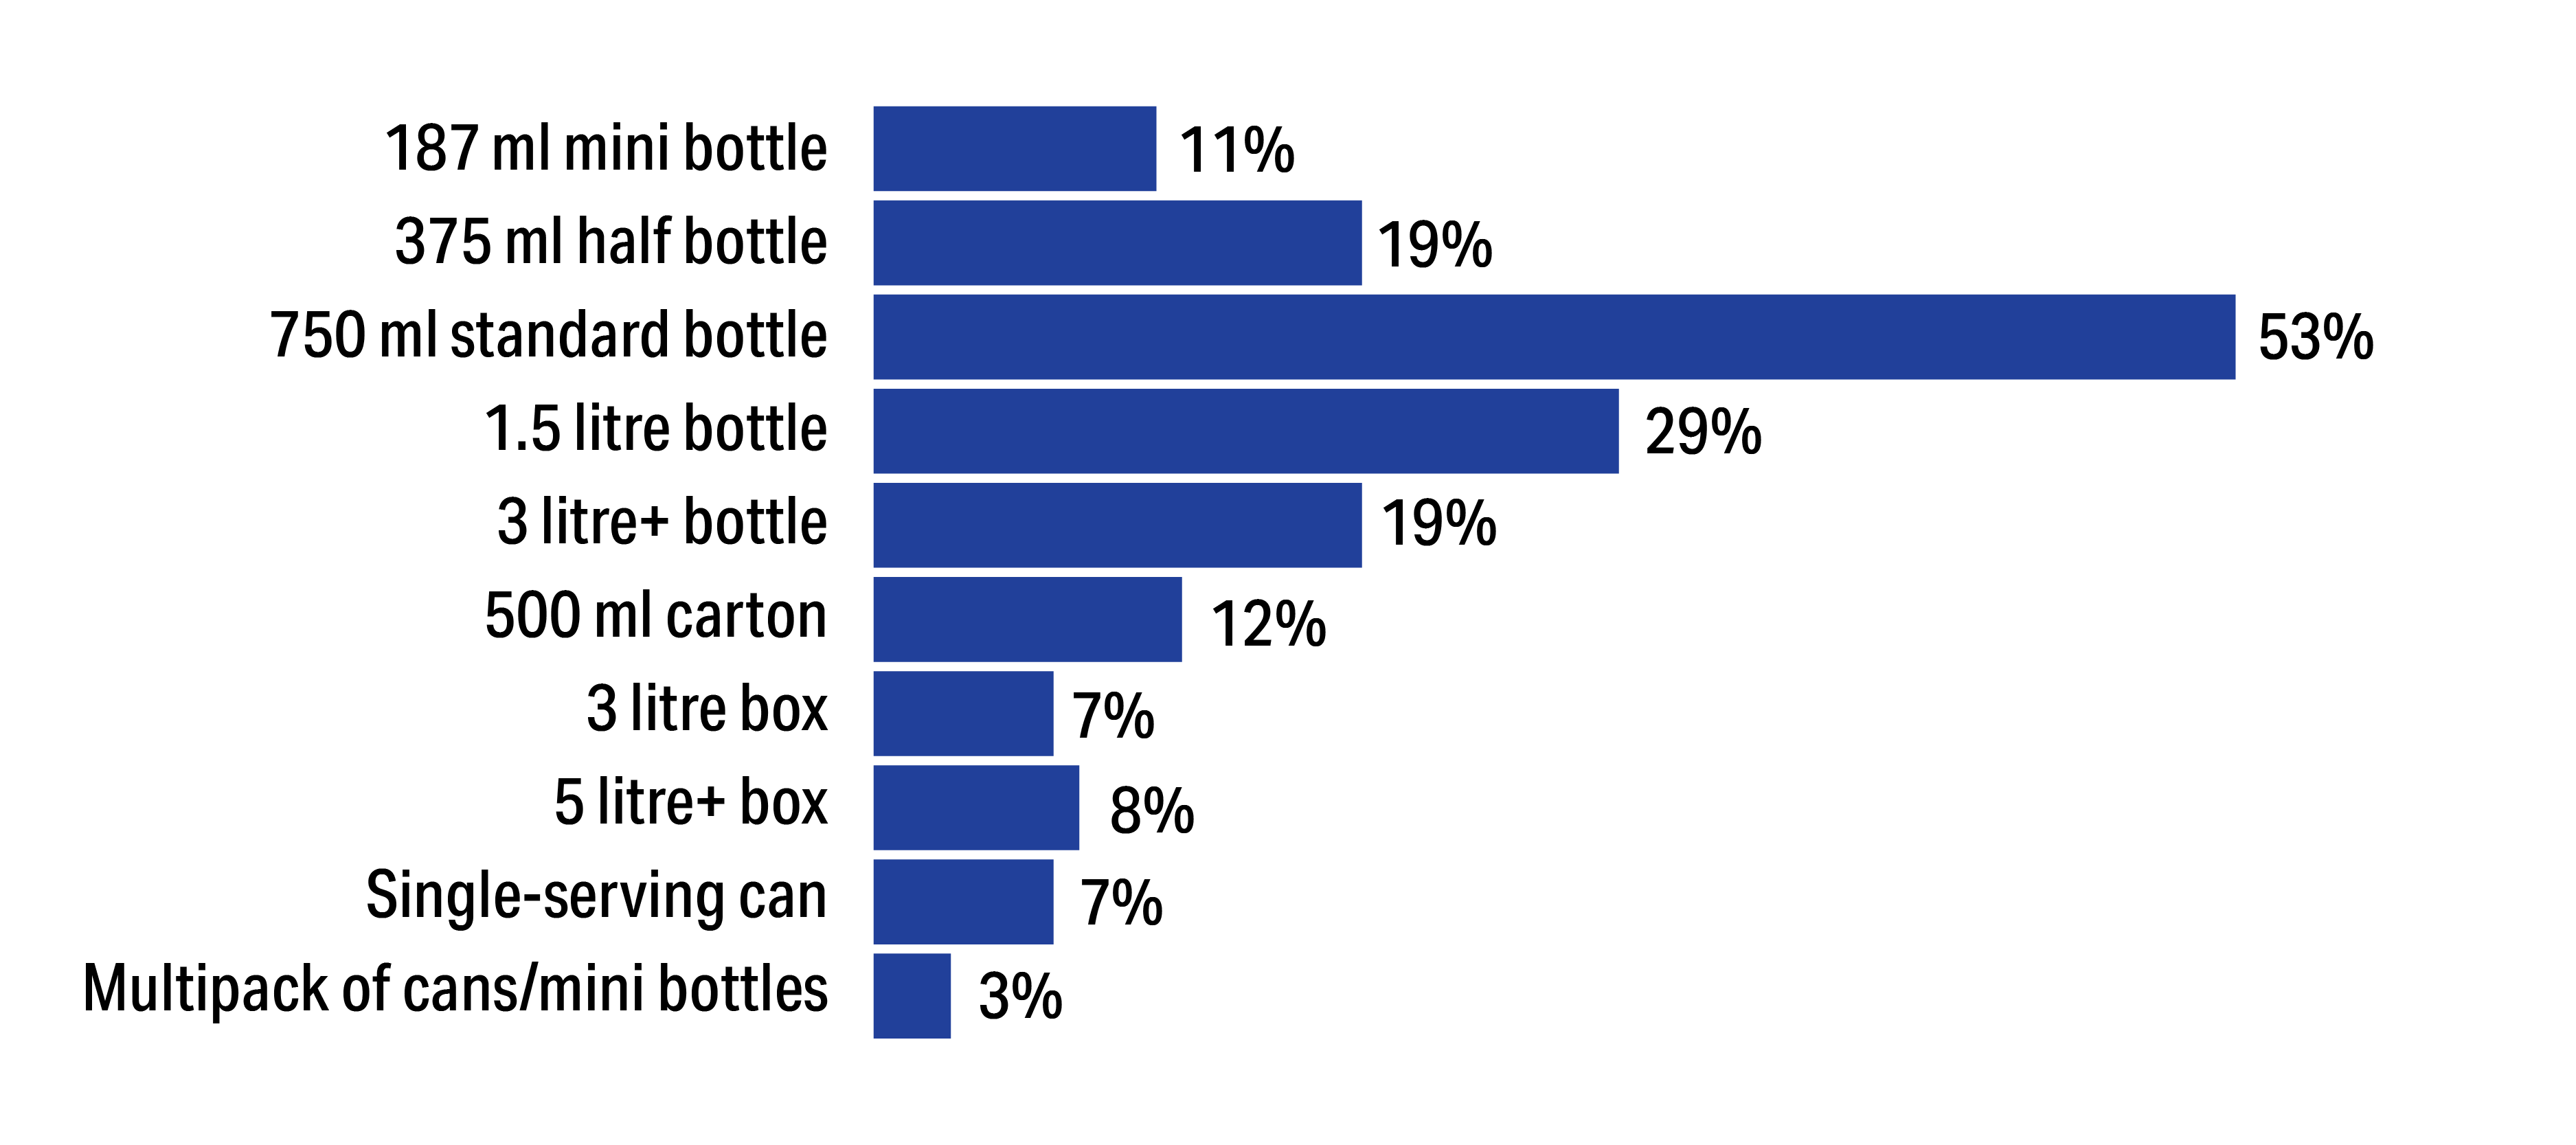
Size/Package Type of Wine Purchased
interest in beer/wine/cider availability at c-stores
My province allows beer/wine/cider at convenience stores
Yes, I would like to see beer/wine/ cider available
No, I would not like to see beer/wine/ cider available
(e.g. Budweiser Zero, Molson Exel, Coors Edge, Heineken O.O)
Reasons Purchased at Convenience Stores Over Alternative Store Types
My province allows: 64% Quebec 41% Ontario 27% Atlantic NET
Yes, I would like to see available (by province): 60% British Columbia 51% Atlantic NET 50% Alberta 43% Ontario 29% Quebec
Why Beer/Wine/Cider/ Coolers Should Be Available
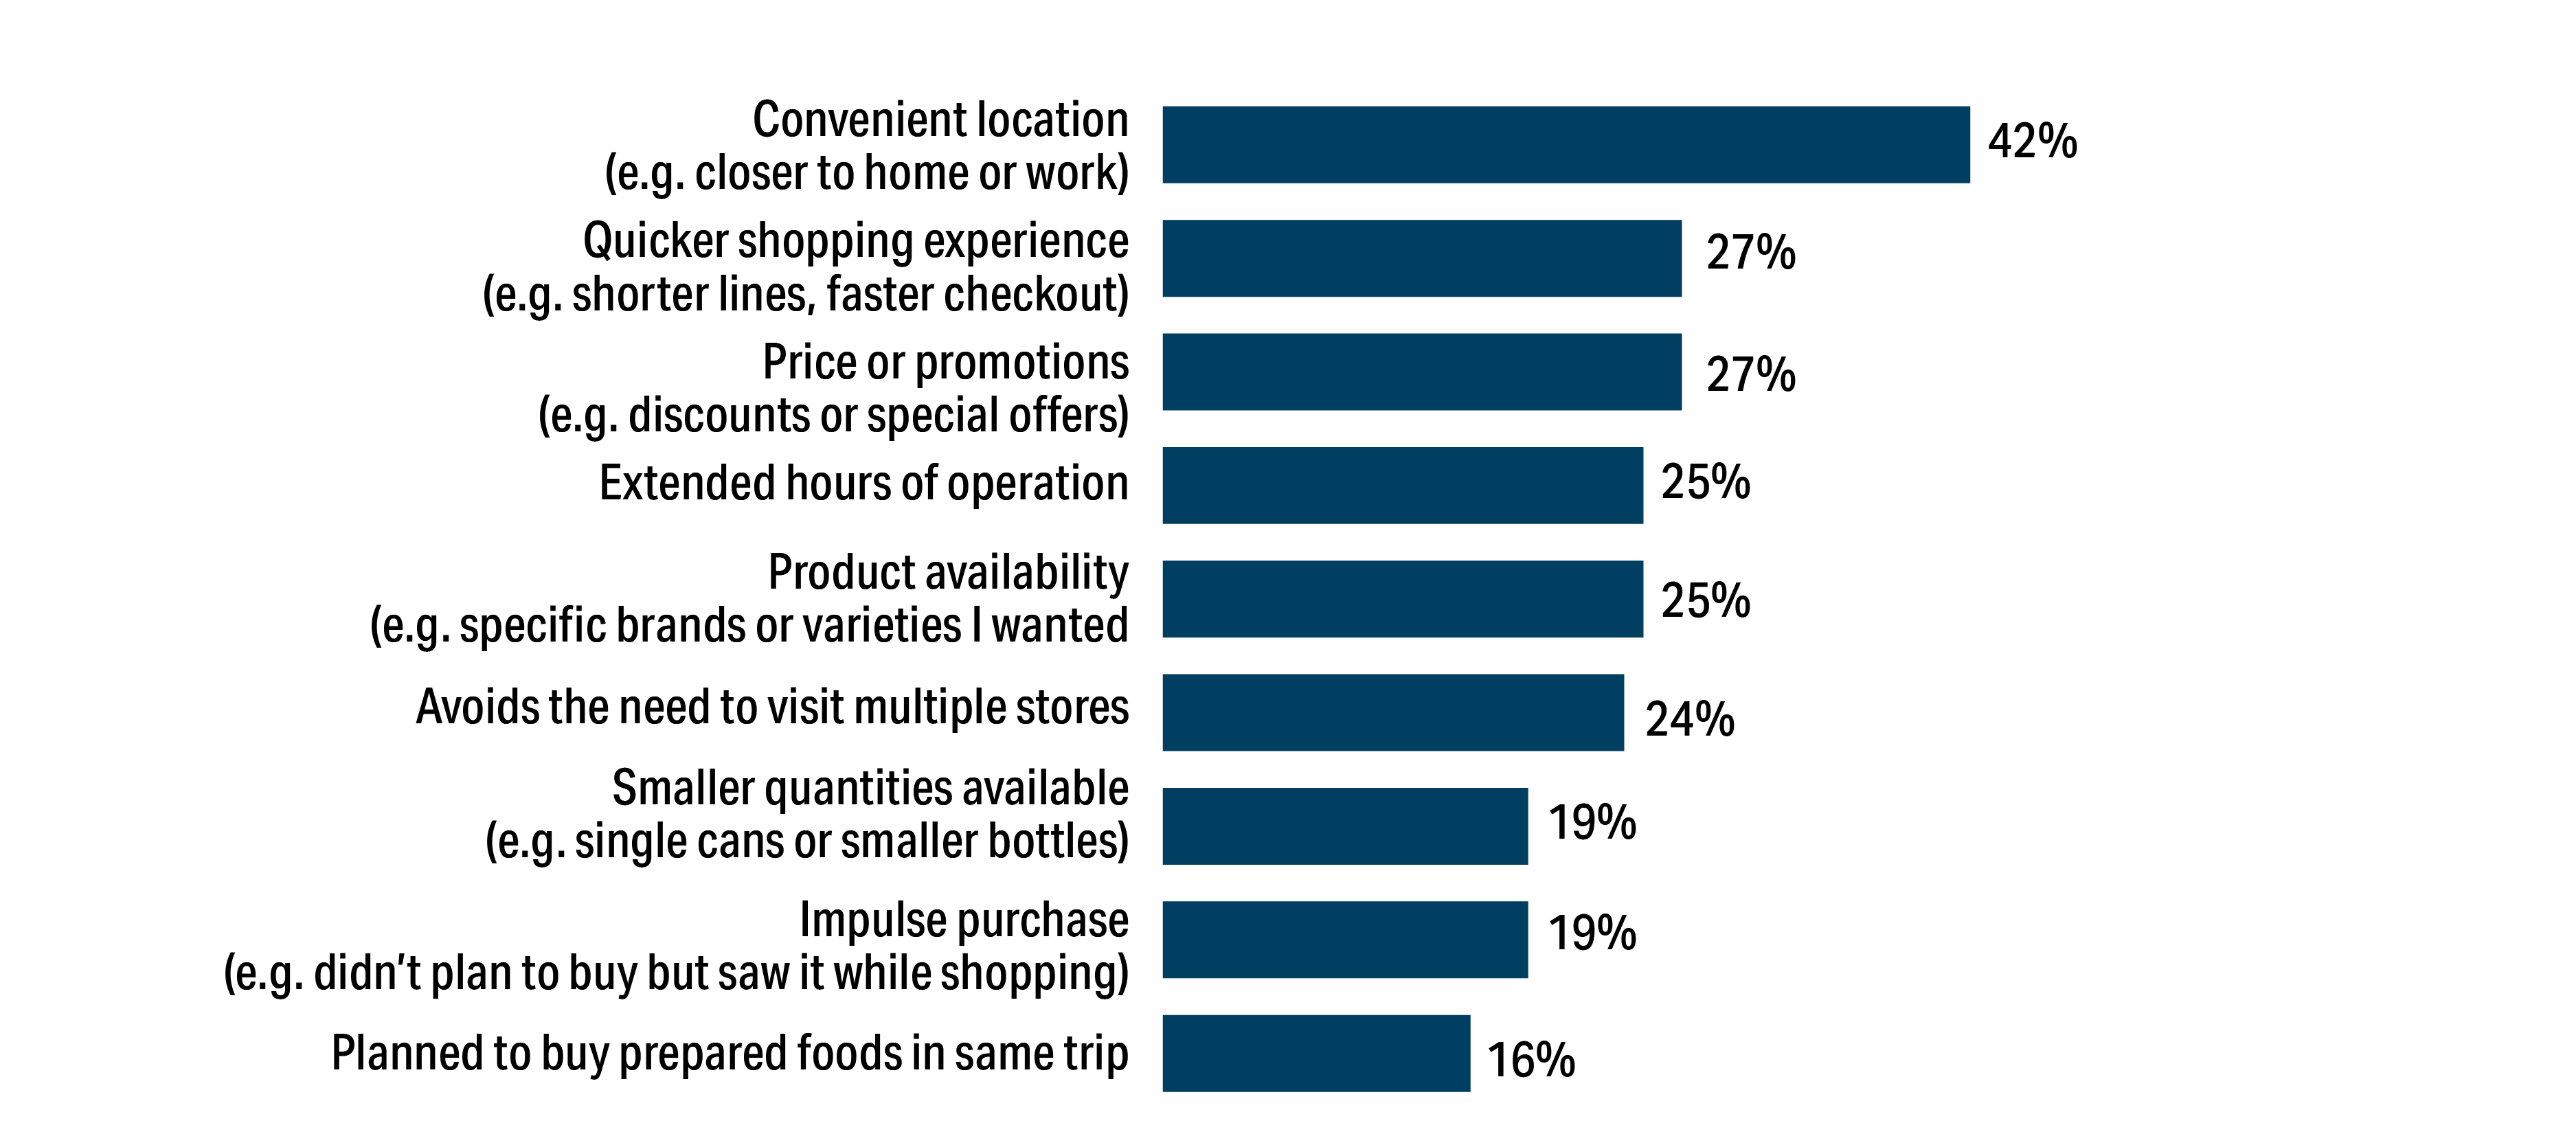
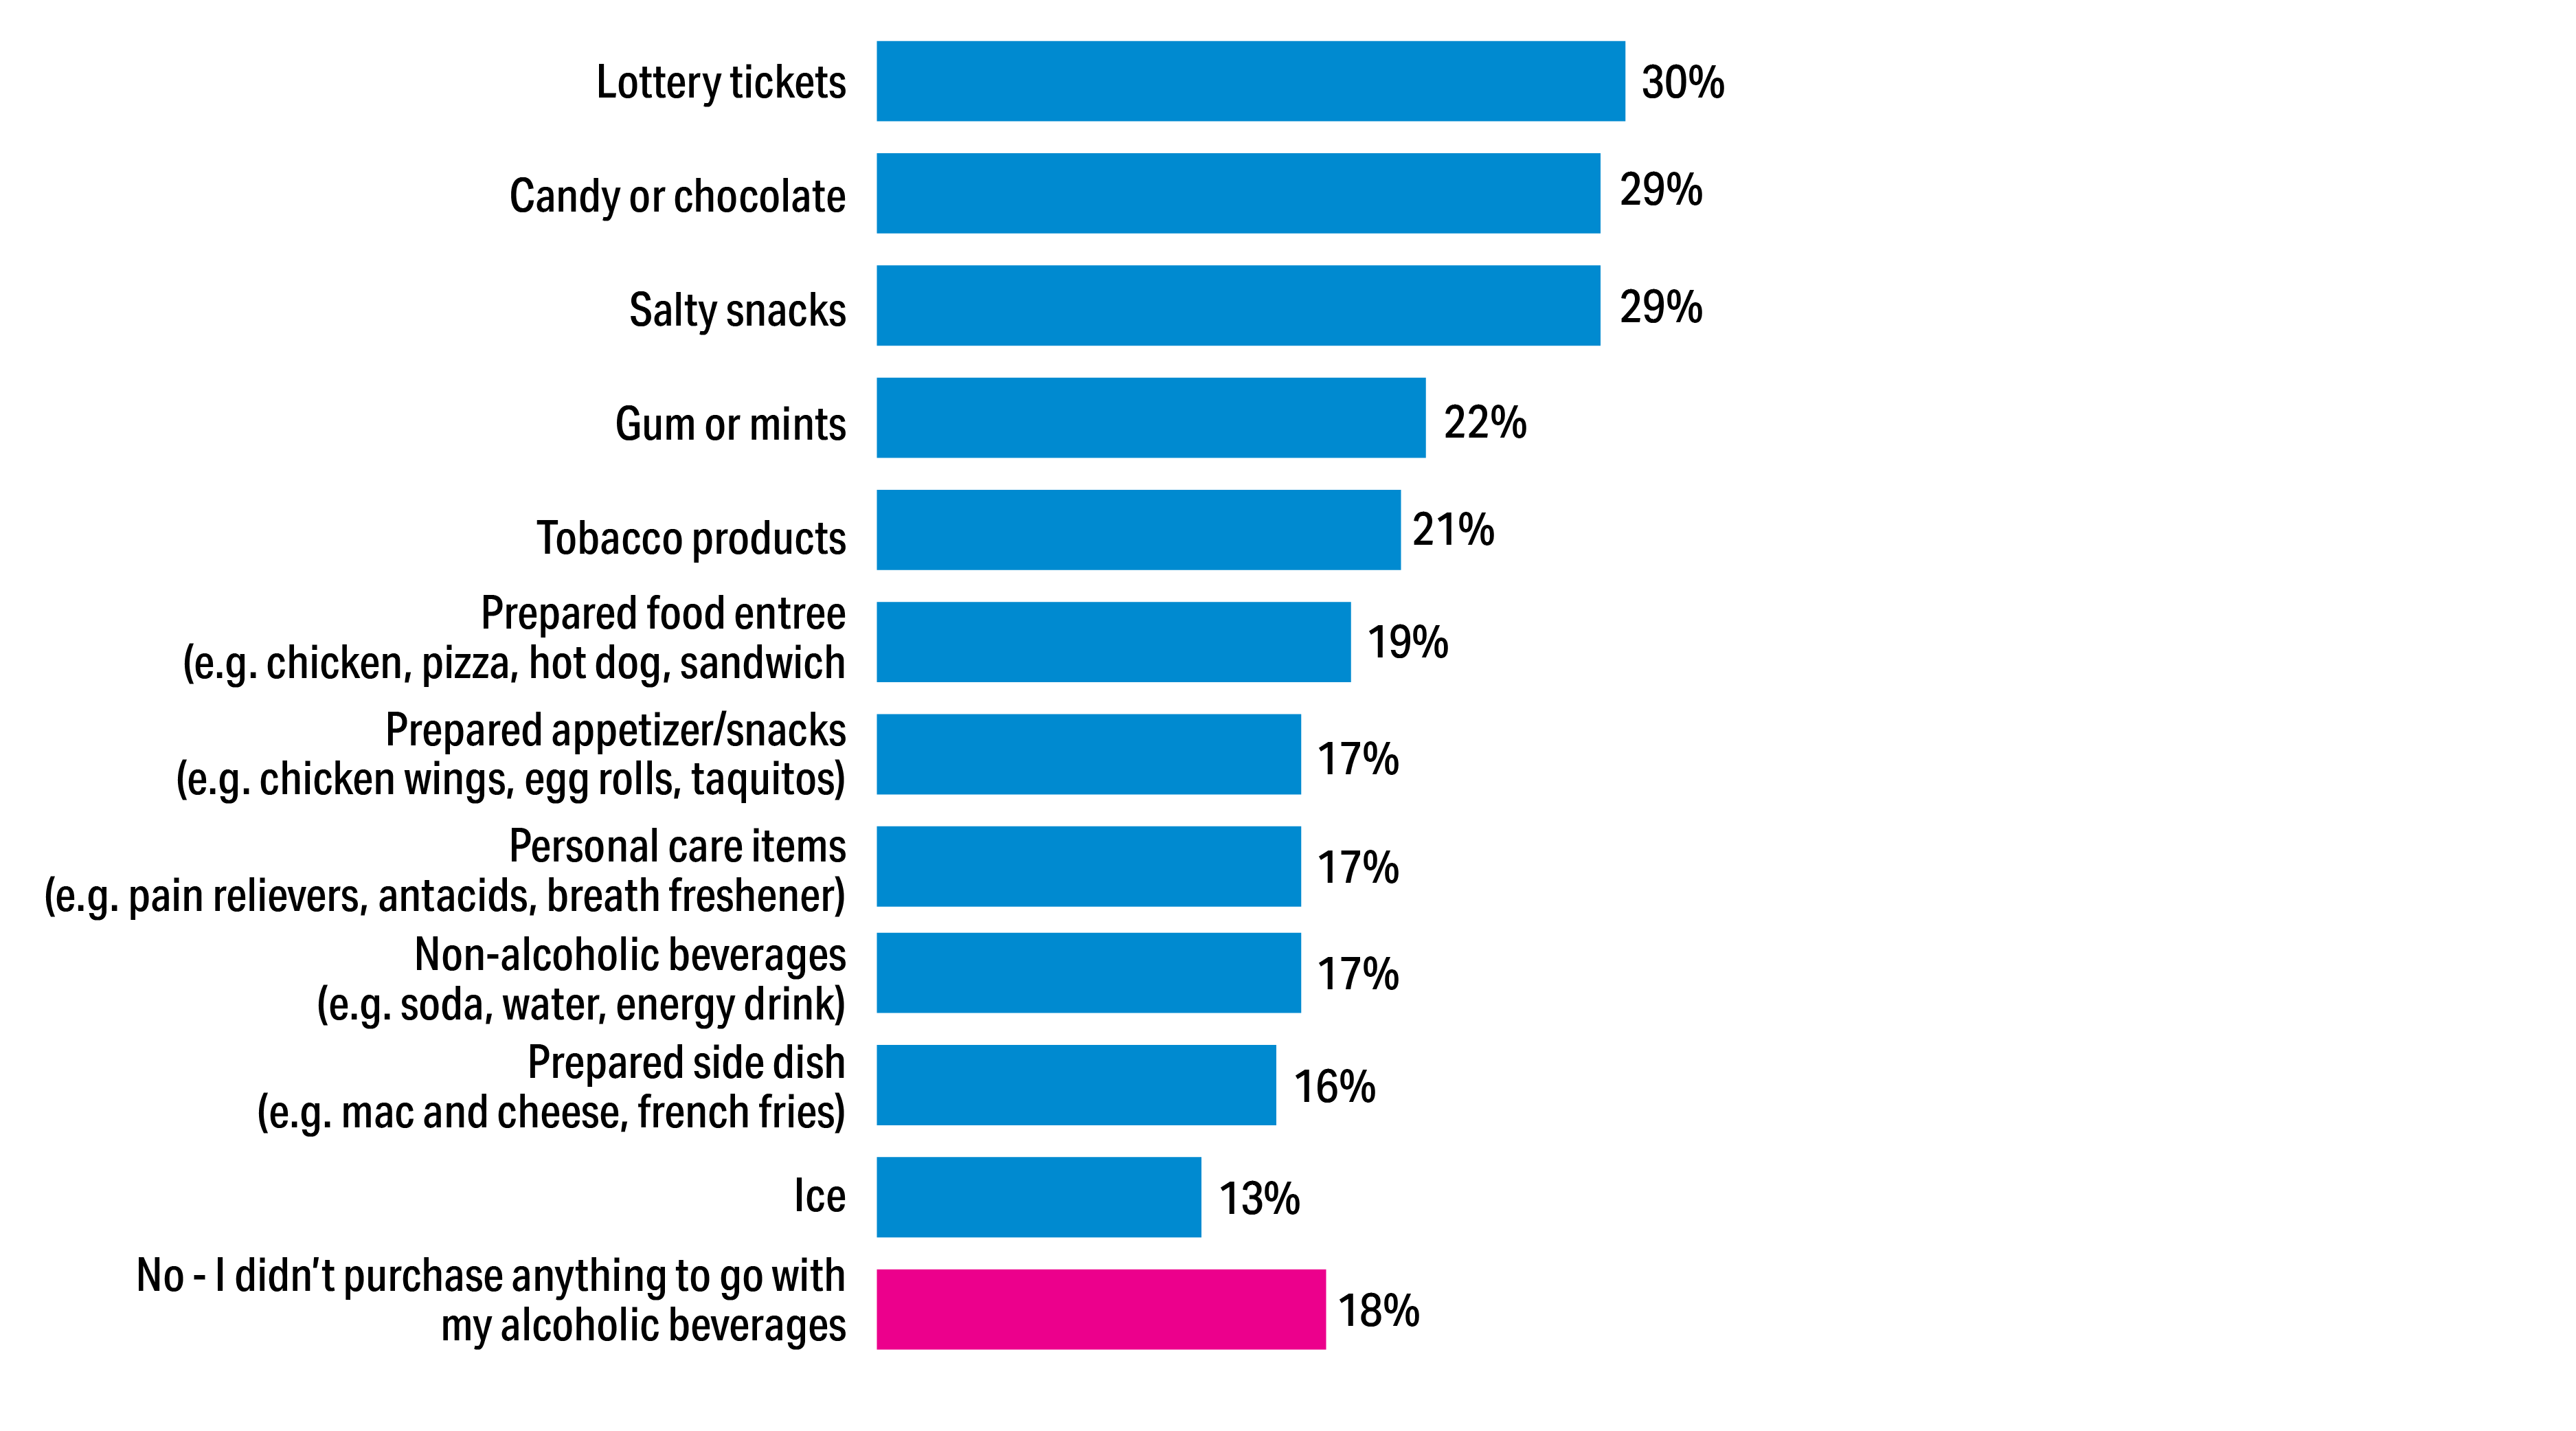
Additional Items Purchased with Beverage Alcohol
Better prices driven by males (34%) vs. females (24%) Proximity driven by gen X (54%) and boomers (65%) Convenience/one stop driven by gen X (58%) and boomers (59%)
New with Nicotine
Doing Good
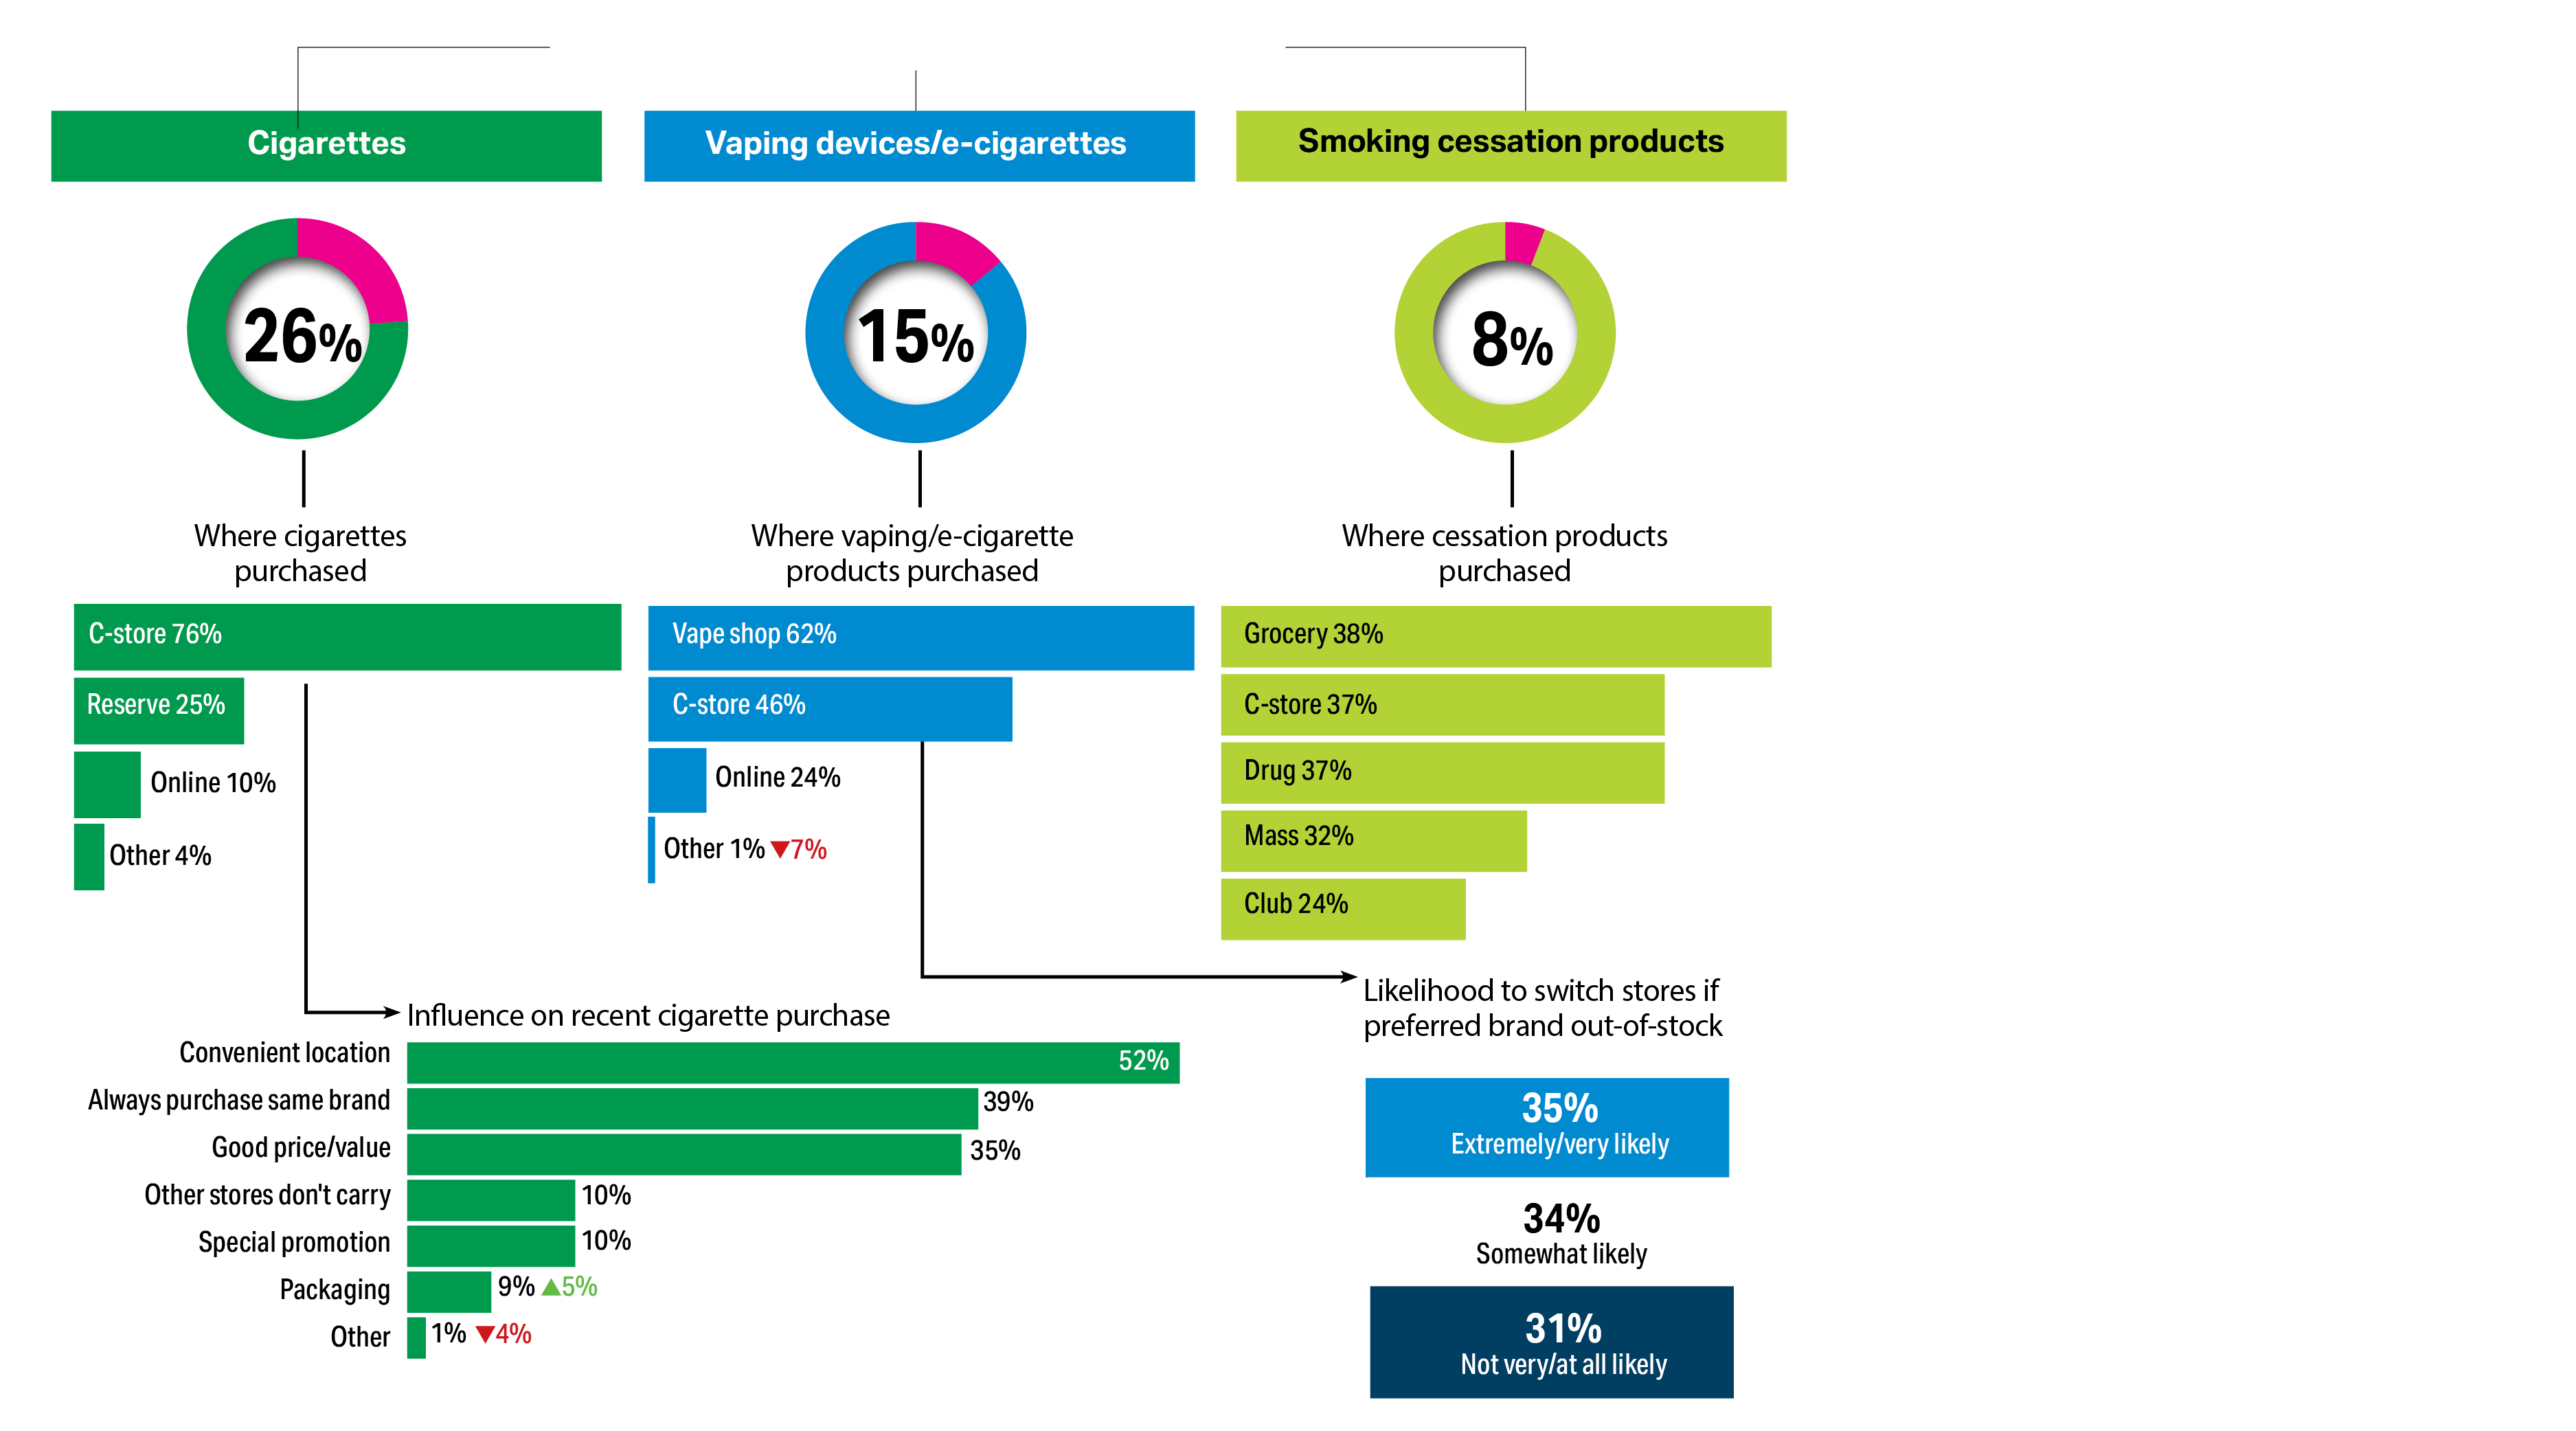
Three-in-four cigarette users regularly purchase from a convenience store, citing location as the primary influence followed by brand loyalty and price. That’s largely on par with last year’s data. However, while the majority of vape and e-cigarette users purchase products at a vape shop, nearly half buy at c-stores and the number of people citing “other” declined significantly this year (perhaps a reflection of the industry’s education and advocacy around contraband).
SHOPPERS REGULARLY USING
Making an Impact
Foodservice Facts
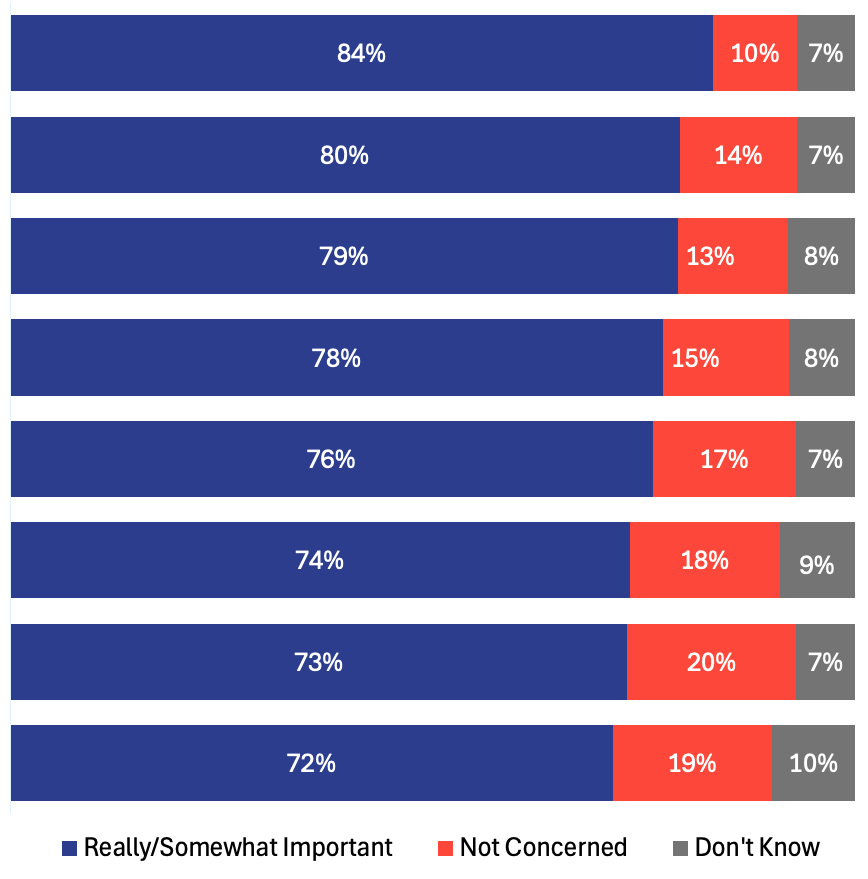
Buying local has never been more important to people across Canada. In addition, an overwhelming majority of shoppers say they would consider switching convenience stores based on a retailer’s commitment to sustainability and local products.
Importance of Stores Demonstrating Commitment to Sustainability
Likelihood to Switch to a Store Demonstrating Stronger Commitment to Sustainability
Donate food instead of throwing out Locally sourced products Recycling containers for local use Movement towards zero waste Reusable bag incentives Ethical sourcing policies Eliminate plastic bags/packaging Energy-efficient equipment/fixures
30%
Not Very/At All Likely
Rarely/Never
Sometimes
Always/Often
Purchase local products
Reason for purchasing local products
Don't Know/Not Sure
To support local businesses Feel quality is better Sustainable/Better for environment More unique Other
65% 44% 37% 29% 2%
Tech Talk
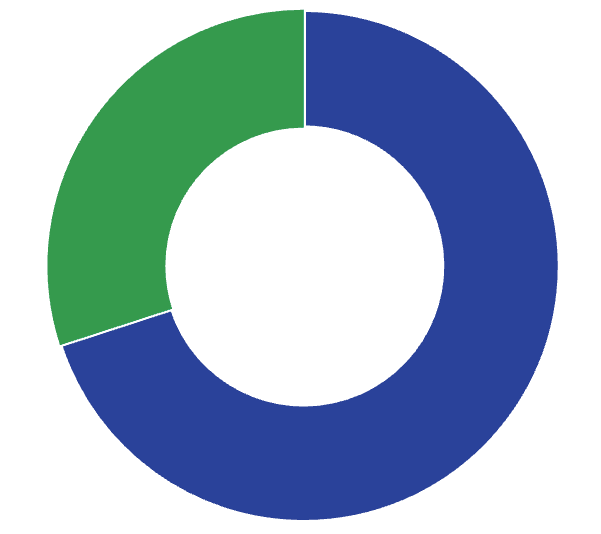
Prepared food purchases and volumes are on the upswing, with more than half of shoppers buying a meal item in the past month.
Purchased Prepared Food at Convenience Store in Past Month
Not Very/At All Satisfied
Somewhat Satisfied
Extremely/Very Satisfied
Lunch Snack Dinner Breakfast None
38% 36% 35% 16% 8%
49%
55%
Purchased prepared food at convenience store in the past month
2.3
Average # of times prepared foods purchased at convenience stores in the past month
1.95
Time of Day When Last Prepared Food Purchase Made at Convenience Store
5%
23%
Typical Prepared Foods Trip Type
Purchase prepared foods only
70%
Combined with other items/gasoline
Types of Prepared Foods Purchased at Convenience Store
Soup/Chili Chinese Indian Italian Healthier options Middle Eastern Organic/All Natural Vegan/Plant-based alternative Thai
Pizza Deli/Sandwiches Hot dog Fresh baked goods French fries Hot snacks (not French fries) Breakfast sandwich Chicken Branded food Other breakfast foods Ice cream/Frozen yogurt
Hamburger Chicken burger Take-home meals Salad Fresh cut fruit Mexican Sushi Yogurt parfaits Fresh cut vegetables Fresh fruit/veggie smoothie
Satisfaction with Most Recent Prepared Foods Purchase at Convenience Store
Place Where Last Purchase was Consumed
Consumed prepared food item(s) at home
Consumed prepared food item(s) outside of the home
57%
28% In the car
12% At work
12% In the store
3% At school
1% Purchased for someone else
Occasions Where Prepared Foods Purchased from Convenience Store to Share with Household
Preference for Prepared Foods at Convenience Store
Additional Items Purchased with prepared foods
Cold fountain/dispensed drink Grocery items Frozen drink Bottled/canned iced tea or coffee Other bottled/canned beverage Beer/wine/cider/RTD cocktails* Yogurt drink Vaping/e-cigarette products Fresh produce Newspaper/magazine Nothing else
Lottery tickets Candy/gum Bottled water Bottled/canned pop Coffee/tea/other hot beverage Milk Packaged salty snack Sports drink Cigarette/tobacco products Ice cream Packaged sweet snack
*modified for 2025 survey
No Preference
Grab-and-Go/ Refrigerated
Made-to-Order/ Freshly Made
Moving Forward
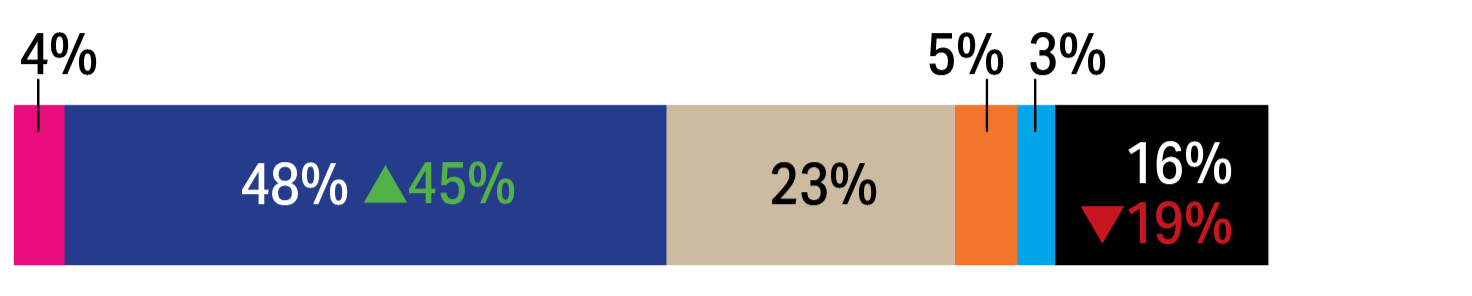
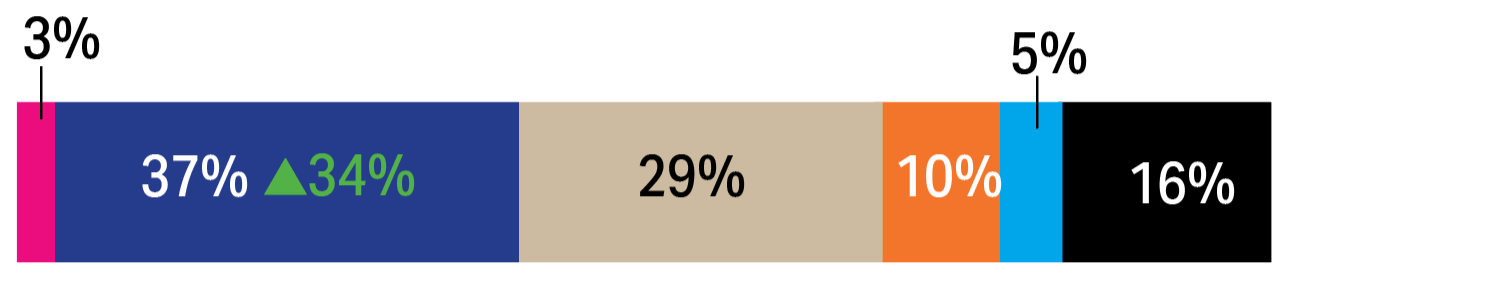
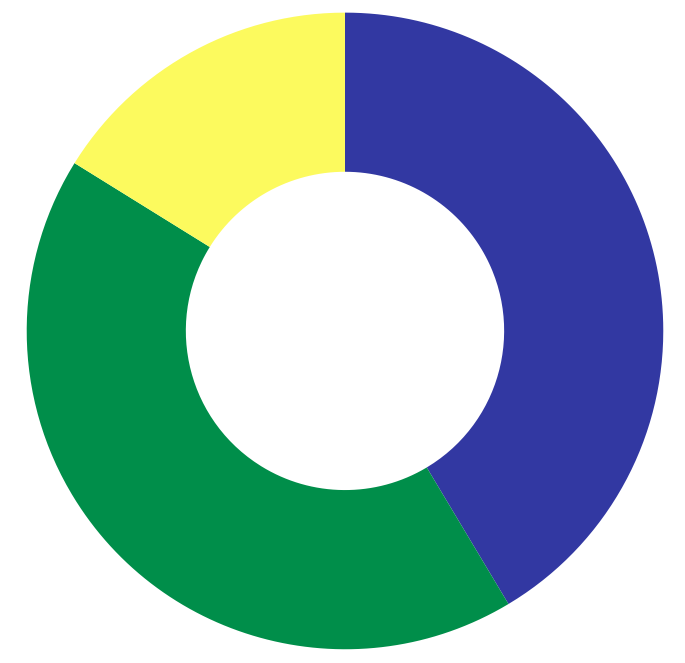
Like last year, nearly one-third of shoppers are actively engaged in a loyalty program, however the share of enrolled but inactive members has grown, primarily driven by male and gen Z shoppers. Overall, checkout preferences are nearly evenly divided, with 51% favouring human interaction and 49% opting for self-checkout. This highlights the importance of considering offering both methods to meet diverse shopper expectations.
Awareness and Enrollment in Convenience Store Loyalty Program
56%
Preferred Check-out Method
Self check-out with retailer's mobile app (n=85)
I don't know
Satisfaction with loyalty program
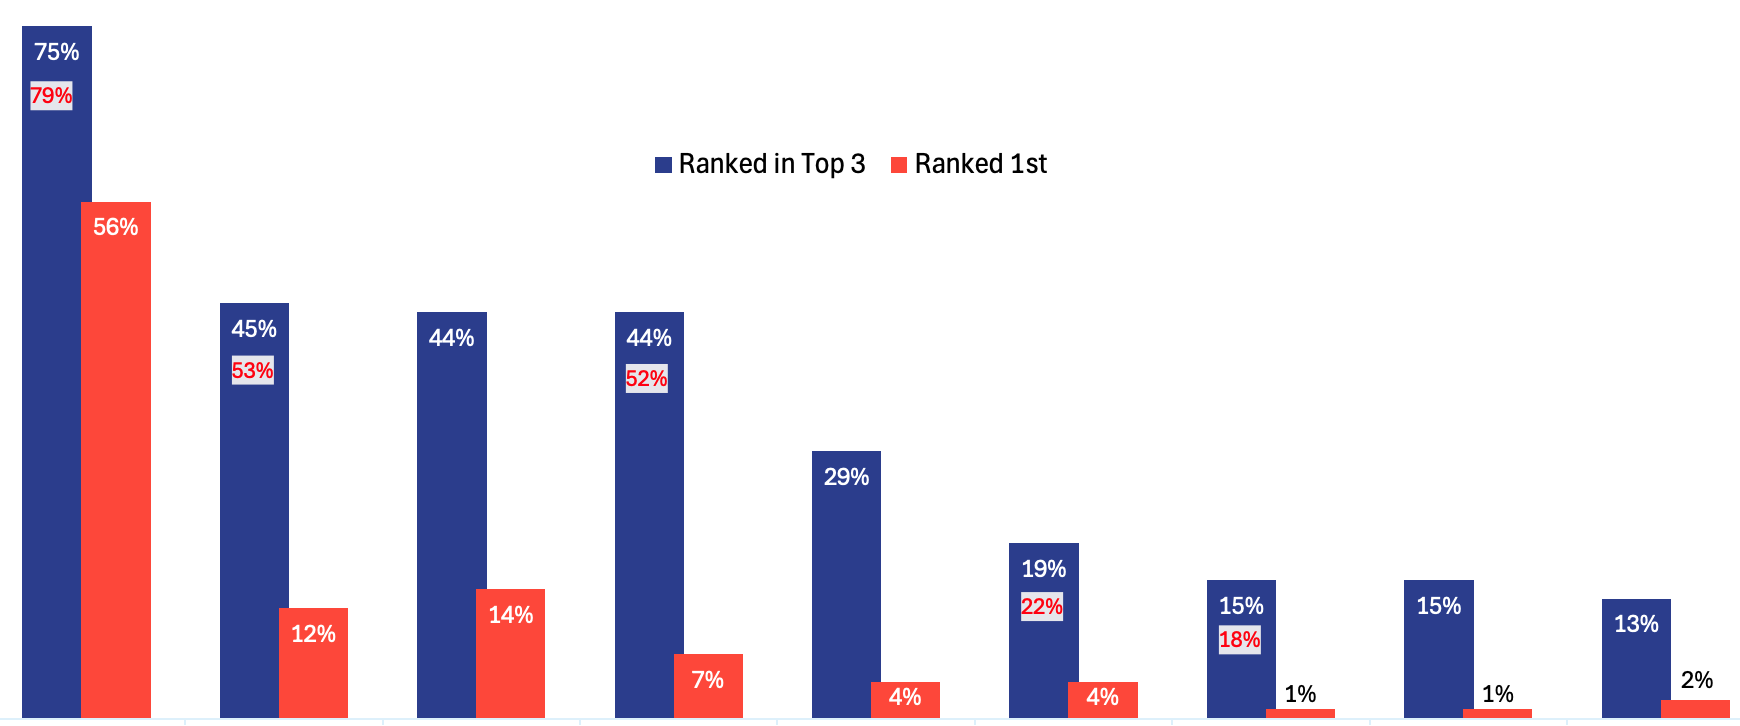
% Ranking type of reward
Cash back rewards
Comfort With Loyalty Program Providing Personalized or Targeted Ads Based on Previous Purchases
62%
Don't follow any convenience stores on social media
Among the 38% of Shoppers that follow a Convenience Store on Social Media
24% Facebook
18% Instagram
17% YouTube
11% TikTok
8% X/Twitter
69%
Satisfaction Using Solution at Convenience Store
*New for 2025 survey
Would not enroll even if they did
If they did, I would enroll
I am not enrolled
I am enrolled but do not use
I am enrolled and actively use
No, convenience store shopped most often does not have a loyalty program
53%
Yes, convenience store shopped most often has a loyalty prgram
Free/ discounted prepared food
Gas discount
Free/ discounted beverages
Opportunity to try new products first
Sweepstakes - large chance/ small prize
Sweepstakes - small chance/ large prize
Free/ discounted snack items*
Local charitable donation
2.49 4.15 4.42 4.17
MEAN RANK
Not Very Comfortable
Somewhat Comfortable
Very Comfortable
Not At All Comfortable
Mobile coupon/ discount (n=135)
Mobile payment app (n=249)
Mobile pay at pump (n=356)
Order online, pickup in-store (n=56)
Drive-thru (n=90)
Order online, pickup curbside (n=42)
Self check-out at register (n=115)
Home delivery (n=98)
Self check-out payment using AI sensors** (n=79)
**Modified for 2025 survey
Following Convenience Stores by Social Media Platform
Self check-out payment using AI sensors*
(e.g., you are charged for items directly to your credit/debit card after passing through sensors when exiting the store)
51%
At register with human interaction
Self check-out at register
*Modified for 2025 survey
The annual C-store IQ National Shopper Study is an important benchmark, tracking the evolving wants, needs, perspectives and behaviours of convenience and forecourt visitors across Canada. In 2025, data emphasizes that shoppers value the role that the convenience and gas channel plays in their lives, however the impetus is on operators to continuously evolve and reposition to earn loyalty, as shoppers exercise their right to go elsewhere when prices, experience and selection don’t meet expectations. This doesn’t mean retailers should engage in a race to the bottom in terms of pricing, but rather see this as an opportunity to evaluate and elevate the c-store shopping experience, while communicating big-picture value (and values) that solidify the channel’s important place in the daily lives of shoppers across Canada.
PRINT AND/OR DIGITAL MAGAZINES
E-NEWSLETTERS
SUBSCRIBE NOW!