A Long History of Market Calls
More to Explore: Ken Fisher's Market Calls
Read through a selection of Ken's most significant market calls across his career.
Past Portfolio Decisions
1. Source: FactSet, Fisher Investments
Investing in securities involves a risk of loss. Past performance is never a guarantee of future returns. Investing in foreign stock markets involves additional risks, such as the risk of currency fluctuations. The foregoing constitutes the general views of Fisher Investments and should not be regarded as personalized investment advice. Nothing herein is intended to be a recommendation or a forecast of market conditions. Rather it is intended to illustrate a point. Current and future markets may differ significantly from those illustrated herein. Not all past forecasts were, nor future forecasts may be, as accurate as those predicted herein. Other methods may produce different results and the results for individual portfolios and for different periods may vary depending on market conditions and the composition of the portfolio.
The performance reflects the results of the Fisher Investments Global Total Return (“GTR”) composite. The composite consists of accounts managed against the MSCI World Index. This broad-mandate strategy seeks capital appreciation by investing primarily in domestic and foreign common stocks, but may from time to time invest in fixed- income securities, money market instruments and other equity-type securities as well as utilize hedging instruments such as short equity positions and options..
Annualized returns of the GTR composite (net of fees) from January 1, 1995 through December 31, 2023 against the MSCI World Index (“MSCI”) are:
1 Year (Net) 31.2%, (MSCI) 23.8%;
5 Year (Net) 14.0%, (MSCI) 12.8%;
10 Year (Net) 9.2%, (MSCI) 8.6%;
Since 1/1/1995 (Net) 9.1%, (MSCI) 7.7%.
Performance results reflect the deduction of brokerage or other commissions and any other trading expenses that were charged to client accounts. Net performance results reflect the deduction of actual client advisory fees and are inclusive of performance based fees where applicable. Performance reflects the reinvestment of dividends, interest and other earnings. Composite performance is presented net of foreign withholding taxes on dividends, interest income and capital gains. Withholding taxes may vary according to the investor’s domicile.
The MSCI World Index is a free float-adjusted, market capitalization-weighted index designed to measure the equity market performance of developed markets. The MSCI World Index consists of 23 developed market country indexes: Australia, Austria, Belgium, Canada, Denmark, Finland, France, Germany, Hong Kong, Ireland, Israel, Italy, Japan, the Netherlands, New Zealand, Norway, Portugal, Singapore, Spain, Sweden, Switzerland, the United Kingdom and the United States.. Unless otherwise specified, returns shown include dividends after deducting estimated withholding taxes. MSCI calculates estimated withholding taxes using the maximum rate of the constituent company’s country of incorporation applicable to non-resident institutional investors that do not benefit from double-taxation treaties.
The S&P 500 is a capitalization-weighted, unmanaged index that measures 500 widely held US common stocks of leading companies in leading industries, representative of the broad US equity market. The performance of selected stocks is presented inclusive of dividends.

read
Click on any of the round year markers to begin.
Click on the grey background to return to the original view.
Investing in securities involves a risk of loss. Past performance is never a guarantee of future returns. Investing in foreign stock markets involves additional risks, such as the risk of currency fluctuations. The foregoing constitutes the general views of Fisher Investments and should not be regarded as personalized investment advice or a reflection of the performance of Fisher Investments or its clients. Nothing herein is intended to be a recommendation or a forecast of market conditions. Rather it is intended to illustrate a point. Current and future markets may differ significantly from those illustrated herein. Not all past forecasts were, nor future forecasts may be, as accurate as those predicted herein.
©Fisher Investments.
Founded in 1979, Fisher Investments is a privately owned, independent investment adviser offering a global approach to portfolio management for high net worth and institutional clients.
About Fisher Investments


GTR Net: +38.3%
MSCI World: +20.7%
What We Did: We saw a continuing bull market with big returns likely. The year was plagued with what was, in our view, far too much pessimism, given positive factors like an upward-sloping yield curve, low inflation, legislative gridlock and moderate stock valuations.
1995

1995
2000
2005
2010
2015
2020
Outcome: Our exposure to US stocks helped client portfolios handily outperform the MSCI World Index, which finished up 20.7%.
GTR Net: +20.2%
MSCI World: +13.5%
What We Did: We forecasted another positive year for stocks, although with more muted returns than 1995. We expected large-cap stocks to outperform, as they typically do in the mature stages of bull markets. We also believed continuing legislative gridlock, overly dour expectations and the fourth year of the presidential cycle (which are typically up years) would buoy markets.
Outcome: The market continued up, but at a slower pace than 1995, much as we forecasted. The MSCI World Index ended the year up 13.5%—bested by a typical client portfolio. An overweight to US stocks and an underweight to Japan aided portfolios on a relative basis. Sector decisions, namely an underweight to Materials and an overweight to Telecom, benefited portfolios as well.
1996
GTR Net: +22.8%
MSCI World: +15.8%
What We Did: We envisioned an overall down year for US stocks, with the stock market peaking in the first half, then falling the remainder of the year to end down about 5%-10% overall. We also forecasted a shift from strength in US stocks to non-US with non-US markets rising 10%-20%.
Outcome: Our expectations for the US market were overly meager and the market continued up, posting another strong year. The MSCI World and S&P 500 Indexes were up 15.8% and 33.4%, respectively. Our expectations for a mid-year swoon faded, and we maintained our major country weights from late 1996—an overweight to US and underweight to Japan—and held them as they continued to work in our favor through yearend. These decisions contributed materially to relative benchmark outperformance. However, portfolio sector composition was rotated during the year. Exposure to Materials and Information Technology benefited relative performance most.
1997
GTR Net: +27.7%
MSCI World: +24.3%
What We Did: Investors were fearful Asian financial troubles would take down global stocks, but we saw poor sentiment as a positive sign the bull market actually had more room to run. We maintained our exposure to the biggest US large-cap names, but also added exposure to larger non-US stocks. On a sector allocation basis, we were overweight to Information Technology, Energy and Health Care.
Outcome: A big mid-year correction couldn’t derail global stocks. Technology was the best-performing sector and the US the best-performing country. A typical client portfolio beat the MSCI World Index, which returned 24.3%.Our decision to overweight Information Technology and limit exposure to Japan were the primary contributors to relative performance. However, the decision to overweight Energy hurt relative returns.
1998
GTR Net: +24.7%
MSCI World: +24.9%
What We Did: We believed the stock market would have above-average returns once again and remained fully invested in stocks. We were overweight to the US and Technology, but had no pure-play internet stocks. Importantly, we also focused on mega-cap stocks—those with market capitalizations greater than the weighted average of the broad market.
Outcome: Our market direction forecast was correct, although a typical client portfolio lagged the MSCI World Index slightly, which was up 24.9%. Our overweight to Information Technology and underweights to Financials and Utilities aided relative performance. On a country allocation basis, an underweight to the United Kingdom aided. Decisions to overweight Health Care and Spain detracted from relative performance.
1999
GTR Net: -8.5%
MSCI World: -13.2%
What We Did: Amid growing enthusiasm for stocks, we took a more tempered view, but remained fully invested in equities. We underweighted the US relative to non-US and overweighted more classically defensive sectors—Consumer Staples and Health Care. We also cut our relative weight in Technology.
Outcome: It was a down year in all major markets, but a typical client portfolio beat the MSCI World Index benchmark. The key to outperformance was reducing exposure to Technology stocks, though our equity positions in Japan hurt to some degree.
2000
GTR Net: +3.2%
MSCI World: -16.8%
What We Did: We forecasted a big negative year for stocks and we were fully bearish. Portfolios were designed to be “market-neutral,” e.g., get cash-like returns but still benefit from some stock picking among defensive categories. To offset the market exposure of the stocks we held, we shorted Technology and small cap exchange‑traded funds. Portfolios had heavy allocations of cash and bonds.
Outcome: Broad markets experienced big downside overall with significant volatility through the year, and our defensive posture aided portfolios. The MSCI World Index finished down 16.8% and a typical client portfolio outperformed.
2001
GTR Net: -24.1%
MSCI World: -19.9%
What We Did: For most client portfolios, we spent the first half of the year in the same bearish posture as 2001, then shifted to fully invested in individual equities mid-year. We maintained our exposure to defensive stocks in the first half of the year but subsequently overweighted Information Technology in the last half.
Outcome: Our renewed optimism came too soon. Stocks didn’t hit their lows until October, months after we fully reinvested. As a result, a typical client portfolio finished the year down and underperformed the MSCI World Index.
2002
GTR Net: +33.8%
MSCI World: +33.1%
What We Did: We expected an above-average year for equities and maintained our portfolio positioning from late 2002. In anticipation of better-than-expected economic growth, portfolios were largely overweight to economically sensitive categories. We had an overweight to the US and continental Europe, but we slightly underweighted the UK and Japan. On a sector level, we were overweight Information Technology and underweight Health Care and Consumer Staples.
Outcome: Global stocks retested bear market lows in mid-March, then rebounded strongly and continued their rally through year end. The MSCI World Index was up 33.1% for the year, and a typical client portfolio outperformed slightly. In particular, allocation decisions to Europe, Health Care, Materials and Information Technology aided portfolios.
2003
GTR Net: +8.3%
MSCI World: +14.7%
What We Did: We forecasted another strong year for equities. We were overweight to the US and continental Europe and underweight the UK. On a sector basis, we were overweight categories we thought would benefit from ongoing, better-than-expected global economic growth, including Energy and Information Technology. We also had a slight emphasis on stocks smaller than the weighted average of the global stock market.
Outcome: Stocks were mostly flat for the first three quarters of the year, but rallied in the final quarter. Non-US stocks outperformed the US and small-cap stocks outperformed large. Cyclical sectors generally underperformed, contrary to our expectations. Though positive for the year, a typical client portfolio lagged the MSCI World Index.
2004
GTR Net: +7.5%
MSCI World: +9.5%
What We Did: We expected strong, double-digit returns and maintained most of our positioning from 2004 in a typical client portfolio. By midyear, we increased our allocation to Energy and decreased our weight to Materials, Consumer Staples and Utilities. We maintained most of our relative country weights.
Outcome: The MSCI World posted returns slightly less than our forecast. Our calls on Energy and Japan were positive contributors to relative performance, while exposure to Materials and the US detracted. A typical client portfolio was again positive, but lagged the MSCI World Index.
2005
GTR Net: +15.7%
MSCI World: +20.1%
What We Did: We anticipated strong stock market returns. A typical client portfolio remained maximally invested in stocks. We were underweight the UK, overweight Japan, neutral continental Europe and took an opportunistic overweight to Emerging Markets. We remained overweight to more economically sensitive sectors and underweight to classically defensive sectors.
Outcome: Global stocks posted double-digit returns in 2006. However, a typical client portfolio lagged the MSCI World Index, as economically sensitive categories fared poorly in a mid-year correction.
2006
GTR Net: +17.2%
MSCI World: +9.0%
What We Did: We forecasted the MSCI World Index would deliver double-digit returns and remained fully invested in stocks. We were neutral on the US and maintained overweights to Japan and Emerging Markets.
Outcome: Global equities were positive, but shy of our double-digit forecast. Our typical client portfolio handily outperformed the MSCI World. Strategic overweights to economically sensitive sectors and Emerging Markets helped relative returns.
2007
GTR Net: -42.6%
MSCI World: -40.7%
What We Did: We expected ongoing global growth and positive market returns and remained fully invested in stocks. We rebalanced portfolios early in the year to gain greater exposure to larger-cap stocks—we believed the historical trend of larger-cap stocks outperforming smaller cap in the later stages of bull markets would persist.
Outcome: A global credit market panic in the back half of 2008 contributed to a steep stock market selloff. The MSCI World Index was down 40.7%. Portfolio underweights to Consumer Staples, Utilities and Health Care stocks hurt relative performance, but a large Financials underweight helped. Overall, a typical client portfolio lagged the benchmark.
2008
GTR Net: +34.0%
MSCI World: +30.0%
What We Did: Early in the year, we believed we were in the bottoming period of a bear market and a new bull market was in the fore. We expected the categories of stocks faring worst in the bear would fare best in the early stages of the new bull market—positioning portfolios to capture this “bounce back” theme. We pared back on Telecom, Health Care and Financials in favor of Information Technology, Consumer Discretionary and other economically sensitive categories.
Outcome: The year played out very close to our forecast. The MSCI World Index bounced strongly off the March 9 bottom, posting strong, double-digit returns for the full year. Overall, the categories that fared worst in the late stages of the bear did best in 2009. As a result, a typical client portfolio outperformed the MSCI World Index.
2009
GTR Net: +14.7%
MSCI World: +11.8%
What We Did: Continuing dour sentiment, underappreciated economic strength and strong corporate fundamentals relative to depressed valuations led us to believe strong equity returns would continue. We largely maintained portfolio positioning in a typical client portfolio.
Outcome: Despite a big mid-year correction, the MSCI World Index finished the year up in the low double digits, and a typical client portfolio outperformed on a relative basis. Overweights to economically sensitive categories and underweights to more defensive sectors aided relative return.
2010
GTR Net: -8.2%
MSCI World: -5.5%
What We Did: We expected 2011 would be a typical third year of a bull market—a pause that refreshes before the resumption of strong bull market returns. We anticipated broad markets would end the year up a little or down a little. On a country allocation basis, the US remained our biggest overweight. We reduced our exposure to Emerging Markets, Europe and Japan and remained overweight to more economically sensitive categories.
Outcome: As we forecast, the year finished with overall flattish results—the MSCI World finished down -5.5% and the S&P 500 up +2.2%. A correction started later in the year, and global stocks didn’t have much time to rebound by the close of the year. Economically sensitive categories fared poorly in the correction, so for the full year, a typical client portfolio lagged the benchmark.
2011
GTR Net: +5.0%
MSCI World: +15.8%
What We Did: We expected the bull market to reaccelerate, with less economically sensitive categories and large-cap shares assuming market leadership. A spring rebalance shifted portfolios from economically sensitive sectors like Energy, Materials and Industrials to categories with longer-term growth prospects whose earnings are less sensitive to the economic cycle. A second shift in the summer moved portfolios heavily into mega-cap (shares with a market capitalization greater than the market’s weighted average market cap). Sector and country weights were largely a residual of our style preference—for example, portfolios were overweight to US and Technology, which have high concentrations of mega-cap firms.
Outcome: Global equity markets were positive but fell short of our robust expectations, and typical portfolios were only slightly positive and lagged the benchmark as our shift to mega cap occurred just before a short-lived market pullback. An underweight to Financials also detracted from relative returns, as the sector experienced a powerful counter-trend rally.
2012
GTR Net: +23.5%
MSCI World: +26.7%
What We Did: As the bull market matured, we anticipated another up-a-lot year with mega-cap stocks outperforming. Underpinning our positive outlook were lingering skepticism in the midst of healthier than perceived fundamentals and low legislative risk due to continued political gridlock in the US. During Q4, we increased exposure to Financials and Europe in anticipation of improved lending conditions and a nascent EU economic recovery. Exposure to mega-cap categories, specifically overweights to US and Information Technology, remained.
Outcome: As we forecasted, global stocks surged in 2013. The MSCI World was up 26.7%, with a typical client portfolio lagging slightly. Mega-cap stocks lagged smaller stocks for much of the year, but outperformed in Q4. Portfolio underweights to Energy and Materials proved to be in-step with the aging bull market and, along with an overweight to the US, bolstered relative performance. However, while overweights to Consumer Staples and Health Care also proved to be correct, slight underperformance resulted from security selection within those two sectors.
2013
GTR Net: +3.6%
MSCI World: +4.9%
What We Did: With the view that the bull market would continue, we anticipated another up-a-lot year. We believed accelerating global economic growth and corporate earnings would keep the bull market advancing, while Leading Economic Indexes in most countries were high and rising. Amid positive fundamentals, expectations remained low as investor sentiment was a mix of skepticism and optimism. We maintained exposure to mega-cap categories, specifically overweights to the US and Information Technology.
Outcome: Global stocks ended 2014 positively with the MSCI World full-year returns at 4.9%. Although our forecast was for an up-a-lot year, up-a-little was our second-most probable outcome. Bigger stocks beat smaller, though mega-cap stocks lagged slightly. Like much of the bull market, US stocks vastly outperformed non-US. Technology—one of our overweights—led, while Energy and Materials, our main underweights, lagged badly as commodity prices fell. Our US overweight and Japan underweight benefitted a typical client portfolio. However, our mega-cap and European overweights dampened relative performance.
2014
GTR Net: +2.3%
MSCI World: -0.9%
What We Did: As market fundamentals remained strong, we anticipated the bull market continuing with world stocks likely rising double digits. The world economy was growing, with an accelerating US leading the developed world. Most western governments were gridlocked, reducing the risk of radical legislation materially hurting stocks. We maintained our mega-cap emphasis and we remained overweight to the US, UK and eurozone and underweight to Japan. On a sector level, Information Technology and Health Care represented the largest overweights, while Energy and Industrials remained underweights.
Outcome: Global stocks fell in 2015 with the MSCI World full-year returns at -0.9%. Our forecast for an up-a-lot year did not come to fruition with a late year correction wiping away gains. Mega-cap stocks, our primary emphasis, beat non-mega. US stocks—our biggest geographic overweight—beat non-US. Health Care and Information Technology also outperformed by several percent. Our decision to overweight these sectors while underweighting Energy and Materials added significant value. Our Japan underweight was an exception—early 2015 outperformance diminished relative returns—but other size, sector and country decisions outweighed it with a typical client portfolio outperforming relative to the MSCI World.
2015
GTR Net: +5.8%
MSCI World: +7.5%
What We Did: We believed the bull market would continue in 2016, as fundamentals were better than many people believed and uncertainty would diminish as the year progressed. Economic and political drivers pointed to a fine 2016. US presidential election years are usually positive, and America overwhelmingly outperforms as the contest nears. America, Europe and China were healthier economically than many people appreciated. We maintained our focus on mega-cap equities along with the US as our largest country overweight. Other country level allocations included overweights to the UK and eurozone and an underweight to Japan. On a sector level, Health Care and Information Technology represented the largest overweights while Materials and Industrials were underweights.
Outcome: As we expected, 2016 was a year of falling uncertainty. Our forecast for a continuation of the bull market was accurate. Global equities ended 2016 up with MSCI World full-year returns at 7.5%. US shares topped non-US for the fourth consecutive year, and our US overweight benefitted a typical client portfolio. Our underweight to Japan and overweight to Information Technology also contributed positively. Our underweights to Canada, Energy and Materials detracted from relative performance.
2016
GTR Net: +25.8%
MSCI World: +22.4%
What We Did: We expected a great year for global stocks, driven by continuing positive economic fundamentals and easing political uncertainty. We anticipated a leadership shift from US to non-US stocks in the year. Likewise, we continued to favor high-quality mega-cap stocks which typically outperform in a bull market’s back half. After the first quarter, we began to shift client portfolios to emphasize non-US stocks, particularly eurozone stocks. We also increased our exposure to Japan as investor sentiment towards Japan seemed overly dour relative to reality. On a sector basis we reduced our exposure to US Financials, Energy and Consumer Discretionary and increased our exposure to non-US Financials, Telecom and Technology.
Outcome: The bull market continued and global stocks finished up for the year. The MSCI World returned 22.4% in what was the third best annual return since 2009. Non-US stocks outperformed for the full year, but a Q4 countertrend narrowed US stocks’ underperformance by yearend. A typical client portfolio beat the benchmark. Stock selection in the US and overweights to Europe and Technology contributed positively, while selection in Japan and Industrials detracted slightly.
2017
GTR Net: -11.0%
MSCI World: -8.7%
What We Did: We anticipated an up-a-lot year due to continued positive global fundamentals, gridlocked governments globally and optimistic—but not euphoric—investor sentiment. We expected non-US stock leadership to continue and maintained underweights to the United States and Japan. On a sector basis, portfolios were overweight to Information Technology and Health Care and underweight to Financials—particularly US Financials—and Industrials. Midyear, we modestly increased exposure to Energy and Materials.
Outcome: Volatility returned in the form of two steep, correction-like market drops bookending the year. Our forecast was overly optimistic as global stocks finished down for the year. The MSCI World fell 8.7% and a typical client portfolio underperformed. Our overweights to the eurozone and non-US Financials detracted from portfolio returns as lingering political uncertainty in Europe dragged sentiment lower. Our overweights to Information Technology and Health Care and stock selection in Consumer Discretionary benefitted portfolios.
2018
GTR Net: +31.0%
MSCI World: +27.7%
What We Did: We expected strong returns with global stocks rebounding from late-2018’s large correction. We believed that correction had likely ended by December 25 and stocks historically generate double-digit returns in the 12-months following corrections—which boded well for 2019. We maintained overweights to the eurozone, Technology and Health Care and underweights to the United States, Japan and Financials. During the year, we reduced portfolio weights to the eurozone and Consumer Staples while we increased exposure to Technology, Energy, Consumer Discretionary, Communication Services and Industrials.
Outcome: Global stocks posted their strongest year since 2009, returning 27.7% and typical client portfolios outperformed. Throughout 2019, investors fretted recession, trade tariffs, the yield curve and weak manufacturing data. These worries lowered investor expectations and reality proved better than feared—propelling stocks in our view. Our emphasis on Technology and Tech-like Consumer Discretionary and Communication Services firms proved correct as those stocks led the market. Our underweight to Japan also benefitted portfolios while our Health Care and eurozone Financials holdings detracted from returns.
2019
GTR Net: +21.7%
MSCI World: +15.9%
What We Did: We believed 2020 would be a good year for stocks but likely with milder returns than 2019. Modestly optimistic sentiment, slow but positive economic growth and falling political uncertainty tied to the US election set the stage for rising markets in our view—particularly in the back half of the year. We began the year overweight to the eurozone and Technology, neutral to the US and Health Care, and underweight to Japan and Financials. In the first half of the year, we implemented a series of trades to increase our emphasis on large, high quality, growth stocks. These trades shifted portfolios underweight to the eurozone, overweight to the US, Consumer Discretionary and Communication Services, and expanded our Technology overweight.
Outcome: Despite a record-fast bear market and recovery, global pandemic, stay-at-home orders and contentious US election, global stocks rose 15.9% and were largely in line with our initial full-year forecast. Typical client portfolios outperformed as our growth-oriented Technology, Consumer Discretionary and Communication Services holdings fell less during the bear market and rebounded strongly in the recovery—cumulatively adding to returns. Our underweights to Japan and Financials also benefited portfolios while our modest Energy overweight detracted from returns.
2020
GTR Net: +20.7%
MSCI World: +21.8%
What We Did: We expected 2021 would be a great year for stocks amid rising investor optimism, increasing economic normalcy and a quieter-than-feared political scene. We believed 2020’s record-fast bear market behaved much more like a correction than a typical bear market—causing the new bull market to act more like a continuation of the bull market that began in 2009. As a result, we maintained our emphasis on large, high quality, growth stocks—which tend to outperform in the latter stages of a bull market. We remained overweight to Information Technology and underweight to more value-oriented sectors such as Financials. Our largest regional overweight was to the US. In the latter half of the year, we made some modest portfolio adjustments to continue to emphasize stocks with growth-like characteristics.
Outcome: Overall, 2021 shaped up much as we expected—with global stocks delivering an above average 21.8%. Large growth stocks led from mid-May through December, sentiment was broadly optimistic, the global economy mostly recovered from the COVID-19 pandemic and President Biden’s first year in office featured nicely positive returns. Typical client portfolios fell slightly behind the benchmark in December’s closing days. Our underweights to Japan and Materials benefited portfolios while our stock selection in Information Technology detracted from returns.
2021
0%
MSCI World
The interactive timeline below shows global market returns and Fisher Investments' Global Total Return (GTR) portfolio performance since 1995. Explore each year for a summary of the portfolio decisions we made that year, along with the ensuing outcome.
Not all past forecasts were, nor future forecasts may be, as accurate as those presented herein. Investing in stock markets involves the risk of loss.


1

Disclosures
Introduction

Fisher Investments has a long history of forecasting equity markets. Since we began managing money for private clients in 1995, we have been using our market outlook to help investors achieve their investing goals.
Though no one, including Fisher Investments, can forecast the stock market with absolute certainty, we are proud of our market call history.
Key Takeaways


Investing in securities involves a risk of loss. Past performance is never a guarantee of future returns. Investing in foreign stock markets involves additional risks, such as the risk of currency fluctuations. The foregoing constitutes the general views of Fisher Investments and should not be regarded as personalized investment advice or a reflection of the performance of Fisher Investments or its clients. Nothing herein is intended to be a recommendation or a forecast of market conditions. Rather it is intended to illustrate a point. Current and future markets may differ significantly from those illustrated herein. Not all past forecasts were, nor future forecasts may be, as accurate as those predicted herein.
© Fisher Investments.
Founded in 1979, Fisher Investments is a privately owned, independent investment adviser offering a global approach to portfolio management for high net worth and institutional clients.
About Fisher Investments
Interactive Returns Chart
Interactive Returns Chart
GTR Net: -23.7%
MSCI World: -18.1%
What We Did: We expected the bull market to continue in a likely back-end loaded year. We anticipated slowing-but-still-healthy economic growth, increasing investor optimism and falling US political uncertainty to support strong late-year returns. We maintained our emphasis on large growth-oriented stocks, remaining overweight to Technology and Communications Services. We also kept underweights to more value and defensive-oriented sectors such as Financials and Consumer Staples.
Outcome: Global stocks ended a painful 2022 down -18.1% with typical client portfolios underperforming. Numerous negative developments such as the Russia-Ukraine war, energy price spikes, China’s COVID lockdowns, elevated inflation and central bank rate hikes weighed on investor sentiment throughout the year. Our positioning in Industrials, Materials and Energy positively contributed to returns in 2022, but this was offset by our emphasis on large-growth Technology and Communication Services stocks and our Financials positioning.
2022
GTR Net: -23.7%
MSCI World: -18.1%
What We Did: We expected the bull market to continue in a likely back-end loaded year. We anticipated slowing-but-still-healthy economic growth, increasing investor optimism and falling US political uncertainty to support strong late-year returns. We maintained our emphasis on large growth-oriented stocks, remaining overweight to Technology and Communications Services. We also kept underweights to more value and defensive-oriented sectors such as Financials and Consumer Staples.
Outcome: Global stocks ended a painful 2022 down -18.1% with typical client portfolios underperforming. Numerous negative developments such as the Russia-Ukraine war, energy price spikes, China’s COVID lockdowns, elevate inflation and central bank rate hikes weighed on investor sentiment throughout the year. Our positioning in Industrials, Materials and Energy positively contributed to returns in 2022, but this was offset by our emphasis on large-growth Technology and Communication Services stocks and our Financials positioning.
2022
Global Total Return (Net-of-Fees)
Global Total Return (Net-of-Fees)
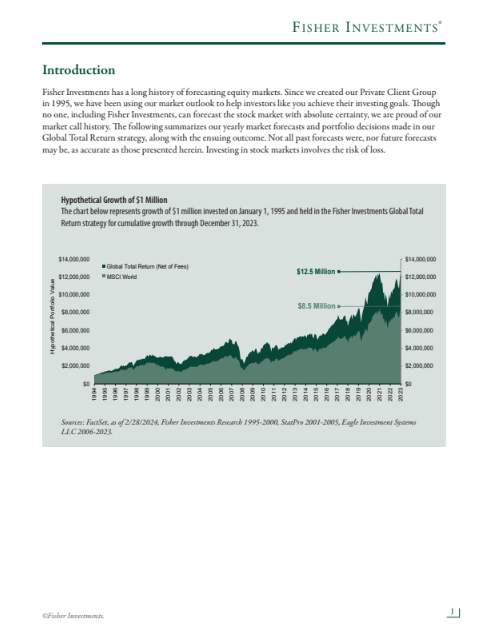
Hypothetical Growth of $1 Million
Sources: FactSet, as of 2/28/2024, Fisher Investments Research 1995-2000, StatPro 2001-2005, Eagle Investment Systems LLC 2006-2023.
Click here for important disclosures.
MSCI World
Global Total Return (Net-of-Fees)
The chart below represents growth of $1 million invested on January 1, 1995 and held in the Fisher Investments Global Total Return strategy for cumulative growth through December 31, 2023.
PLUS: See Cumulative Returns
Fisher GTR Portfolio and Global Market Performance, 1995–2023


GTR Net: 31.2%
MSCI World: 23.8%
What We Did: Our 2023 forecast called for strong returns with stocks continuing to bounce back from 2022’s bear market lows. We expected a gradual return to pre-pandemic economic trends with inflation ebbing and resilient global economic growth. Additionally, we believed post-midterm US congressional gridlock would lessen legislative risk—benefiting markets. We maintained our emphasis on large growth-oriented stocks, remaining overweight to the US, Technology and Tech-like stocks. Our underweights included Health Care, Utilities, Japan and Canada.
Outcome: 2023 played out largely as we anticipated, with slowing inflation, no global recession and deep US political gridlock. Global stocks ended the year up 23.8%, reaching new bull market highs. Large growth stocks—particularly in Tech and Tech-like industries—led as we expected, with their big rebound from 2022 helping typical client equity portfolios outperform. Our US, Health Care and Consumer Staples stock selection also contributed to portfolio returns. Our Energy positioning as well as Consumer Discretionary, Industrials and UK stock selection detracted from portfolio returns.
2023


Thank you for visiting Fisher Investments' "A Long History of Market Calls" interactive experience.
In order to provide you with the best user experience, we have optimized this content for desktop, laptop or tablet view. Please access the link from a different device or use the button below to download a PDF version.
A Long History of
MARKET CALLS


GET PDF