Explore the latest data and trends in JSE Top 40 appointments
2024
Board Monitor
South Africa
Copyright @ 2024 Heidrick & Struggles International, Inc.
All rights reserved. Reproduction without permission prohibited.


CEO & Board Practice
Heidrick & Struggles’ CEO & Board Practice has been built on our ability to execute top-level assignments and counsel CEOs and board members on the complex issues directly affecting their businesses.
Europe CEO & Board of Directors Practice
Kit Bingham
London
kbingham@heidrick.com
Alice Breeden
London
abreeden@heidrick.com

2023 DATA

TRENDS DATA
Snapshot
2023 JSE Top 40 board appointments at-a-glance
PROFESSIONAL EXPERIENCE
DIVERSITY
APPOINTMENTS OVERVIEW

Number and share of appointments


board appointments were made in 2023
51


of JSE Top 40 companies brought on at least one new director
65%
of seats went to first-time public board directors
24%
Professional experience


of seats went to retired executives
67%
went to those active in executive roles
33%


61%
of appointments went to directors with cross-sector experience
35%
of seats went to directors with international experience
Most common type of C-suite experience (Share of appointments)
CEO
CFO
COO
35%
24%
18%
White
4%
African Coloured
54%
African Black
Ethnicity, South African Nationals only
of seats went to women
53%
Diversity
South African Chinese
African Indian
27%
4%
12%


AGE AT APPOINTMENT
ETHNICITY
GENDER
CEO & CFO
BOARD EXPERIENCE
ACTIVE VS RETIRED
NUMBER OF SEATS

Trends, 2020–2023
2020
2021
2023
Black
Indian
Coloured
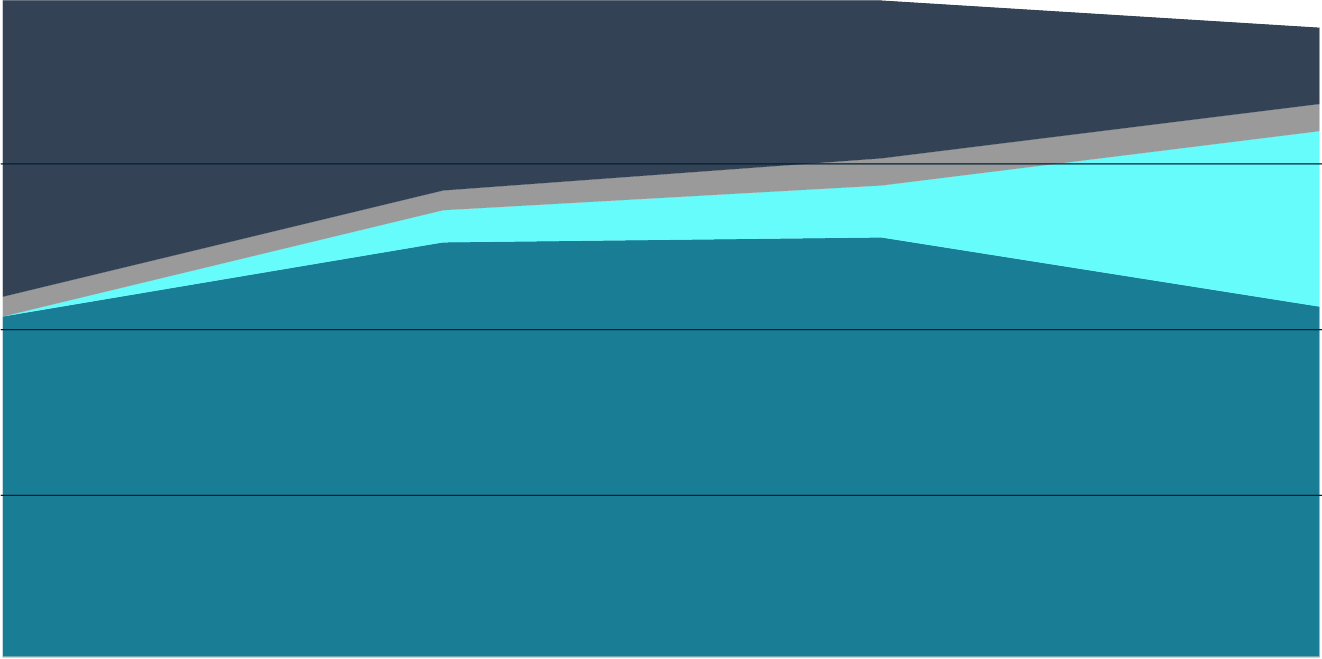
Ethnicity diversity trends
The share of seats going to Black and white directors decreased, while there was a significant increase of Indian directors
Gender diversity trends: Women (%)
The share of seats that went to women continued to decrease in 2023
CEO
CFO
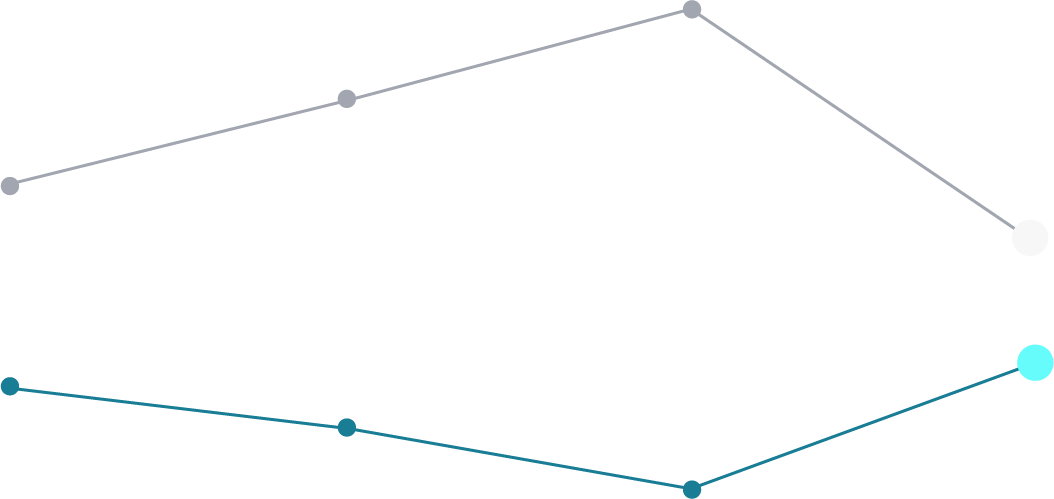
CEO & CFO experience (%)
The share of appointments for directors with CEO experienced was at the lowest level since 2020, while those with CFO experience rose to a new record
First time board members (%)
The share of seats that went to first-time public board directors bounced back compared to 2022
41
50
64
33
Active executives (%)
The share of seats going to directors who are active in executive roles dipped in 2023 to the lowest level since we started tracking in 2020
2020
2021
2022
2023
49
62
39
51
Number of seats filled
The appetite for board refreshments saw a resurgence in 2023
White
100%
75%
50%
25%
0%
Average age at appointment
The average age of people who gained board seats in 2023 remained similar to previous years�


CEO & Board of Directors Practice
Helping organizations lead with purpose to be the best they can be now and in the future
LEARN MORE
Heidrick Insights
Explore the latest thought leadership from Heidrick & Struggles
LEARN MORE
Leadership Agenda:
stay connected
Subscribe to our monthly newsletter for the latest expert insights and trends.
SUBSCRIBE
This analysis is part of Heidrick & Struggles’ long-standing study of trends in board composition in countries around the world. Produced by our global CEO & Board Practice, these reports track and analyze trends in non-executive director appointments to the boards of the largest publicly listed companies in Australia (ASX 200), Belgium (BEL 20), Brazil (B3), Canada (TSX 60), Colombia (COLCAP), Denmark (OMX Copenhagen 25), Finland (OMX Helsinki 25), France (CAC 40), Germany (DAX and MDAX), Hong Kong (Hang Seng), Ireland (ISEQ), Italy (FTSE MIB), India (Nifty Top 200), Japan (TOPIX Core 30), Kenya (NSE Top 40), Mexico (BMV IPC), the Netherlands (AEX), New Zealand (NZX 10), Norway (OBX), Poland (WIG20), Portugal (PSI 20), Saudi Arabia (Tadawul), Singapore (STI 30), South Africa (JSE Top 40), South Korea (KOSPI 50), Spain (IBEX 35), Sweden (OMX Stockholm 30), Switzerland (SMI Expanded), the United Arab Emirates (ADX and DFM), the United Kingdom (FTSE 350), and the United States (Fortune 500). Information about executives is gathered from publicly available sources, BoardEx, and a Heidrick & Struggles proprietary database.
About the research
DOWNLOAD DATA
DOWNLOAD DATA


2020
2021
2022
2023
22
18
13
24
39
47
54
35
43
61
59
53

South African Chinese
57
57
57
57
2020
2021
2022
2023
37
27
13
24
2020
2021
2022
2023
2020
2021
2022
2023
2022
2020
2021
2022
2023
The average age was
Min
Max
57
43
70
57
49%
51%
Non-national
National
Nationality