0
20
40
60
80
100
120
140
2005
2006
2007
2008
2009
2010
2011
2012
$47.4
$40.3
2013 to 2023
2002 to 2012
20-year history - assets and liabilities
Net assets available for benefits
Liabilities
Smoothed assets
2013
2014
2015
2016
2017
2018
2019
2020
2021
2022
2023
$123.0
$103.6
($ billions)
($ billions)
20-year history
- assets and liabilities
Liabilities
Smoothed assets
Net assets available for benefits
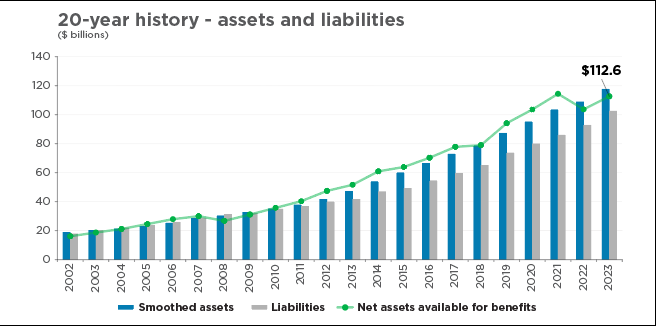
$112.6
2016
2017
2018
2019
2020
2021
2022
2023
2013 to 2023
2002 to 2012
2013 to 2023
2002 to 2012
$114.4
$103.6
$94.1
$79
$77.8
$70.3
$63.9
$60.9
$51.6
$47.4
$40.3
$35.7
$31.1
$26.7
$30
$27.9
2024
$24.5
$112.6
2023
Net assets available for benefits
Liabilities
Smoothed assets
2013
2014
2015
2023