"AI isn’t just an investment, it’s becoming the backbone of enterprise strategy. What the numbers don’t show is the growing divide: while some organizations stall after early deployments, the leaders are scaling fast and pulling ahead. For those treating AI as a true disruptor, this isn’t about catching the next wave; it’s about agents fundamentally changing how value is created and sustained across the enterprise.”
— Steve Chase, U.S. Vice Chair and Global Head of AI and Digital Innovation
AI investment and agent deployment hold steady amid growing focus on pragmatism
Q1 2026
Q2 2026
Q3 2025
Q4 2025
Some or all of the services described herein may not be permissible for KPMG audit clients and their affiliates and related entities. The information contained herein is of a general nature and is not intended to address the circumstances of any particular individual or entity. Although we endeavor to provide accurate and timely information, there can be no guarantee that such information is accurate as of the date it is received or that it will continue to be accurate in the future. No one should act upon such information without appropriate professional advice after a thorough examination of the particular situation. The views and opinions expressed herein are those of the interviewees and survey respondents and do not necessarily represent the views and opinions of KPMG LLP. USC021905 © 2026 KPMG LLP, a Delaware limited liability partnership, and its subsidiaries are part of the KPMG global organization of independent member firms affiliated with KPMG International Limited, a private English company limited by guarantee. All rights reserved. The KPMG name and logo are trademarks used under license by the independent member firms of the KPMG global organization.
BACK TO TOP
kpmg.com
Client stories
KPMG Announces AI Agents to Help Organizations Solve Complex Regulatory and Operational Challenges
KPMG Named SAP Rising Star North America Partner
KPMG alliances
AI thought leadership
KPMG named in HFS Horizons: Agentic Services, 2026 report as a Horizon 3 Market Leader
KPMG and Anthropic sign global alliance and launch Digital Gateway Powered by Claude
KPMG named 2026 Google Cloud Partner of the Year for Global Industry Solutions: Breakthrough
KPMG Debuts AI Digital Assistant to Enhance Month-End Financial Close
Visit the Go-To-Market Materials site to check out more
AI client success stories
Pulse Survey
AI Quarterly
ROI and investment
AI agent deployment and trends
AI agent collaboration and workforce strategies
Accountability and cost visibility
The new value equation
Just as important, what leaders value in talent is shifting.
AI agent adoption is on an upward trajectory, with organizations increasingly integrating agents into business functions, processes, and teams.
KPMG’s You can with AI podcast returns for season 2
KPMG Adaptability Index: Why the push for innovation isn’t translating into adaptability
KPMG & INSEAD: AI Governance Principles for Boards
HP transforms complex M&A with data, analytics, and AI
Powering through a historic audit with sector knowledge and advanced technology
Guiding a healthcare agency to a secure AI journey
How our client turned contract complexity into a fast path to deal value
How Big Brothers Big Sisters and AI work together to improve mentor matching
GEO mandate: optimizing content for AI-generated results
Using as many tokens as possible, often tracked on internal leaderboards.
"Token-maxxing"
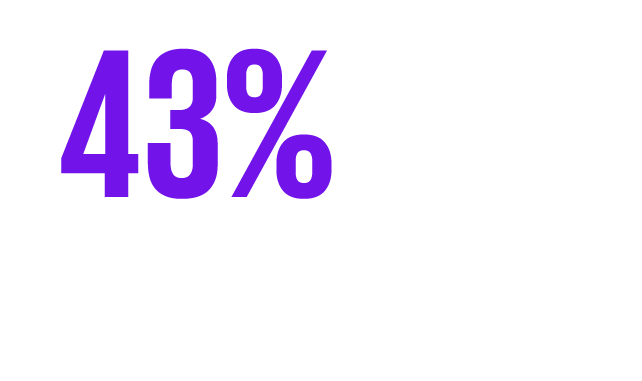
of leaders would consider implementing token-maxxing incentives at my organization to encourage AI usage. Nearly a quarter (22%) are opposed and another 37% remain neutral on the practice.
41%
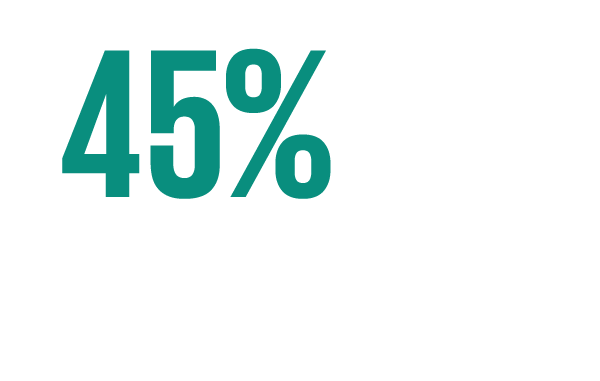
that strong social and interpersonal skills are more important for career success than strong mathematical or technical skills.
54%
agree or strongly agree
their organization’s CEO actively owns AI as a strategic business priority.
67%
KPMG Principal Rahsaan Shears on NYSE TV: Unlocking Behaviors of Sophisticated AI Use
What the Best AI Users Do Differently—and How to Level Up All of Your Employees
2026 KPMG US CEO Outlook Pulse Survey
KPMG launches Global Business Services with KPMG Velocity, enabled by ServiceNow
KPMG strengthens global collaboration with SAP as an SAP Global Strategic Service Partner
KPMG and Rhino.ai Advance Alliance to Drive AI-Powered Government Modernization
Investment and AI agent deployment surge as execution becomes the differentiator
Q2 2025
KPMG, Salesforce & Braven
KPMG US works with Anthropic on Claude for Life Sciences
KPMG is working with Uniphore to help improve efficiency
KPMG Elevates Employee Experience and Client Solutions with Firm-Wide Adoption of Gemini Enterprise
KPMG and Fieldguide Reimagine AI-enabled Assurance to Empower Clients with Precision, Speed, and Insights
AI Quarterly Pulse Survey: Q1 2026
The great skills reset
AI agent deployment crosses the tipping point, new friction follows
Governance becomes a prerequisite for scale
UT Austin and KPMG LLP Study: Behaviors Behind High-Impact AI Use
How to ensure AI agents become the strategic partners in your business to unlock AI’s full value
Why Knowledge Engineering is the Key to Agent Value
Agentic AI untangled: Navigating the build, buy, or borrow decision
KPMG Expands AI Alliance with Google Cloud to Support AI Solutions
KPMG launches KPMG Workbench: a multi-agent AI platform
KPMG Upgrades GenAI Audit Assistant
KPMG Announces Google Cloud Center of Excellence
KPMG Launches "AI Impact Initiative” to Bring AI Technology to Non-Profits
KPMG Collaborates with Databricks to Drive Responsible AI
Some or all of the services described herein may not be permissible for KPMG audit clients and their affiliates and related entities. The information contained herein is of a general nature and is not intended to address the circumstances of any particular individual or entity. Although we endeavor to provide accurate and timely information, there can be no guarantee that such information is accurate as of the date it is received or that it will continue to be accurate in the future. No one should act upon such information without appropriate professional advice after a thorough examination of the particular situation. The views and opinions expressed herein are those of the interviewees and survey respondents and do not necessarily represent the views and opinions of KPMG LLP. USC021905 © 2025 KPMG LLP, a Delaware limited liability partnership and a member firm of the KPMG global organization of independent member firms affiliated with KPMG International Limited, a private English company limited by guarantee. All rights reserved.The KPMG name and logo are trademarks used under license by the independent member firms of the KPMG global organization.
KPMG Alliances:
AI Thought Leadership:
The agentic AI advantage: Unlocking the next level of AI value
You can with AI: a new podcast series from KPMG
Harvard Business Review: How AI Is Redefining Managerial Roles
The Wall Street Journal: From Disruption to Advantage
Information Week: The Battles Shaping the Future of AI
AI at Scale: How 2025 Set the Stage for Agent-Driven Enterprise Reinvention in 2026
KPMG AI Quarterly Pulse Survey | Q4 2025
Q4 2024
Q1 2025
Agent Deployment Accelerates as Organizations Build Confidence
KPMG US Continues to Pave the Way for AI Excellence with Google Agentspace
Strengthening AI Governance: KPMG AI Trust Powered by ServiceNow
Client Stories:
Empowering secure AI adoption in public health
Accelerating M&A transformation at HP
Unlocking GenAI value in global retail
Client Stories
KPMG Alliances
AI Thought Leadership
From ‘fear factor’ to ‘cognitive fatigue’: KPMG principal on when everyone started thinking about AI differently
Agents of change: New organizational roles in the age of AI
Firms harness AI tools in search for competitive edge
Transform Work with Steve Chase, Global Head of AI and Digital Innovation at KPMG
KPMG LLP Among First of the Big Four in the U.S. to Receive ISO 42001 AI Certification
KPMG U.S. Foundation commits $6 million to empowering nonprofits with AI
KPMG Elevates Employee Experience and Client Solutions with Gemini Enterprise
KPMG Integrates Salesforce’s Agentforce into its Daily Go-to-Market Ops
KPMG Accelerates AI Strategy with Agreement to Acquire YData’s IP and Assets
Visit the go-to-market site to check out more
Trust and Barriers:
Security Is a First-Order Constraint and the Catalyst for Enterprise Hardening
Cybersecurity is the Top Investment Priority and Risk
of leaders cite cybersecurity as the greatest barrier to meeting the goals of their AI strategies.
80%
Organizations are Prioritizing Trust and Mitigation
72%
of organizations are prioritizing the deployment of AI agents developed by trusted tech providers as a primary risk mitigation measure.
60%
are preventing AI agents from accessing sensitive data without human oversight.
73%
Trust is strongly correlated with experience, as 73% of leaders say, "the more they use AI, the more they trust it."
Entry-level hiring is being reimagined: 64% of organizations have already altered their approach due to AI agents’ influence, up from 18% last quarter, reflecting the need for new competencies in data, automation, and responsible AI.
Agents as project leads: 44% of leaders expect AI agents to take lead roles in managing specific projects alongside human teams over the next 2 to 3 years.
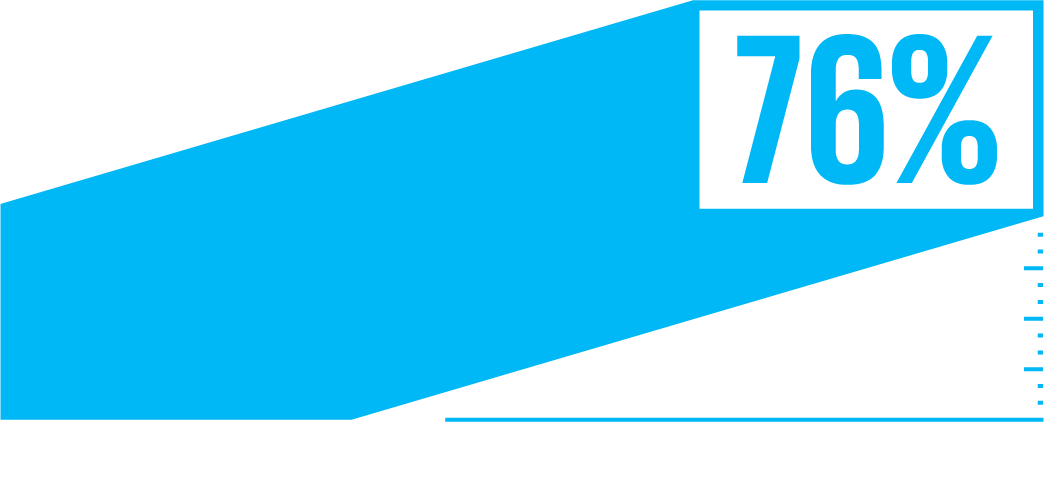
Talent premiums are real: 76% of leaders are willing to offer up to 10% higher compensation for candidates with strong AI skills.
Boards are upskilling rapidly: 40% of leaders say their board members now have substantial AI expertise, a five-fold increase from two quarters ago (8%).
New roles are emerging: AI prompt engineer, AI performance analyst, and AI trainer/data curator are among the most anticipated roles.
As enterprises professionalize and prepare to scale agents, the top-of-mind question for every leader is the size, shape, and skills of their workforce of the future. The differentiator is no longer basic adoption, it’s effective human-agent teaming, grounded in ethical practices and measurable outcomes.
AI + Workforce:
The Great Skills Reset: Designing the Workforce for Human-Agent Collaboration
Hiring Practices are Fundamentally Changing for New Talent
“Much of this work is happening behind the scenes today but it sets the stage for a very different 2026 because value doesn’t come from launching isolated agents,”
“2026 will be the year we begin to see orchestrated super-agent ecosystems, governed end-to-end by robust control systems that drive measurable outcomes and continuous improvement.”
—Swami Chandrasekaran, Global Head of KPMG AI and Data Labs
Expectations for AI's Role are Radically Transforming
44% of leaders now expect AI agents to take lead roles in managing specific projects with human team members within the next 2-3 years.
This is a complete reversal from Q3 2025, when 76% expected humans to primarily manage and direct AI agents.
While the survey shows a decline in agent deployment to 26% (down from 42% in Q3), this figure is still more than double the 11% shown in Q1 2025. The reality is that leaders are accelerating beyond initial deployments, now professionalizing and preparing to scale their agent systems by readying data, investing in infrastructure, and building governance.
With nearly two-thirds of leaders (65%) citing agentic system complexity as the top barrier for two consecutive quarters.
Investment and engineering capacity are focused on production-grade, orchestrated agents - systems that can be governed, monitored, secured, and integrated at scale. Leaders are converging on platform standards that consistently manage identity and permissions, data access, tool catalogs, policy enforcement, and observability, so each new agent strengthens the system rather than adding fragility.
AI Agents:
2026: The Year Agents Move to Professionalized, Orchestrated Systems
Data privacy (77%, up from 53% in Q1) and data quality (65%, up from 37% in Q1) have risen sharply as agent-to-agent workflows and tool integrations expand risk.
Cybersecurity is the single greatest barrier to achieving AI strategy goals—80% of leaders say so, up from 68% in Q1.
Focus is Shifting to Revenue Generation and Overcoming Barriers
59% indicate their organization will continue to invest in AI regardless of its ability to measure tangible ROI, suggesting a long-term strategic commitment.
Projected AI investment over the next 12 months has a weighted average of $124 million, rebounding from a Q2 2025 dip ($88M) after a Q1 2025 level of $114M, and nearing the Q3 2025 peak ($130M).
of leaders report AI will remain a top investment priority for their organization, even if a recession occurs in the next 12 months.
ROI + Investment:
Strategic, Resilient Spending Amid New Pressures
"We’re already seeing agent deployments deliver measurable ROI both inside our firm and with clients. Agents are taking on repeatable, measurable work where time and cost savings show up directly in the metrics organizations track today. That clarity is why leaders feel so confident about achieving ROI in the next 12 months: the results are visible, tangible, and compounding quickly.”
Workforce
Agent deployment accelerates as organizations build confidence through early wins
KPMG AI Quarterly Pulse Survey | Q3 2025
Risk considerations like data privacy and cybersecurity rose from 60% in Q2’25 to 78% in Q3’25.
AI misuse has risen to 45% in Q3'25, reinforcing it as a top societal challenge.
Barriers and trust
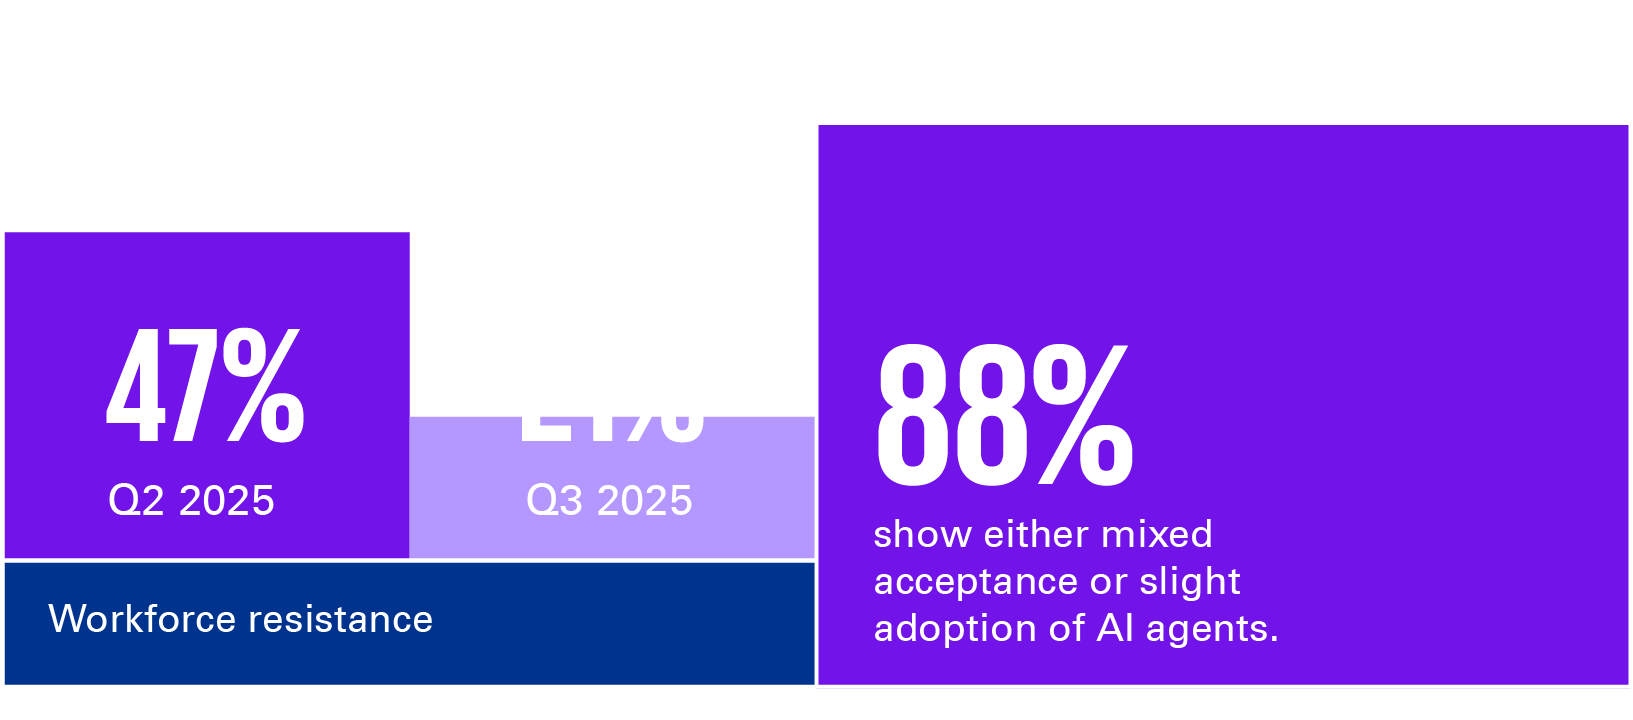
As AI and agents are increasingly integrated into workflows, employee resistance has plummeted from 47% to just 21% in a single quarter.
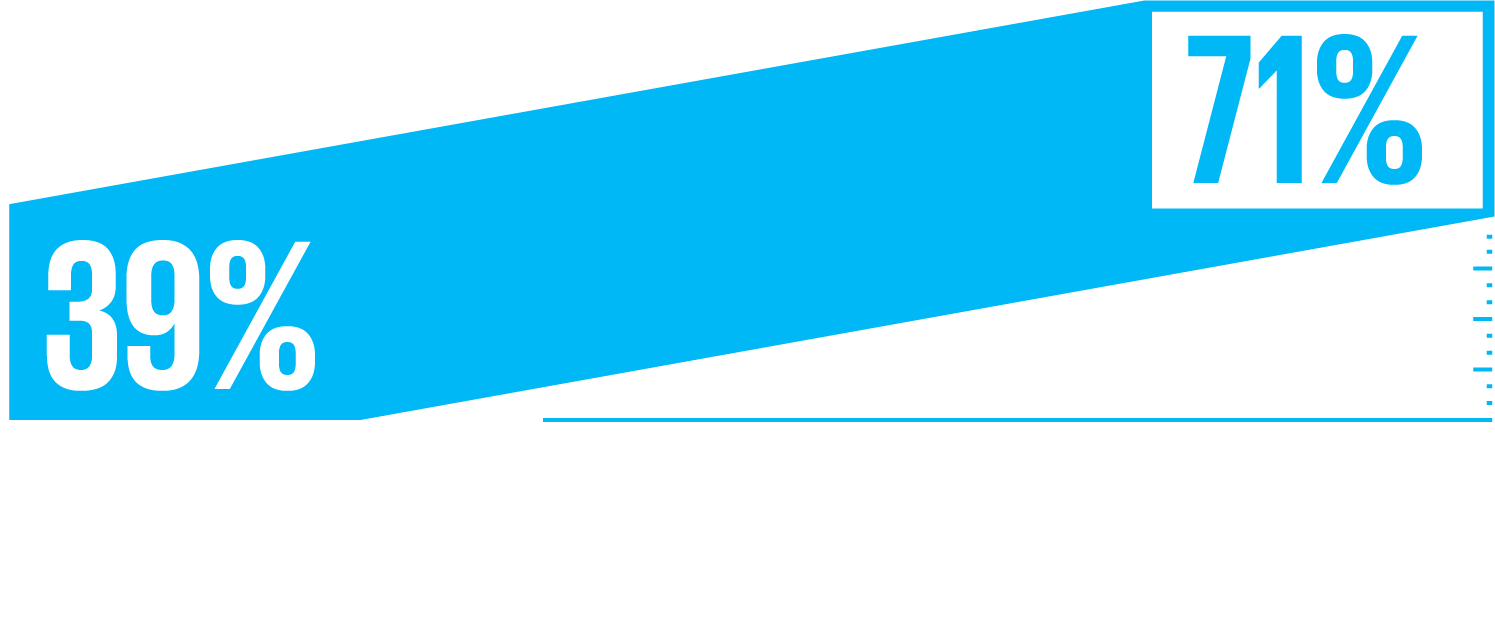
The complexity of agentic systems has emerged as a dominant hurdle, jumping from 39% to 71% quarter-over-quarter as organizations grapple with the intricacies of deploying agents at-scale.
The pilot phase with agents slightly decreased to 55% from 57% in Q2 2025.
AI agent deployment has nearly quadrupled, with 42% of organizations now having deployed at least some agents, up from 11% two quarters ago.
AI Agents
The majority of organizations (90%) are past AI-agent experimentation, 33% of which have achieved the deployment of at least some agents after two consecutive quarters at 11%. Another 57% of organizations are piloting agents, down from 65%, and 10% are exploring the possibility of using agents, compared to 25% last quarter.
From Q2'25 to Q3'25, tariffs continued to drive focus on AI efficiency and optimization (76%).
When it comes to demonstrating ROI to investors, profitability and established responsibility and governance policies were both the most important factors, according to 55% of leaders. Productivity was the fourth most important factor as it relates to demonstrating ROI to investors (38%).
While overall investment projections are down from last quarter, $88 million from $114 million, specific categories of spend are tracking to the challenges leaders cite – 68% are planning to invest between $10-49.9M in data and analytics, up from 26%. Another 51% will invest in research and development and 32% will invest in purchasing technology and solutions.
agree or strongly agree that traditional business metrics are becoming insufficient in measuring AI's impact.
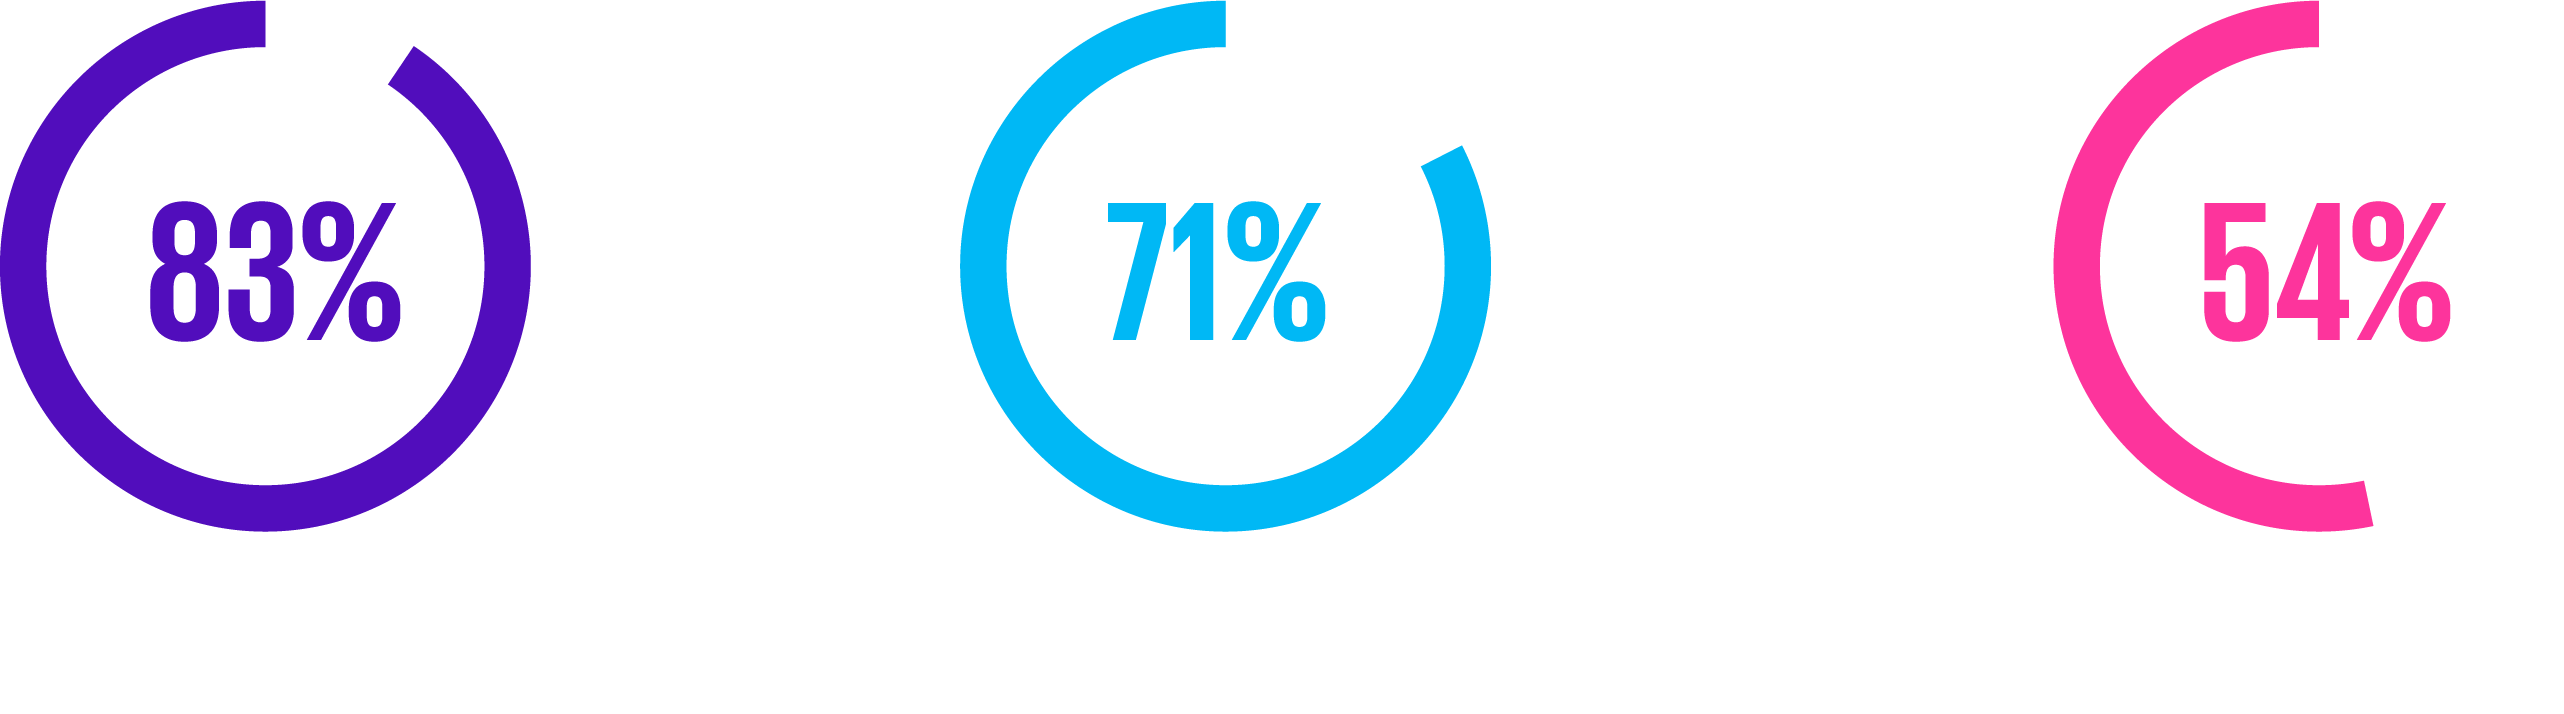
Most leaders (83%) cite role specific experience as the top skill they are looking for in entry-level employees as a result of ongoing agent adoption, followed by adaptability and continuous learning (71%), and critical thinking and problem solving (54%).
As for the future of human-agent collaboration, 76% of leaders expect employees to manage agents within the next 2-3 years.
employee response varies with some embracing and others resisting AI agents.
employees are beginning to accept and integrate AI agents into their work.
employees enthusiastically adopted AI agents and are fully integrating them into workflows.
How have AI agents been received by employees?
Top skill leaders looking for in entry-level employees.
Visit the go-to-market site to check out more AI client success stories.
employees have significantly resisted or pushed back against AI agents.
76%
Data quality has emerged as the top barrier to AI success, with 82% citing it as critical compared to 56% last quarter. Cybersecurity concerns have similarly intensified, now affecting 78% of organizations.
AI is reshaping how organizations measure value, with 78% of leaders saying traditional metrics fail to capture its business impact.
78%
Business growth and investment
Leaders are projecting an average of $130 million in investment for the next 12 months, up from $114 million in Q1 2025.
Strategic investments are accelerating across key areas:
Data & analytics nearly doubled from 11% to 20%, GenAI technology purchases increased from 11% to 17%, and research & development grew from 11% to 16%.
Anticipated investment
78% of leaders report facing significant pressure from investors and boards to demonstrate AI value
AI Agents Move Beyond Experiments as Leaders Prepare for Transformation
KPMG Advances AI-Enabled Compliance in Anecdotes
KPMG LLP Announces Strategic Investment in Agentic AI Startup Ema
WSJ: Readying the Enterprise for Agentic AI
Navigating 2025's Landscape for Boards and Audit Committees
AI is rewriting the playbook, with 82% of leaders agreeing their industry’s competitive landscape will look different in the next 24 months.
See below to learn more.
“The data shows just how quickly AI agents are moving out of pilots and into production – and that momentum will only accelerate. What makes this moment unique is that leaders increasingly see agents not just as a way to cut costs, but as a way to rethink growth and create new value. But we’ve seen firsthand, both in our own journey and with clients, how transformation at this pace puts real pressure on the foundations of AI: trust, governance, data, leadership alignment, and workforce readiness. The organizations that invested early in these areas are now scaling with confidence and positioning themselves to lead in this next phase,”
— Steve Chase, Vice Chair of AI and Digital Innovation, KPMG LLP
Business Growth & Investment
Agents and workforce
AI agents move beyond experimentation as leaders prepare for competitive transformation within 24 months
KPMG AI Quarterly Pulse Survey | Q2 2025
When it comes to society-wide challenges with AI between now and 2030, leaders believe misuse of AI by bad actors, including cybersecurity and misinformation will now be the greatest challenge (38%, up from 30% in the 4th quarter), followed by the trust in the accuracy and fairness of AI outputs (37%, up from 32%).
When it comes to mitigating risk with agents, leaders are showing evolving comfort levels. 55% are looking to deploy AI agents developed by trusted tech providers (down from 63%). 45% of leaders are not yet comfortable with autonomous agents and will require human-in-the-loop oversight (up from 28%) and another 45% are not allowing AI agents access to sensitive data without human oversight (down from 52%).
KPMG 2025 Futures Report
Trust and risk mitigation
In the next year, 82% of organizations expect AI agents to play important roles as team members, while 80% believe new jobs focusing on AI will emerge. Nearly nine in ten leaders think agents will require organizations to redefine performance metrics and will also prompt organizations to upskill employees currently in roles that may be displaced.
This acceleration, however, reveals continued challenges. The primary obstacles to agent deployment include technical skills gaps (59%), workforce resistance to change (47%), and system complexity (39%).
Nearly half of leaders (46%) are equally focused on efficiency and revenue growth as it relates to their AI agent strategies.
Agents
With concerns about data privacy (69%) and data quality (56%) at their highest since last year, and macroeconomic factors considered the top factor influencing near-term strategies (69%), board oversight and strategic guidance have never been more critical to navigating AI deployment.
Only 8% of leaders believe their organizations have substantial AI board expertise, even though 45% say their board covers AI-related topics in every meeting.
For organizations, productivity (98%) and profitability (97%) continue to be the top ROI metrics, followed by improved performance and work quality (94%). However, when communicating results to investors, leaders emphasize slightly different priorities — profitability and established responsibility and governance policies are the most important factors for demonstrating ROI, according to 55%.
KPMG and Rhino.ai Announce Strategic Alliance
AI fuels optimism for semiconductor leaders despite geopolitical headwinds
Partner Ecosystems Playing a Central Role in Business Growth
2024 KPMG American Worker Survey
The vast majority of leaders agree that GenAI investments to-date have enhanced their company’s competitive position and are planning to increase investments over the next year.
“We’re seeing a clear shift from pilots to scaled execution, with CIOs increasingly leading the charge. While that may seem like a natural decision given the scale of change in both technology and how it’s delivered – AI is also an enterprise transformation. It requires rewriting business processes, disrupting offerings, and driving cultural change. Leading organizations are creating space – often through a dedicated AI leader – to fully own that broader vision and protect the transformation from unnecessary risk.”
Workforce & Talent
Risk management, trust, and workforce readiness emerge focus areas as investment, adoption and AI-agent pilot programs grow.
KPMG AI Quarterly Pulse Survey | Q1 2025
The vast majority of organizations – 99% – are planning to deploy agents with 67% of leaders planning to buy a pre-built AI agent solution, and another 27% are planning for a combination of both (a combination of internal build plus buy).
88% of respondents cite macroeconomic factors as the top factor of concern influencing AI strategies- 6 months ago, today and 6 months from now.
Knowledge assistants are becoming mainstream for over half of knowledge workers. Employees are increasingly using AI productivity tools on a daily basis – up to 58% from 22% last quarter. Knowledge assistant (RAG models) usage is up to 61% from 48% on a weekly basis. GenAI usage embedded into existing workflows is up from 24% to 35%.
When asked what anticipated challenges are expected in training employees to work with agents, the top three choices were: complexity of systems (66%), rapidly evolving technology (56%) and technical skills gaps (51%).
In the next 12 months, 76% of leaders agree or strongly agree AI will automate specific tasks but will not replace roles entirely. 69% agree or strongly agree AI will help strong performers focus on more strategic work. Another 57% believe AI will help low performers become stronger performers.
52% of executive management is using GenAI a significant amount, compared to 20% of entry level employees.
41% of people managers and 39% of middle managers report using GenAI a significant amount.
Investor pressure to demonstrate ROI on GenAI investment is important or very important for 68% of respondents. Few have recruited board members with expertise but 91% plan to do so, while 73% of leaders are measuring improved profitability to track ROI.
Anticipated GenAI investment in the next 12 months is up significantly quarter over-quarter, from $89 million to $114 million.
The majority of organizations are past the experimentation phase with AI agents, however, are far from full deployment.
AI’s impact on business, economy and society
Notably, those who believe it will have a significant impact leaped from 2% a year ago to 45% today.
Nearly 9 in 10 (88%) of business leaders report that today they believe AI will have a moderate to significant impact by
What’s more, 99% expect it to be a positive impact, with 52% saying very positive – a big jump from just 3% a year ago.
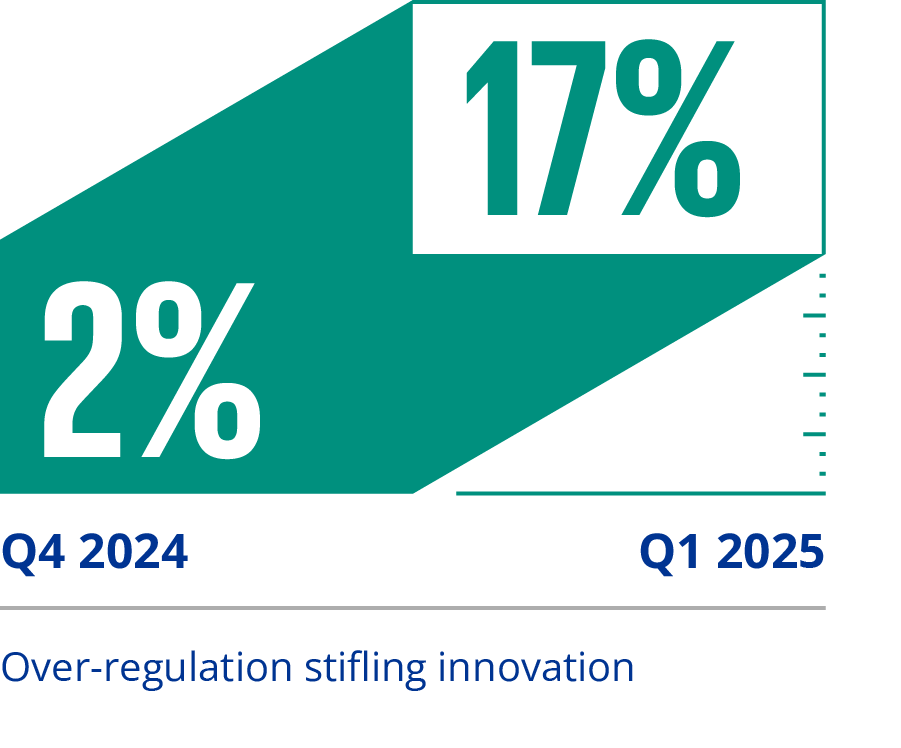
When it comes to society-wide challenges with AI between now and 2030, leaders believe trust in the accuracy and fairness of AI outputs will now be the greatest challenge (32%, up from 20%), followed by the misuse of AI by bad actors, including misinformation (30%, down from 50%), and over-regulation stifling innovation (17%, up from 2%).
GenAI 2024 Survey
KPMG Launches "AI Impact Initiative” to Bring AI to Non-Profits
As macroeconomic pressures, investor demands, and efficiency imperatives mount, business leaders are actively working to align their GenAI ambitions with practical execution.
"Our latest pulse survey confirms what we’re seeing with clients: organizations are doubling down on AI investments. The data also shows growing momentum around AI agents, with over half of organizations exploring their use. Leaders are putting real dollars behind agents, but with mounting pressure to demonstrate ROI, getting the value story right is critical."
— Steve Chase, Vice Chair of AI and Digital Innovation, KPMG U.S.
High hopes, high hurdles, and the pursuit of realizing value in 2025
KPMG AI Quarterly Pulse Survey
Leaders expect to utilize the capability for administrative duties (60%), call center tasks (54%) and to develop new business materials (53%), within the next 12 months.
Over half (51%) of organizations are exploring the use of AI agents and another 37% are piloting AI agents.
Most respondents plan to use AI agents as call center agents, to perform administrative tasks, recruit new employees or develop business materials, however, few have done so already. Currently, only 12% of respondents have deployed AI agents for use across their organizations.
Leaders expect to utilize these AI agent capabilities within the next 12 months
The majority of respondents feel that AI will fundamentally change the nature of their business over the one-to-two-year horizon (56% in the next year and 67% in the next two years).
68% of leaders will invest between $50-$250 million in GenAI over the next 12 months, up from 45% in Q1 of 2024.
KPMG Announces AI Integration into Global Smart Audit Platform
Some or all of the services described herein may not be permissible for KPMG audit clients and their affiliates and related entities. The information contained herein is of a general nature and is not intended to address the circumstances of any particular individual or entity. Although we endeavor to provide accurate and timely information, there can be no guarantee that such information is accurate as of the date it is received or that it will continue to be accurate in the future. No one should act upon such information without appropriate professional advice after a thorough examination of the particular situation. The views and opinions expressed herein are those of the interviewees and survey respondents and do not necessarily represent the views and opinions of KPMG LLP. © 2025 KPMG LLP, a Delaware limited liability partnership and a member firm of the KPMG global organization of independent member firms affiliated with KPMG International Limited, a private English company limited by guarantee. All rights reserved.The KPMG name and logo are trademarks used under license by the independent member firms of the KPMG global organization.
DT#021905
The quality of organizational data is the biggest anticipated challenge to AI strategies in 2025 (85%), followed by data privacy and cybersecurity (71%), and employee adoption (46%).
Employee adoption is a top three challenge in 2025, and 81% of leaders are planning on including GenAI in their performance reviews. Only 19% are doing so already.
Counter to traditional bottom-up technology adoption patterns, leaders appear to be utilizing GenAI more than middle to entry level employees, suggesting the possibility of underreported usage and governance gaps across the enterprise.
When it comes to society-wide challenges with AI between now and 2030, leaders believe misuse of AI by bad actors, including cybersecurity, misinformation and election interference (50%), energy use and its impact on the environment (26%) and trust in the accuracy and fairness of AI outputs will prove the most difficult to navigate.
Trust becomes a critical priority as GenAI adoption accelerates
Personal trust in GenAI is now considered a top three challenge, according to over a third of leaders (35%).
When asked what risk mitigation measures are being considered when it comes to AI agents in the next 6 to 12 months, 63% of leaders plan to deploy AI agents developed by trusted tech providers (up from 23% in Q4), another 52% are not allowing AI agents to access sensitive data without human oversight (up from 31% in Q4).
Risk management is a strategic imperative
82% of leaders expect risk management such as data privacy and cybersecurity to be the biggest challenge to their GenAI strategy in 2025, followed by quality of organizational data (64%).
As organizations approach the next phase of their strategies, they recognize that successful transformation requires continued investment in underlying data capabilities and ready-to-deploy solutions.
Data privacy and security is by far the most important decision factor when choosing a GenAI (LLM) provider, increasing 43% to 73%. This was the only category that increased compared to Q4.
Currently, most organizations are piloting AI agents – up from 37% to 65% – since last quarter. However, organizations that are deploying agents are still few and far between. That number remains flat quarter-over-quarter.
KPMG and SAP Joule: Pioneering the Future of AI-Driven Consulting
KPMG AI Quarterly Pulse Survey | Q4 2024
KPMG GenAI Study:
Some or all of the services described herein may not be permissible for KPMG audit clients and their affiliates and related entities. The information contained herein is of a general nature and is not intended to address the circumstances of any particular individual or entity. Although we endeavor to provide accurate and timely information, there can be no guarantee that such information is accurate as of the date it is received or that it will continue to be accurate in the future. No one should act upon such information without appropriate professional advice after a thorough examination of the particular situation. The views and opinions expressed herein are those of the interviewees and survey respondents and do not necessarily represent the views and opinions of KPMG LLP. © 2024 KPMG LLP, a Delaware limited liability partnership and a member firm of the KPMG global organization of independent member firms affiliated with KPMG International Limited, a private English company limited by guarantee. All rights reserved.The KPMG name and logo are trademarks used under license by the independent member firms of the KPMG global organization.
2024 KPMG Generative AI Consumer Trust Survey
The Path to Sustainable Returns
KPMG Trusted AI and the Regulatory Landscape
KPMG 2023 Consumer Technology Survey
KPMG Named Informatica's 2023 Global Innovation Partner of the Year
KPMG US and IBM Expand Alliance in Energy & Utilities
KPMG Commits to Building a Future of Artificial Intelligence with Salesforce
How much in USD do executives plan to invest in GenAI over the next 12 months?
$50 - 100M
$100 - 249M
$250 - 499M
23%
22%
15%
What are the greatest value opportunities as it relates to GenAI investment?
enhancing products and services by analyzing customer data
improving supply chain efficiency and reducing cost
improving product quality, efficiency and innovation
enhancing efficiency to generate greater productivity
50%
42%
37%
48%
ROI metrics are rapidly evolving with the majority of business leaders prioritizing revenue over productivity gains, a drastic shift from last quarter.
91%
47%
25%
Technology, Media & Telecommunication
Financial Services
Healthcare
GenAI strategies have hit a new inflection point. As we reach the midpoint of 2024, C-suite and business leaders are no longer just investing in the technology, they are aggressively scaling GenAI to unlock new revenue streams, maximize ROI and cement their competitive advantage.
"Leaders are beginning to view GenAI investment and adoption as table stakes. Now, they’re focused on how to translate those investments into a competitive advantage. Organizations are making a massive push for AI talent and adjusting their business strategies to capitalize on GenAI’s transformative potential."
When it comes to expectations regarding GenAI investments, leaders have different goals - but AI investment remains a priority for 97% of those surveyed in the first quarter of the year.
2023 US Customer Experience Excellence Report
With GenAI, the top ways executives are currently measuring ROI include:
The majority (51%) of executives are measuring return on investment (ROI) of AI through productivity gains.
Nearly half of respondents are measuring ROI through employee satisfaction (48%) and amount of revenue generated (47%).
Opportunities to create value have shifted, with improving product quality, efficiency and innovation at the top of the priority list.
Enhancing products and services by analyzing customer data
Q1
Q2
49%
Improve supply chain efficiency and reduce costs, leading to increased profitability and revenue
Enhancing efficiency to generate greater productivity
Improving product quality, efficiency and innovation
Improving supply chain efficiency and reducing cost
Enhance existing products and services by analyzing customer data and identifying unmet needs and preferences
Headline text...
46%
38%
Enhance efficiency to generate greater productivity
Improve product quality, efficiency and innovation
Productivity
Revenue generated
Employee satisfaction
Improved decision making
Improved productivity
[New graphic (2) comparing Q1 and Q2 top stats: ]
52%
51%
44%
The majority (80%) of C-suite and business leaders across the U.S. now recognize GenAI as important to maintaining a competitive advantage and gaining market share.
The emphasis on hiring tech professionals has more than doubled from 26% to 60% quarter-over-quarter. Simultaneously, organizations are heavily investing in upskilling their existing workforce, with training and capability building initiatives jumping from 35% to 59%.
Boards are increasingly seeking GenAI experience with 73% of leaders planning to recruit new board members to guide GenAI strategy and oversight.
Leaders overwhelmingly picked Technology, Media and Telecommunication (TMT) as the sector leading in GenAI adoption
When choosing GenAI providers, leaders prioritize technology and expertise (67%), scalability and performance (65%) and use case compatibility (54%).
65%
Hiring
Upskilling
26%
35%
59%
Technology and expertise
Scalability and performance
Use case compatibility
KPMG LLP launches KPMG Digital Finance
5th graphic: The bar chart doesn’t reflect the data findings. Can we bold this clause? “training and capability building initiatives jumping from 35% to 59%”
Leaders overwhelmingly picked TMT as the sector leading in GenAI adoption (91%), followed by financial services (47%), and healthcare (25%).
6th graphic: The title is off-center. Also, feel like the graphic is a lot of blue and the text is really small. It takes up a lot of space. I would only bold the following instead: “technology and expertise” “scalability and performance” “use case compatibility”
4th graphic: I also find this chart hard to read – could we do something else?
Third graphic: Change all the verb tenses to “enhancing,” improving etc. Also, I find this graphic hard to read – what about a line graphic?
First chart – change the pie chart graphic. This is our most important stat, so it needs to visually pop.
8th graphic – needs a header which should be what is currently under the 91%: Leaders overwhelmingly picked TMT as the sector leading in GenAI adoption Then under the 91% add “TMT” Capitalize “Services” in Financial Services
20%
C-suite and business leaders across the U.S.
The 2024 KPMG U.S. CEO Outlook Pulse Survey
Navigating The AI Era In Financial Reporting
KPMG GenAI Study: the path to sustainable returns
40%
Improving supply chain efficiency and reduce costs, leading to increased profitability and revenue
Enhancing existing products and services by analyzing customer data and identifying unmet needs and preferences