0%
20%
40%
60%
80%
100%
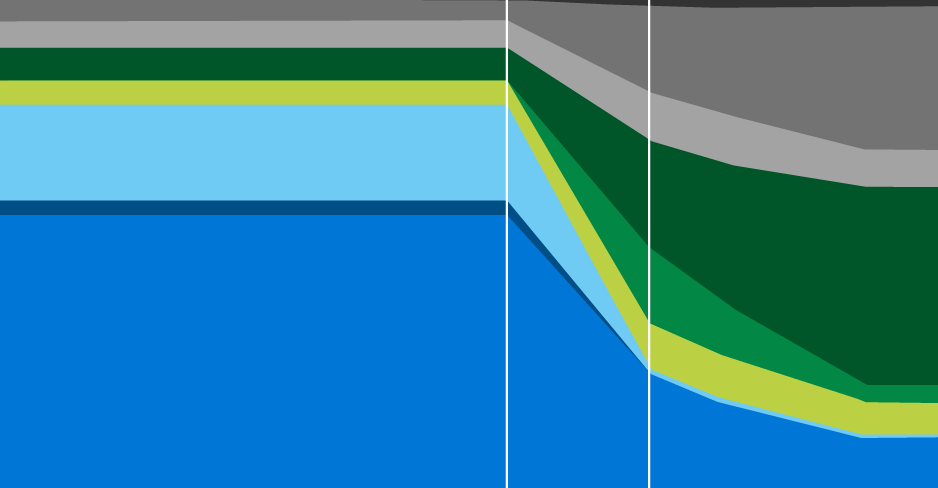
Growth stage
�more than 10 years to retirement
Retirement stage
less than 10 years to retirement
Stage 3
Retirement
- 45
- 10
0


Accumulation
Decumulation


Select a year circle above to view more detail figures below
Year before retirement
Year into retirement

- 40
- 35
- 30
- 25
- 20
- 15
- 5
+10
+5
+15
+20
UK Equity All Cap
Japan Equity
Government Bonds
Private Markets
Developed Small �Cap
Asia Pacific ex �Japan Equity
Alternative and Active Credit �
North America Equity
Emerging �Market Equity
Listed Alternatives
Europe ex UK Equity
Investment Grade
Corporate Bonds
Cash
Please supply figures under yellow in an excel doc for each year group
Are we keeping accumulation an
1%
0.3%
4.7%
4.5%
6.7%
4.8%
77.9%
3%
56%
1%
0.3%
4.7%
4.5%
6.7%
4.8%
77.9%
3%
56%
4.5%
1.6%
6.8%
64.3%
35.3%
6.8%
10.9%
0%
10%
1%
0.3%
4.7%
4.5%
6.7%
4.8%
77.9%
3%
56%
8.1%
1%
6.9%
11.7%
14%
7%
51.3%
0%
40%
16.2%
1.7%
9%
18.8%
21%
9.1%
24.2%
0%
23%
2%
22%
10%
29%
10%
9%
1%
0%
17%
7.9%
1.6%
7.9%
29.3%
30.9%
7.9%
14.5%
0%
10%
4.5%
1.6%
6.8%
64.3%
35.3%
6.8%
10.9%
0%
10%
Asset allocation is subject to change

