As the chart above shows, trade openness has ebbed and flowed through the decades.
Using the International Monetary Fund’s metric for globalization – the sum of exports and imports of all economies relative to global gross domestic product – globalization has been slowing since the global financial crisis. The open trade that followed the end of the Cold War in the 1980s looks set to splinter to regionalization. It’s not a move back to 1930s nationalism, but a quest for a middle way between that and unfettered global trade.
But it’s a shift that could have significant consequences for macro-economic conditions, financial market returns and risks. Indeed, a less open economy is generally thought likely to presage a moderately higher rate of inflation, which would reduce global growth. On the bright side, the prioritization of the green economy by all three major trading blocs is likely to hasten the green transition.
Slowbalization
Liberalization
Fixed exchange rates
Wars, protectionism
Industrialization
Intense competition between great powers and mounting security issues are increasing risks to economic growth and investment returns.The world’s three big trading blocs are turning inwards, as they seek to promote strategic industries.
A NEW ERA: FROM DEGLOBALIZATION TO REGIONALIZATION
Trillion
$2
Source: Reuters
– the amount the U.S. Congress
alone has made available over
the last two years for America to reindustrialize itself, improving competitiveness and national security.
President Biden’s industrial policy follows China’s subsidies for strategic industries since 2015. Alarmed by the prospect that it might now become uncompetitive, EU policymakers have vowed to match U.S. subsidies.

Trade openness slowed following the global financial crisis.
Eras of globalization


Source: IMF
Sum of exports and imports as a percent of GDP
60
50
40
30
20
10
0
2020
2000
1980
1960
1940
1920
1900
1880


Download the PDF


PRESENT

+

OUTFRONT SERIES
Further, it imposed a sweeping set of export controls in 2022, aiming to cut off China’s access to certain semiconductor chips made anywhere in the world with U.S. equipment, in a bid to slow Beijing’s technological and military advances.
Source: Reuters
As if the enormous scale of this were not enough, Biden has chosen to keep the tariffs against China imposed by the Trump administration in place.
Initially, this is a 10-year plan to rapidly develop 10 high-tech industries, including electric vehicles, next-generation information technology and telecommunications, and advanced robotics and artificial intelligence. Under the policy, direct support is being given through state funding, low interest loans, tax breaks and other subsidies to favored manufacturers in these sectors. The exact amount is unclear but some outside estimates put it at hundreds of billions of dollars.
The European Chips Act, introduced in 2022, eased state aid rules for semiconductor plants, in a move intended to release €17 billion ($15 billion) in additional public and private investment by 2030. It also introduced the International Procurement Instrument, limiting non-EU companies’ access to public tenders if their governments do not offer EU companies similar access. Most recently, the European Commission has opened the way for large-scale public funding of green projects.
Source: European Union Chamber of Commerce in China.
Source: Reuters
Source: Reuters
For its part, China introduced its Made in China 2025 industrial strategy in 2015, with an aim to transfer the country “from a manufacturing giant to a world manufacturing power” by 2049, the centennial anniversary of the people’s republic.
As the third big economic bloc, the EU plans to match U.S. subsidies in a bid to defend its own green high-tech economy, taking inspiration from the U.S.


China's efforts are a move toward self-sufficiency in chips and to counter U.S. moves designed to slow its technological advances.
In response to the U.S. CHIPS Act, China is reportedly working on a more-than-1-trillion yuan ($143 billion) support package for its semiconductor industry.


Infrastructure Investment and Jobs Act
Nov. 15, 2021
CHIPS and Science Act
Aug. 25, 2022
Inflation Reduction Act
Aug. 16, 2022
Total U.S. Government Spending Spree

$1.2 trillion
$2 trillion

$280 billion
More than $400 billion


Globalization took off in the 1950s after World War II and then accelerated at the time of the establishment of the World Trade Organization in 1995. Since then China has supplanted the U.S. as the biggest trading nation.
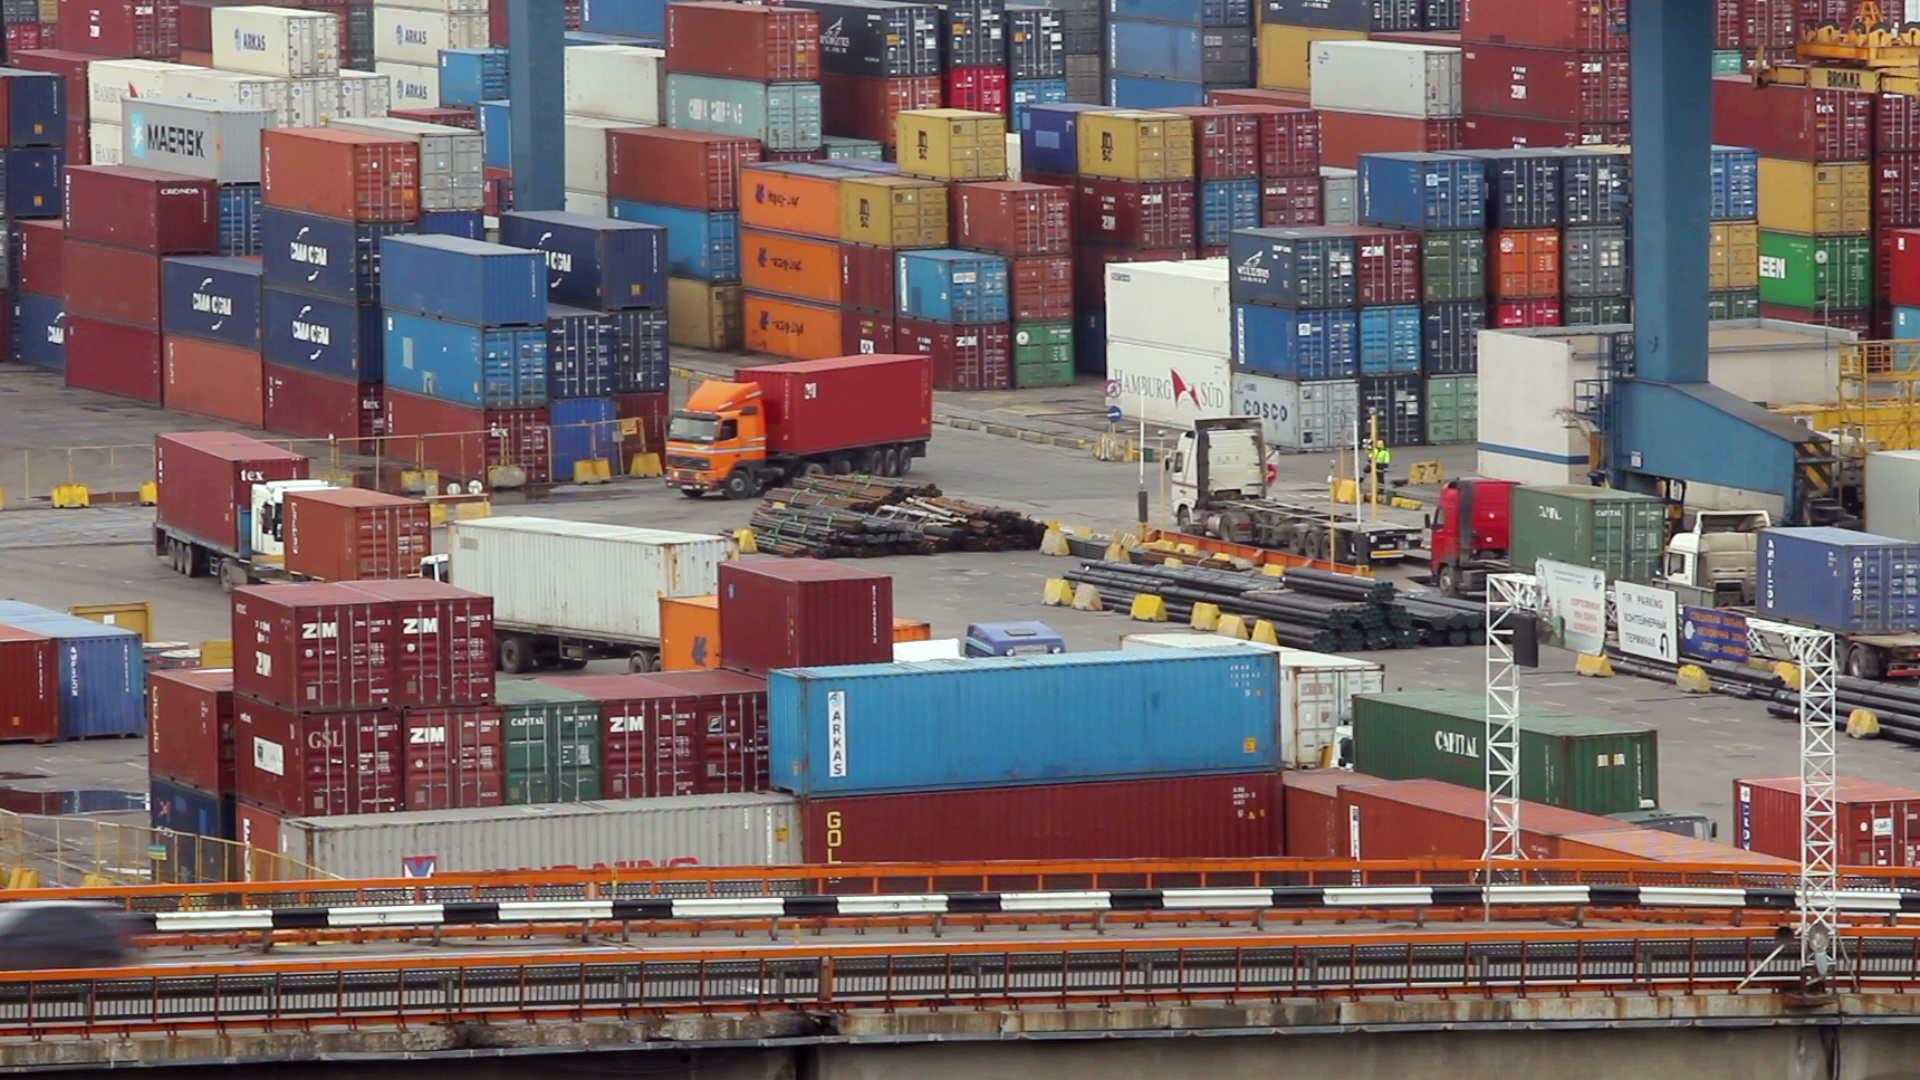
But globalization has been slowing since the time of the 2008 financial crisis. Now the war in Ukraine and heightened geopolitical competition threaten to slow it still further. Even as world trade hits a record of $32 trillion for 2022, the major trading blocs are turning inwards in the name of national security and competitiveness.
Source: UNCTAD estimate
Source: Lowy Institute
Source: White House
Global trade through a U.S.- China lens
The Infrastructure Act makes $1.2 trillion available over 10 years for roads, bridges and cables for a new green grid. The CHIPS Act, which promotes making semiconductors in America, earmarks $280 billion of spending. And the Inflation Reduction Act includes $400 billion in subsidies for green tech over 10 years, which some analysts suggest may rise.
The U.S. is on a mission to remake its economy, while curbing trade with China and Russia. Taken together, $2 trillion has been pledged to do so.


1
Big 3 trading blocs turn inwards

Friend-Shoring

Linking trade to values, she said that the U.S. would now favor “the friend-shoring of supply chains to a large number of trusted countries” that share “a set of norms and values about how to operate in the global economy.”
Source: Boston Consulting Group
Janet Yellen, the U.S. Treasury Secretary, coined a new phrase at the Atlantic Council meeting in Washington in April 2022 – “friend-shoring.”
Trade Flows
Fundamental shifts in trade flows are underway as geopolitical friends trade with each other.
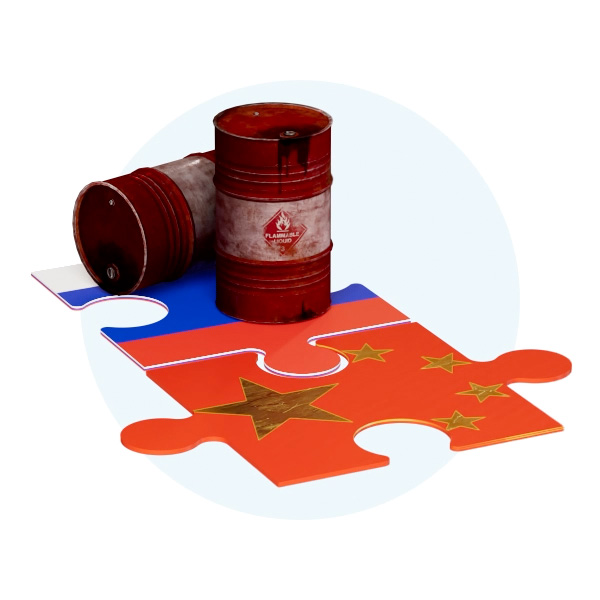
This is most evident in oil and gas, as China became the biggest buyer of Russian oil in 2022 after a combination of Western sanctions and Russia’s decision to cut gas supplies to Europe.
Germany, Europe’s largest gas consumer, has struck a deal to import Qatari LNG from 2026 and is constructing floating LNG terminals.
Source: Reuters
Source: Reuters
Source: Reuters
Meanwhile, Europe’s biggest gas consumers are buying Norwegian gas and turning to international suppliers of liquified natural gas (LNG).
In the past year, China and India have been paying for Russian commodities in renminbi, rupees and UAE dirhams.
Source: Reuters
Source: Reuters
Brazil and Argentina have announced plans for a currency union, aiming to boost trade and reduce reliance on the dollar, though many economists are skeptical.
Source: Reuters
Source: Reuters
India has launched a rupee settlement mechanism for international transactions.
China has asked the GCC (Gulf Cooperation Council) countries to make full use of the Shanghai Petroleum and Natural Gas Exchange for the renminbi settlement of oil and gas trades.


Dedollarization?
As the global trading system drifts into different camps, so threats to the dollar-based monetary order are mounting.
2
Toward a jigsaw of fragmentation and regionalization
As the big economies become more protectionist, so trading blocs are forming, based on geopolitical security friendships and regionalization. Already, this is leading to a rearrangement of trade flows and a ratcheting up of the risks of protectionism.
The current trend suggests a significant redrawing of the global trade map.
Source: Boston Consulting Group
Source: Reuters

Trade restrictions imposed by sector


2009
2010
2011
2012
2013
2014
2015
2016
2017
2018
2019
2020
2021
2022
0
500
1000
1500
2000
2500
Number of restrictions
Goods
Investment

Services


Source: IMF


Cheap as Chips?
The U.S. reportedly secured a deal with the Netherlands and Japan in early 2023 to restrict exports of advanced chip-making machinery from companies based in these countries. More generally, data from the Global Trade Alert database shows that countries are imposing a growing number of trade restrictions, notably in high-tech sectors.
Source: Reuters
Turning to semiconductor chips, the U.S. restricted exports of advanced chipmaking equipment to China in October 2022 in an effort to slow its technological advance.

April
2021
April
2022
Increasing inventory along the supply chain


61
47
planned in May 2020
80
April
2021
April
2022
Dual sourcing of raw materials


55
53
planned in May 2020
81

April
2021
April
2022
Regionalizing the supply chain


25
38
planned in May 2020
44

Source: McKinsey survey of global supply chain leaders April 2022
*Question: Which of the following options (if any) have you already taken or initiated (since date) to increase your footprint resilience?
How global supply chain leaders are shifting focus
Supply chain change implementation*, % of respondents (n = 113)
Globalization is not the powerful force, particularly disinflationary force, that it might have been five years ago. And it's caused CEOs to rethink how they approach their access, not only to materials, but also to think about their access to labor, and again, to be more partial to things that they have more confidence in and access to closer to home. Just-in-time inventory is great, but just-in-case inventory might be better.”
Rob Kaplan


Former President of the Federal Reserve Bank of Dallas


Just-in-Time to Just-in-Case Supply Chains
Significant changes are planned to supply chains in order to make them more resilient, including higher inventories and diversification of sourcing. As they use suppliers closer to home, companies are increasingly speaking of “reshoring,” “onshoring” and “near-shoring”.
Companies with international supply chains are turning from “just-in-time” supply chains to “just-in-case” in reaction to the interruptions of the successive Covid-19 and Russia-Ukraine war crises.
Data Sovereignty
The number of data-localization measures in force around the world more than doubled in the four years from 2017 to 2021, according to a study by The Information Technology & Innovation Foundation with dozens more under consideration.
Data sovereignty is becoming a big and related issue. Ideally, data was supposed to float freely around the digital economy, but governments have begun to understand the importance of data to national commerce, law enforcement and security.
In 2017, 35 countries had implemented 67 such barriers. By 2021, 62 countries had imposed 144 restrictions.


2017
2021
0
20
40
60
80
100
120
140
160
144
62
35
67


Countries

Data Localization Measures

How many times supply chain terms were mentioned in corporate presentations


2018
2019
2020
2021
2022
0
100
200
300
400
500
600
700
800
Number of mentions
Reshoring
Onshoring

Nearshoring


Source: IMF


In conclusion, if the drive for national economic competitiveness and security leads to deglobalization deepening into regionalization, there’s a risk it will have a profound impact on the global economy and investment portfolios. As for the severity of the impact, much will depend on whether policymakers succeed in finding a middle way between unfettered trade liberalization and protectionism. The only silver lining is the likely acceleration in decarbonization.
OUR INVESTMENTS SHAPE TOMORROW TODAY

Learn More
Conclusion
I believe firmly we are living in a period of intense competition among great powers…there is a branch of the probability tree in which this competition motivates a global race to the top, with more public investments in R&D and infrastructure, more indigenous innovation and productivity, more labor force development, and stronger efforts to produce and attract talent and ideas. That kind of global competition would produce positive global spillovers that diffuse across the world and underpin higher trend growth and low inflation much like we saw in the 1990s. It’s the basis for our roaring 2020s scenario to which we currently assign a 5% probability, and I sincerely hope that is too low, because this is a scenario that captures the world as it should be.”
Daleep Singh
Chief Global Economist at PGIM Fixed Income


The period of deglobalization that started to deepen in the Covid-19 pandemic is intensifying into what has been called “a period of intense competition between great powers.”

At the same time, higher costs of capital would tend to prompt lower returns on investments such as equities. Indeed, the OECD estimates that a shift to localized value chains could lead to a decrease in global real GDP of more than 5%.
If deglobalization were to lead to even moderately higher medium-term inflation than the approximately 2% level experienced by many economies for the 10 years until the Covid-19 pandemic, then it might lead to lower global economic growth.

Sources: OECD METRO database and simulations
It’s always said that impeding global trade has a cost in terms of economic growth, and this time appears little different, according to leading economists. Indeed, deglobalization’s byproduct will be “not just slower growth, but a significant fall in national incomes for all but perhaps the largest and most diversified economies.”
So writes Kenneth Rogoff, the Harvard University Professor of Economics and Public Policy. He has also argued that deglobalization could “exacerbate upward inflation pressures for an extended period.”
Deglobalization’s Winners and Losers
For instance, as Biden’s trio of acts pumps $2 trillion into the reindustrialization of America, so the fortunes of U.S. companies making the cables, bridges, electric vehicles, roads and semiconductors at the heart of his vision will prosper.
Companies from the U.S., Europe and China appear likely to source more goods from the region, according to the Boston Consulting Group analysis.
Geographically, Southeast Asia and India might benefit as supply chains are diversified.
Yet there would still be winners and losers – increasing the need for selective investing to minimize risk.
Likewise, companies that can best take advantage of adopting and integrating technology into their production so that they emerge as least-cost producers should fare well.


At the same time, though, there's a risk that U.S. companies with big supply chains stretching into China might suffer.
3
Implications for economies, investments and carbon emissions

2019
2020
2021
2022
2023
2024
2025
2019
2020
2021
2022
2023
2024
2025
2019
2020
2021
2022
2023
2024
2025
2019
2020
2021
2022
2023
2024
2025
-800
-400
-200
0
-600
200
600
800
1000
1200
400
Nuclear
Renewables
Previous forecast (July 2022)
Coal
Gas


TWh


Year-on-year global change in electricity generation by source, 2019-2025
Renewables growth dampens fossil fuel-fired generation from 2023 to 2025
Interventionism - Green Hope?
Even before the U.S. subsidies come into effect, renewable energy capacity increases in China and the EU mean that low-emission energy sources (including nuclear) are set to cover almost all of the growth in global electricity demand by 2025, according to the International Energy Agency. What’s more, global CO2 emissions are forecast to plateau until 2025 before starting to fall.
Source: Electricity Market Report 2023
Source: International Energy Agency
Source: PGIM
Finally, though, the wave of competitive subsidies and their sharp focus on tomorrow’s green economy will boost the renewable energy industry, which is already building out capacity due to the relatively low prices of solar and wind.



Economies could shrink with localization
Country/Region


Export demand % change


-8.3
-33
-12.5
-18.4
-30
-15.2
-19.6
-9.6
-9
-7.4
-18.6
-14.8
-21.8
-22.5
-26.8


Import demand % change
-13.5
-24.4
-9.9
-23.4
-25
-16
-21.7
-11.4
-9.6
-7.9
-21.3
-11.4
-20.4
-24.1
-23.1


-2.9
-12.2
-5.1
-2.6
-13.1
-2.5
-8.8
-5.1
-3.2
-4.2
-1.1
-3.2
-3.9
-7.4
-5.9
Real GDP % change
Domestic production % change


-3.2
-13.4
-5.6
-2.4
-15.1
-2.5
-8.6
-5.4
-3.5
-4.4
-3.8
-0.7
-4.8
-9.1
-8.2
Argentina
Australia/New Zealand
Brazil
Canada
China
Germany
European Union
Italy
Indonesia
India
Japan
Korea
Mexico
United Kingdom


France


With the outlook for equity and bond markets uncertain, investors might want to consider an agile global macro strategy – selecting both long and short positions in assets less correlated to the overall market while factoring in profound changes in market sentiment or expectations. Such a strategy will provide flexibility to react nimbly as conditions shift.
Source: The Information Technology & Innovation Foundation
Source: PGIM


Notably, as Western Europe weans itself off Russian oil and gas, EU-Russia trade is forecast to fall by $262 billion between 2023 and 2031, according to Boston Consulting Group.
Decline in EU-Russia Trade by 2031
-$262 bn

Further, the U.S. government’s efforts to promote local manufacturing and diversify supply chains will lead to trade with China falling by $63 billion through 2031, based on Boston Consulting Group forecasts.
Decline in U.S.-China Trade by 2031
-$63 bn

But Southeast Asia could benefit from a redrawing of the trade map, as it sees significantly greater trade with all parties – the U.S., China, Japan and the EU. The region’s trade with China alone could rise by $438 billion over the forecast period.
Increase in Southeast Asia-China trade by 2031
+$438 bn
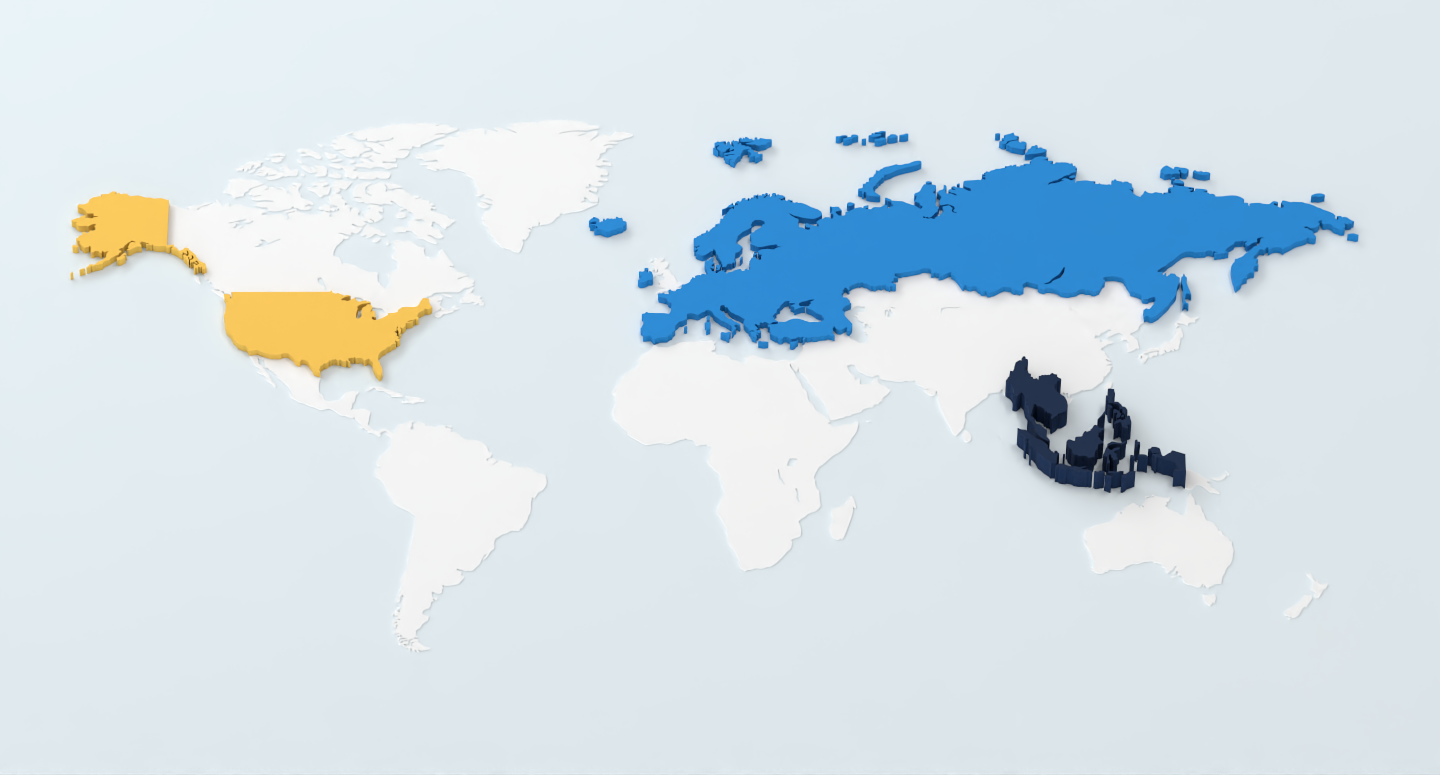
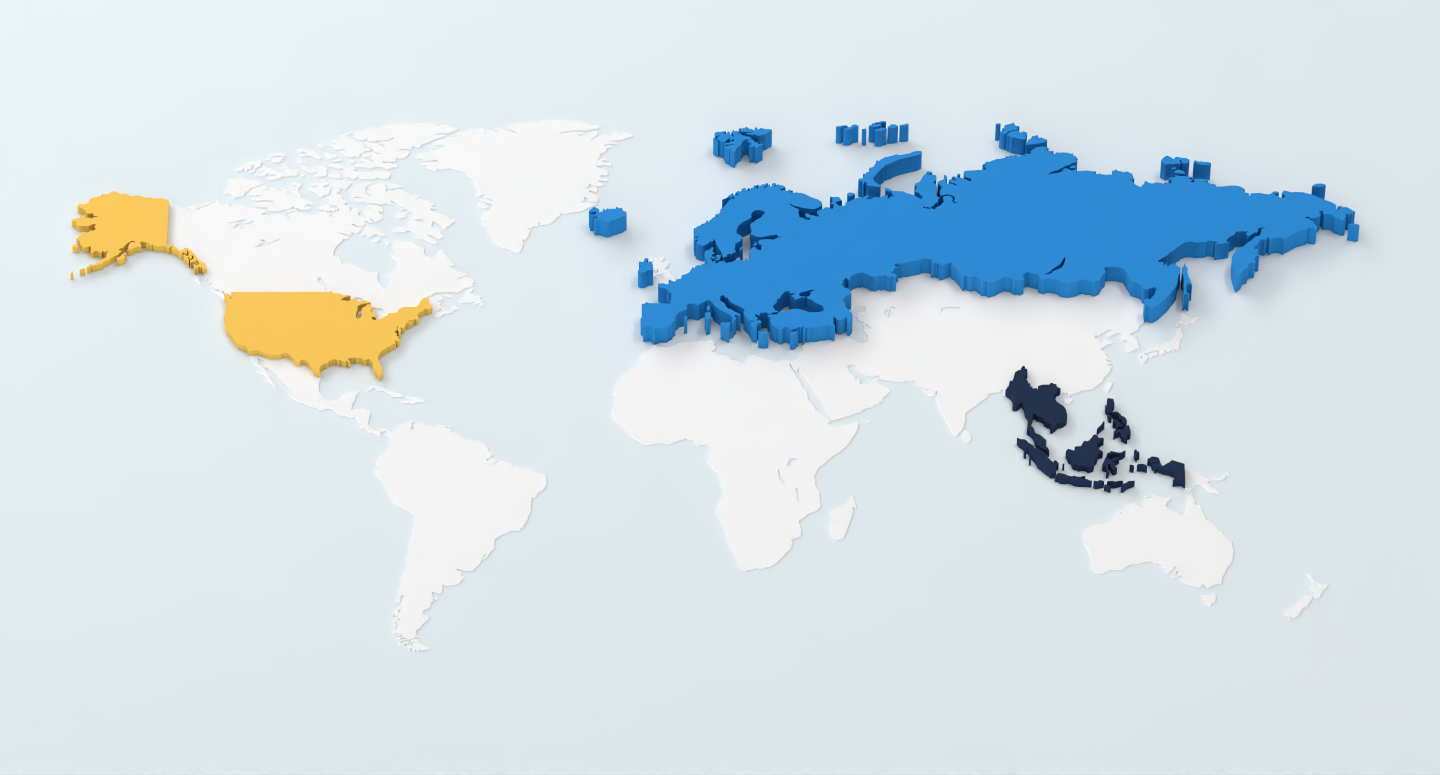
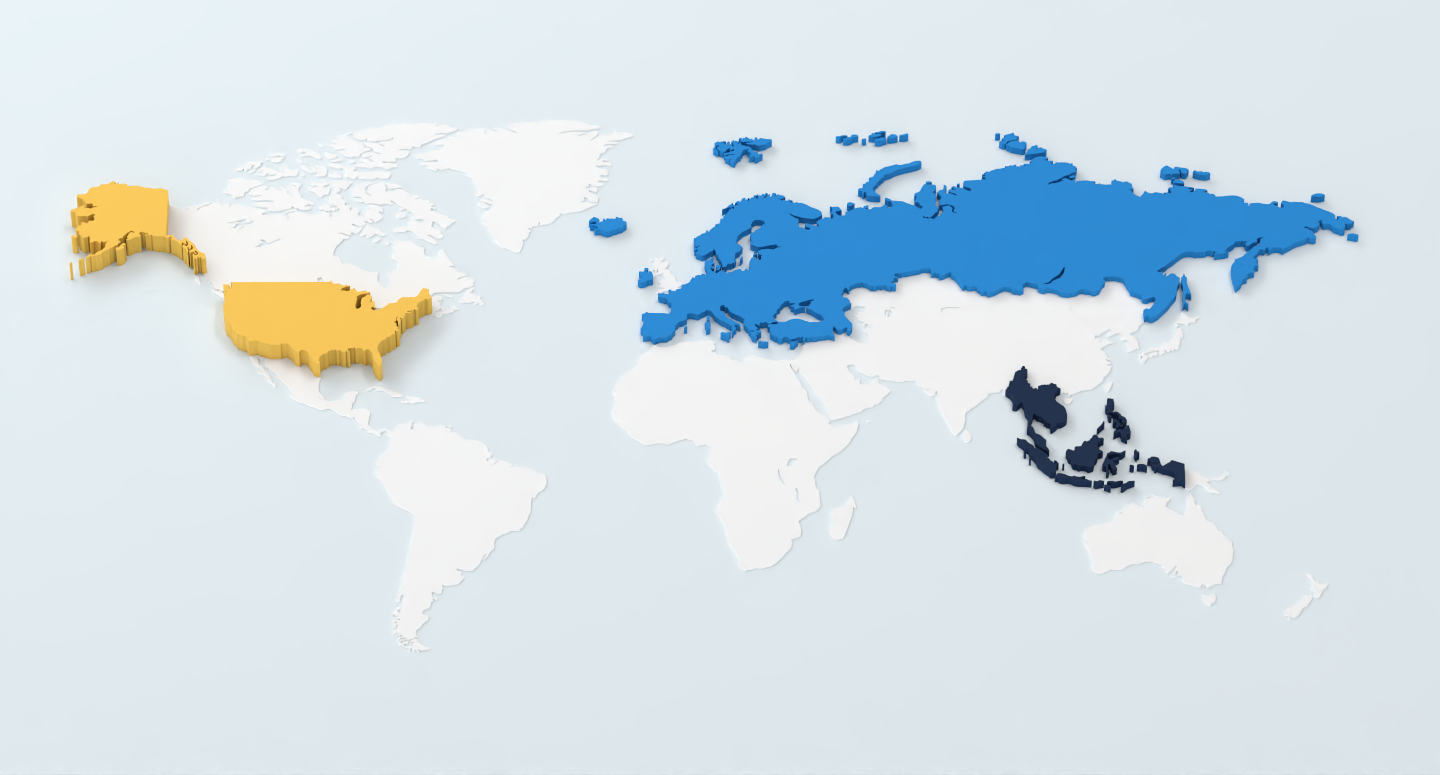
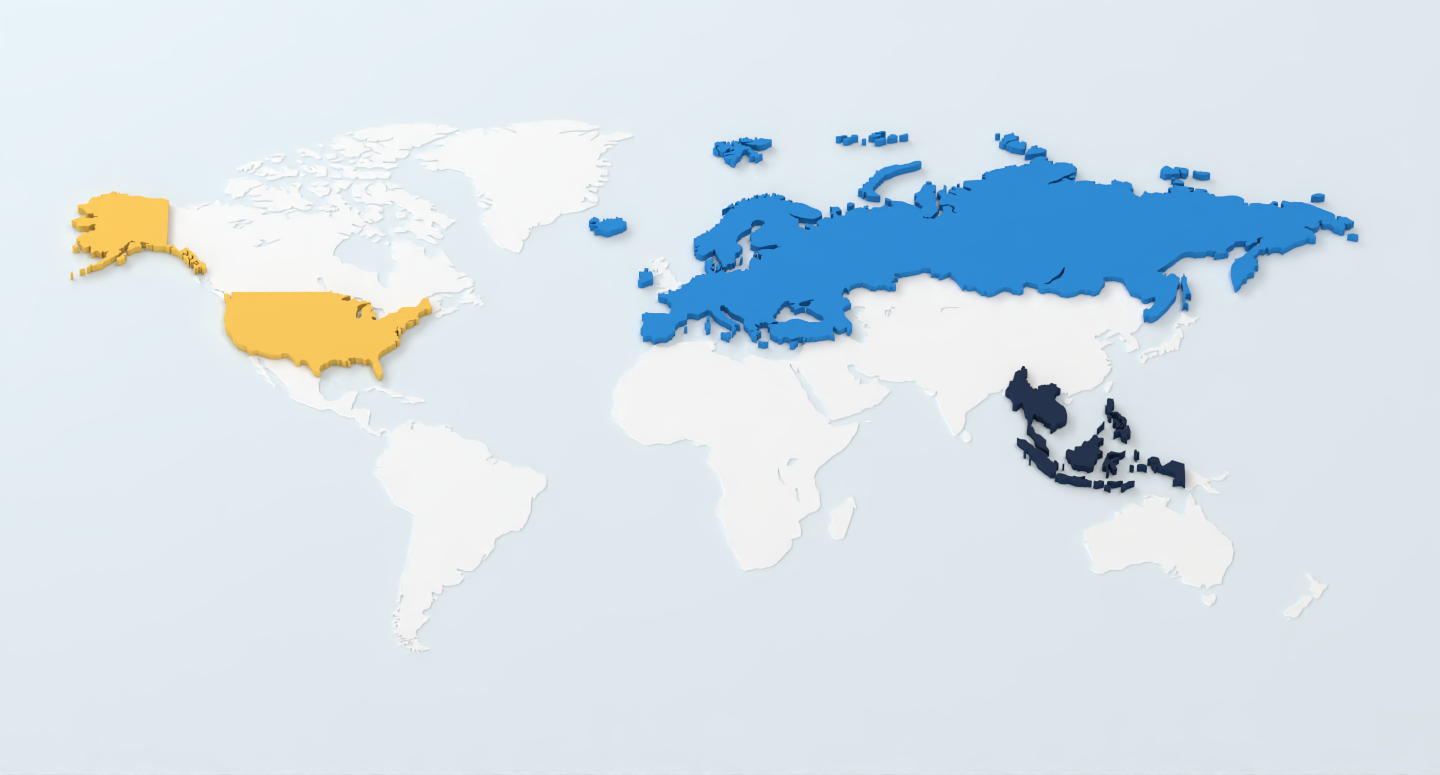
(Please Roll Over the Regions to Reveal)


Download the PDF
economies-investments
fragmentation
trading-blocs
INTRO

Download the PDF
economies-investments
fragmentation
trading-blocs
INTRO


Download the PDF
economies-investments
fragmentation
trading-blocs
INTRO

Download the PDF
economies-investments
fragmentation
trading-blocs
INTRO





PRESENT

+

OUTFRONT SERIES


1880
1900
1920
1940
1960
1980
2000
2020
0
10
20
30
40
50
60
Sum of exports and imports as a percent of GDP


Wars, protectionism
Fixed exchange rates
Liberalization
Industralization
Slowbalization


2009
2010
2011
2012
2013
2014
2015
2016
2017
2018
2019
2020
2021
2022
0
500
1000
1500
2000
2500
Number of restrictions
Goods
Investment

Services


2018
2019
2020
2021
2022
0
100
200
300
400
500
600
700
800
Number of mentions
Reshoring
Onshoring

Nearshoring


Source: IMF


April
2021
April
2022
Increasing invetory along the supply chain
Supply chain change implementation*, % of respondents (n = 113)
How global supply chain leaders are shifting focus


61
47
planned in May 2020
80
April
2021
April
2022
Dual sourcing of raw materials


55
53
planned in May 2020
81
*Question: Which of the following options (if any) have you already taken or initiated (since date) to increase your footprint resilience?

April
2021
April
2022
Regionalizing the supply chain


25
38
planned in May 2020
44


Argentina
Australia/New Zealand
Brazil
Canada
China
Germany
European Union
Italy
Indonesia
India
Japan
Korea
Mexico
United Kingdom
France


-2.9
-12.2
-5.1
-2.6
-13.1
-2.5
-8.8
-5.1
-3.2
-4.2
-1.1
-3.2
-3.9
-7.4
-5.9

-8.3
-33
-12.5
-18.4
-30
-15.2
-19.6
-9.6
-9
-7.4
-18.6
-14.8
-21.8
-22.5
-26.8

-3.2
-13.4
-5.6
-2.4
-15.1
-2.5
-8.6
-5.4
-3.5
-4.4
-3.8
-0.7
-4.8
-9.1
-8.2

-13.5
-24.4
-9.9
-23.4
-25
-16
-21.7
-11.4
-9.6
-7.9
-21.3
-11.4
-20.4
-24.1
-23.1
Policy Rates
House Price to Income Ratio
House Prices
Import demand % change

Policy Rates
House Price to Income Ratio
House Prices
House Prices

2019
2020
2021
2022
2023
2024
2025
2019
2020
2021
2022
2023
2024
2025
2019
2020
2021
2022
2023
2024
2025
2019
2020
2021
2022
2023
2024
2025
-800
-400
-200
0
-600
200
600
800
1000
1200
400
Nuclear
Renewables
Previous forecast (July 2022)
Coal
Gas


Twh


