
Source: National Bureau of Economic Research, August 2023
1,568
Industrial policy interventions globally per year, up from just 34 in a little more than 10 years.
OUTFRONT SERIES
INDUSTRIAL POLICY’S IMPACT:
DEBT OR DIVIDEND?


Medical Devices
Numerical Control Tools and Robotics
Ocean Engineering Equipment and High-End Vessels
Energy Saving and
New Energy Vehicles
Railway Equipment
New Materials
Aerospace Equipment
Farming Machines
Information Technology
Electrical Equipment
Made in China 2025: Target sectors


The Rising Tide of Global Industrial Policy
Together, the 2021 Infrastructure Investment and Jobs Act, the 2022 Inflation Reduction Act (IRA) and the 2022 CHIPS and Science Act amount to more than $2.4 trillion in funding over 10 years, although some estimates put the eventual costs much higher.
The U.S. joins the race
Signaling that national competition is replacing global cooperation, or globalization, the U.S. has made its largest commitment to industrial strategy since the Cold War.

Should that happen, it’s likely to help the public market equities of companies in the real economy most of all, including the types of industrial and infrastructure companies poised to gain from governments’ industrial strategies.
China's Total Debt to GDP Has Overtaken the U.S.
South Korea: Selected Economic Indicators, 1971-1986 in Percentage Change
It depended on government subsidies, commitments to absorb losses and financing for fixed development costs.
Source: EU Commission, December 2022
Source: EU Commission, September 2023
In reality, though, the bloc is struggling to counter the threat of U.S. subsidies which they fear could lead to an exodus of EU companies across the Atlantic if it cannot match the handouts on offer from Washington.
Flight paths: from Airbus to Comac
The EU and others struggle to compete
The creation of the Airbus consortium in the late 1960s is often hailed as a model of successful government intervention.
“Europe will do whatever it takes to keep its competitive edge,” asserted Ursula von der Leyen, the commission president, in her annual 2023 State of the Union speech.
Over the 60 years since then, Airbus has grown to outsell Boeing. Airbus’s A320 family of passenger jets now has a market share of 59% in the key single-aisle market compared with Boeing’s 737 family, according to aviation consultancy Cirium.
The EU’s industrial policy focuses on what it calls its industrial ecosystems, across which it aims to foster twin green and digital transitions.
Source: Reuters, January 2020
Yet the Commercial Aircraft Corporation of China (COMAC) has failed to emulate Airbus’s success. Despite the state investing up to $70 billion, its C919 has yet to be certified by any major aviation authority outside China.
There are several parts to the European Union’s plan – including the Net-Zero Industry Act, the Critical Raw Materials Act and a reform of the electricity market’s design. Yet critics say that the EU goal to “speed up investment and financing for clean tech production in Europe” lacks funding. The proposed European sovereignty fund that was meant to pay for it has been shelved and critics say that any money promised is essentially reshuffling of existing commitments.

Taxpayer funds have been used to secure the future of a steel works and electric vehicle manufacturing, as well as to attract a battery factory. But the long-term strategy is unclear. Like other smaller economies that are constrained by the relatively small size of their public finances, it cannot match the spending power of the U.S. or China.
UK – the spending power gap?
Turning to the UK, the current government’s approach to industrial strategy appears reactive.

Airbus Overtakes Boeing in Delivery of Single-Aisle Passenger Jets


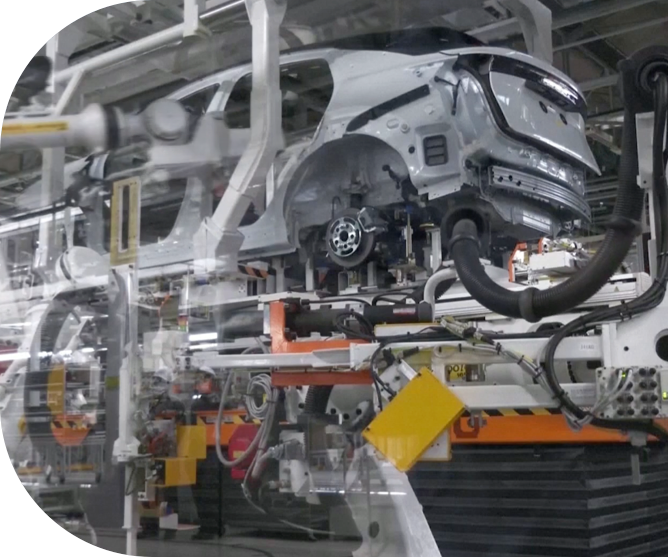

Already this can be seen in investments in U.S. semiconductors and clean-tech manufacturing, as well as Chinese EVs. The risk, though, is the effects of potentially higher interest rates for years to come.
CONCLUSION
WILL HIGHER DEBT FOSTER HIGHER GROWTH?
At a pivotal time for national economies, it seems likely that today’s emerging industrial strategies will succeed in boosting key strategic sectors.


Source: DARPA, 2023
Governments in Britain, Germany and Japan have looked to build their own versions of DARPA, which eschews bureaucracy and big budgets – the U.S. president’s request to Congress for DARPA’s budget is $4.119 billion in 2023. That may well create still more foundational technologies for firms to build on.
There may also be long-term benefits for innovative young companies in private markets.
In particular, China and the United States have borrowings at, or close to, record levels. While this makes the U.S. vulnerable to further bond market jitters, in China it plays out through downward pressure on the yuan.
The race to harness industrial strategy to accelerate development of new technologies and the energy transition is happening at a time when the public finances are stretched.
From the 1950s, the Ministry of International Trade and Industry (since renamed Ministry of Economy, Trade and Industry) promoted its favored sectors such as steel, shipbuilding, chemicals and machinery through a range of measures, including state loans and subsidies.
By the late 1960s, Japan had the second largest economy in the world. But growth stagnated in the 1990s, ending the country’s economic miracle.
Source: Economic Planning Board, Major Statistics of the Korean Economy 1987 (Seoul Economic Planning Board 1987)
Source: Ministry of Foreign Affairs of Japan
Source: "Industrialization and the State : The Korean Heavy and Chemical Industry Drive," Korean Development Institute, July 1995
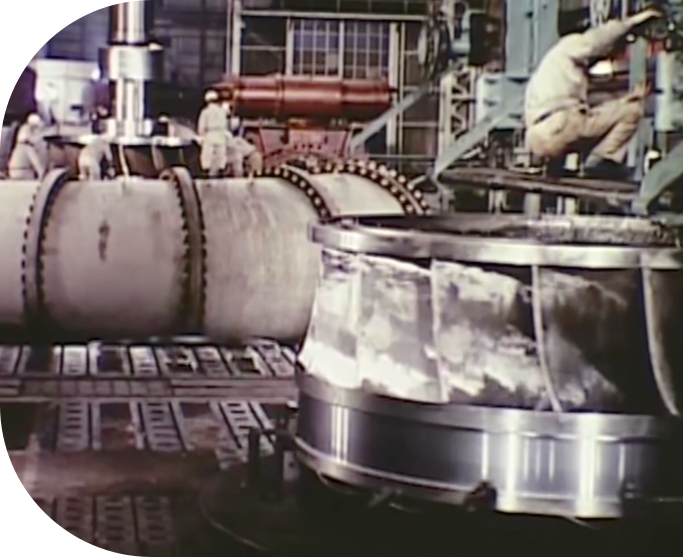
South Korea, too, used industrial policy with initial success. In the early 1970s, the government initiated a strategy to develop its largely agrarian economy through the heavy and chemical industries.
The years that followed saw considerable success, but some studies have concluded the policy led to a waste of resources, increase in foreign debt and monopolies that ultimately laid the ground for labor conflicts.


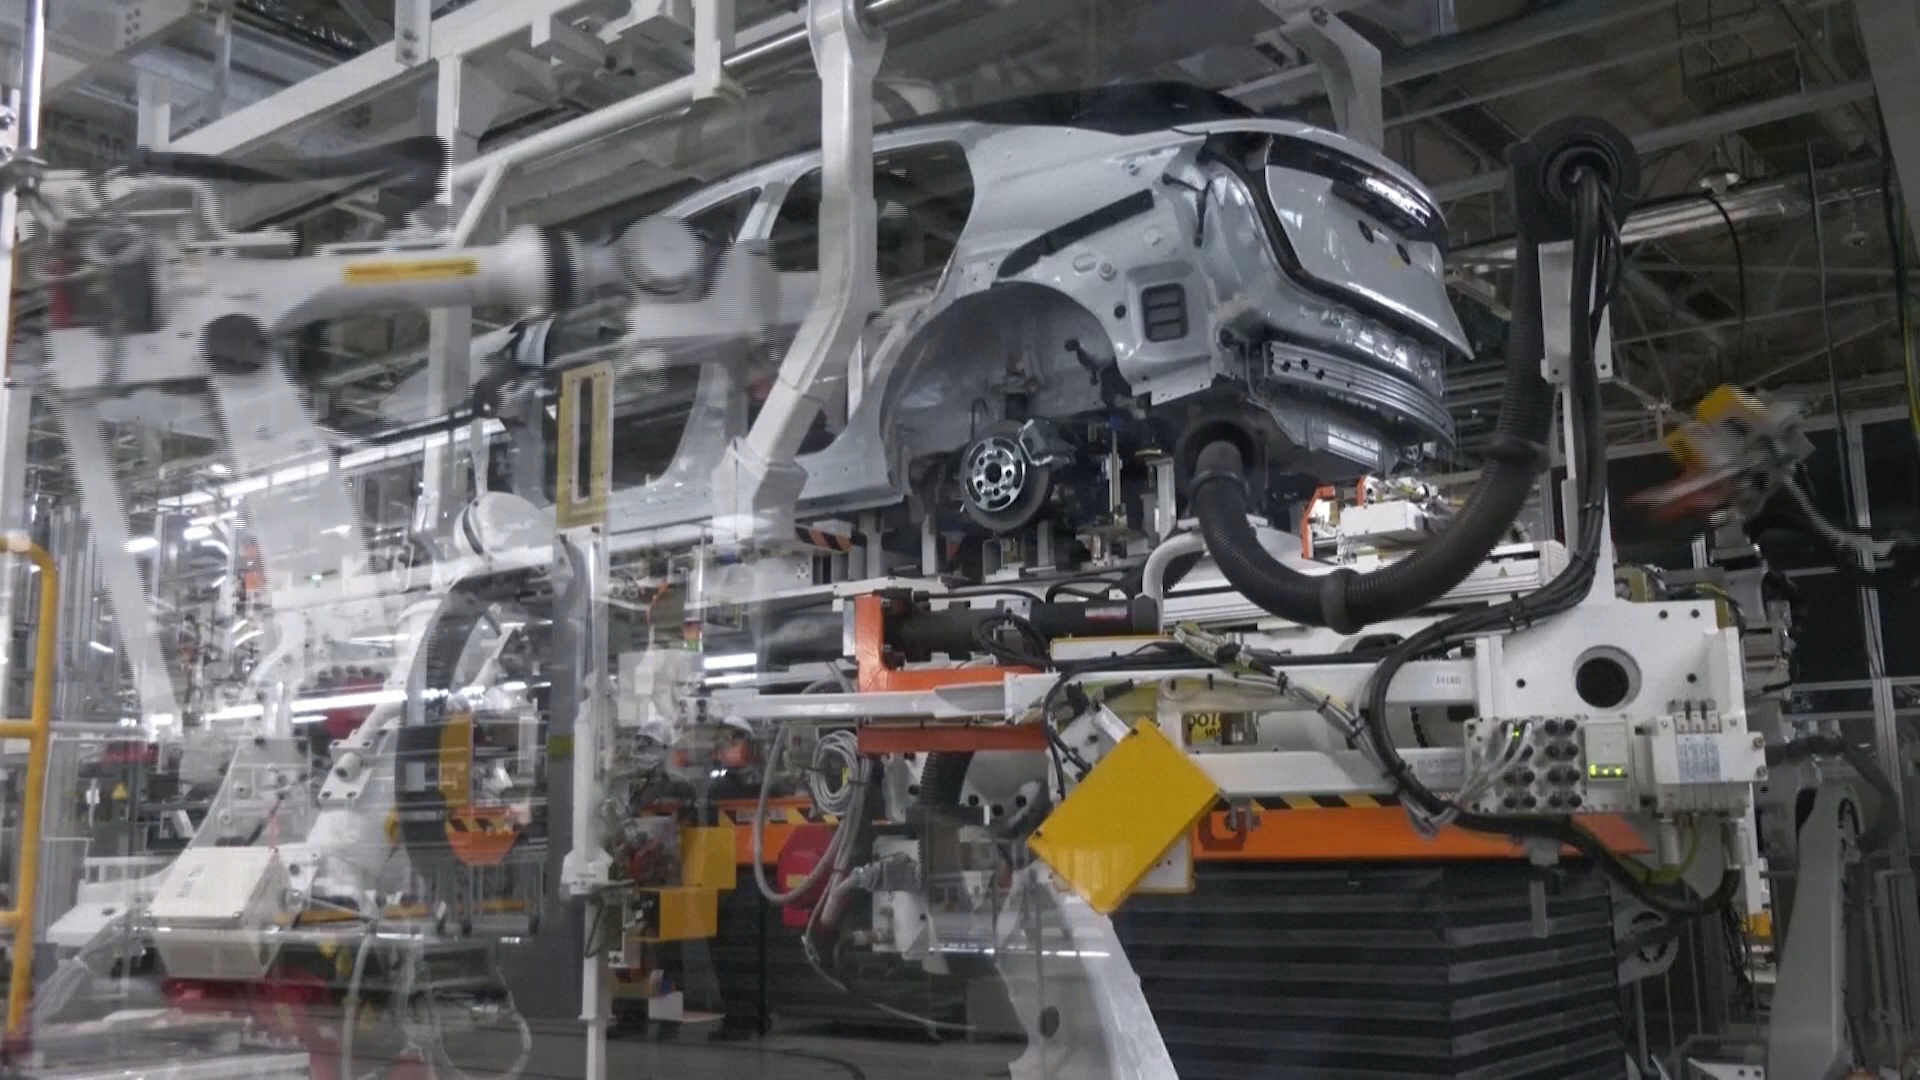
It’s true that China’s industrial strategy is buying it dominance of some strategic sectors but it’s also creating massive over capacity.
Launched in 2015, the Made in China 2025 policy focused on leadership in strategic sectors such as robotics, information technology and clean energy.
Notably, China’s EV Gigafactory pipeline has swollen to an ambitious 4,200 GWh by 2030. This is twice what’s needed to convert the country’s entire vehicle fleet to battery electric vehicles, according to CRU, the business intelligence firm.
More recently, this has evolved into the “dual circulation” strategy – the notion of reducing dependence on foreign powers while strengthening domestic sourcing.
Source: China Briefing, December 2018
Source: Over capacity in China’s battery cell industry will lead to consolidation. CRU, 25 August 2023
*Source: Center for Strategic and International Studies May 2022
Source: Red Ink: Estimating Chinese Industrial Policy Spending in Comparative Perspective, May 2022
Even using conservative estimates, the country’s spending is enormous at $407 billion a year (at purchasing power parity exchange rates). This comes in many forms but chiefly subsidies and below-market credit to state-owned enterprises. That equates to at least 1.7%* of GDP. For comparison, the IRA that is the biggest part of Biden’s package never amounts to more than a fraction of 1%**, according to Moody’s Analytics.
DARPA’s VC model
East Asia’s economic miracle
The Defense Advanced Research Projects Agency (DARPA) has since been at least partially credited with funding the foundational technologies behind critical innovations like weather satellites, GPS, drones, stealth technology, voice interfaces, the personal computer and the internet.
Source: UnHerd, June 2018
Most recently, it awarded a small firm called Moderna with $25m in 2013 to use messenger RNA to develop vaccines, preparing the way for its Covid-19 vaccine.
A different model was introduced in 1958 to make sure the U.S. would never again be surprised by developments in new technology after the Soviet Union launched the world’s first satellite, Sputnik.
The second half of the 20th Century was the heyday of industrial policy, with Japan the poster child.

China: the big spender
While industrial strategy fell out of fashion in many countries, it’s always been at the heart of China’s economic model.

1.5 million
Source: Labor Energy Partnership, August 2022
Estimated number of new jobs that could be created in U.S. semiconductor and clean tech production
+
1,568
1,594
852
632
705
228
260
242
136
144
56
20
34
Source: National Bureau of Economic Research, published August 2023 (data as of August 2022)

2022
1,200
400
1,600
800
0
1,800
1,000
200
1,400
600
Total number of industrial policy interventions
2012
2010
2018
2016
2014


There were 1,568 industrial policy interventions in the world in 2023 – up from just 34 in 2010, according to The New Economics of Industrial Policy, a paper from the National Bureau of Economic Research.
It’s a defining moment for economies. Nations are in a race to be at the forefront of both the coming technology revolution and the green energy transition. Nothing short of economic leadership – as well as growth, energy security and well-paid jobs – is at stake.
Yet coming at a time of high debts across many economies, the shift from free-market economics to industrial strategy brings risks. Will the huge costs of industrial strategy be rewarded in terms of higher GDP growth? Or will subsidies stifle competition and productivity while pushing up interest rates? There are implications for national finances and financial markets.
In a race to sharpen their competitive edge, nations are re-deploying industrial policy.
200%
300%
100%
350%
150%
250%
Source: Reuters, November 2023
United States

China


Source: Cirium fleets data, 2023
A320 family

737 family


2022
2023
2026
2024
2025
2027
2028
2029
2030
2031
2032
2033
2034
2035
There is this shift between the monetary and the fiscal authority, from what we've seen before to what we're seeing now, which is going to have big implications for interest rates. Now, the potential benefit of this new mix of fiscal and monetary is that it should drive higher investment and hopefully eventually higher potential growth so that GDP growth becomes more sustainable.”

Deputy Head of Global Economics at PGIM Fixed Income
Katharine Neiss

52
115

781
879


$550 billion
$167 billion
Inflation Reduction Act
$1,660 billion
CHIPS and Science Act of 2022
Bipartisan Infrastructure Bill
0
$2,000
$1,600
$1,200
$800
$400


Public Spending/Tax Incentives

Private Spending
Source: JP Morgan Private Bank, June 2023
Public and Private Spending (USD Billion) Over the Next 10 Years
Three recent U.S. policy bills include almost $2.4 trillion in funding.
A combination of tax credits, grants and loans may already be sparking a manufacturing boom. Companies have committed more than $200 billion in large-scale projects to boost US semiconductor and clean-tech production, that could create up to 1.5 million jobs.
Yet economists are divided on whether this will raise GDP growth over the next decade, meaning there will not necessarily be a pay back on the debt incurred.
The Biden administration is explicitly targeting technological leadership, security of supply chains, the energy transition and recapturing manufacturing jobs from abroad.
We're already seeing much higher debt levels, and that is pushing up on long-term interest rates. Now the downside to that is higher interest rates through higher public spending risks crowding out private investment. And if this increased public investment doesn't translate eventually into higher growth, that could lead to some very painful adjustments. But on the plus side, with governments clearly the direction of travel that they see through these industrial strategies, it does sort of give the private sector a north star of where we're going over the medium term that helps to coordinate in a way that can have positive spillovers.”

Deputy Head of Global Economics at PGIM Fixed Income
Katharine Neiss
America is adapting to intensified geopolitical competition for pre-eminence in the foundational technologies of our time.”

Chief Global Economist at PGIM Fixed Income and a former Deputy National Security Advisor for International Economics in the Biden administration
Daleep Singh


Number of orders


What is Industrial Policy?


4,208.9
1986
-19.4
1985
-1,035.9
1984
-1,763.5
1983
-2,594.4
1982
-3,628.3
1981
-4,384.10
1980
-4,384.10
1979
-1,780.8
1978
476.6
1977
-590.5
1976
-1,671.4
1975
-1,936.8
1974
-566
1973
-573.9
1972
$-1,045.9
1971
-10%
40%
50%
60%
30%
20%
10%
0


600

0

200

400

800


Trade Balance (USD Millions)
Real Exports
Wages
Consumer Price Index
Wholesale Price Index

Gross National Product
While industrial policy may well achieve its strategic economic goals, its dividends in terms of pure GDP growth are far harder to predict. If the past is a guide to the future, there could be costs in terms of higher debts, limited competition and suppressed productivity growth.


INTRO
growth
lessons
rates
conclusion
Download the PDF


Download the PDF
conclusion
rates
lessons
growth
INTRO


Download the PDF
conclusion
rates
lessons
growth
INTRO


Download the PDF
conclusion
rates
lessons
growth
INTRO
1
BORROWING TO FUEL GROWTH
2
LESSONS FROM THE 20TH CENTURY
3
Implications for interest rates and financial markets
**Source: Moody's August 2022


There are many definitions of industrial policy, often with subtle differences. However, the following OECD definition sums up what’s happening today:
“Industrial policy is any type of intervention or government policy that attempts to improve the business environment or to alter the structure of economic activity toward sectors, technologies or tasks that are expected to offer better prospects for economic growth or societal welfare than would occur in the absence of such intervention. ”
Source: OECD, Ken Warwick
INDUSTRIAL POLICY DEFINED



Download the PDF
Source: Cirium fleets data, 2023


2014
2016
2018
2010
2012
Total number of industrial policy interventions
600
1,400
200
1,000
1,800
0
800
1,600
400
1,200
2022


34
20
56
144
136
242
260
228
705
632
852
1,594
1,568
Private Spending

Public Spending/Tax Incentives


$400
$800
$1,200
$1,600
$2,000
0
Bipartisan Infrastructure Bill
CHIPS and Science
Act of 2022
$1,660 billion
Inflation Reduction Act
$167 billion
$550 billion

879
781
115
52





China

United States
250%
150%
350%
100%
300%
200%


800

400

200

0

600

2035
2034
2033
2032
2031
2030
2029
2028
2027
2025
2024
2026
2023
2022


737 family

A320 family


Number of orders


Gross National Product

Wholesale Price Index
Consumer Price Index
Wages
Real Exports


0
10%
20%
30%
60%
50%
40%
-10%


1972


Trade Balance (USD Millions)

The U.S. joins the race
There are many definitions of industrial policy, often with subtle differences. However, the following OECD definition sums up what’s happening today:
“Industrial policy is any type of intervention or government policy that attempts to improve the business environment or to alter the structure of economic activity toward sectors, technologies or tasks that are expected to offer better prospects for economic growth or societal welfare than would occur in the absence of such intervention. ”
Source: OECD, Ken Warwick


Download the PDF
conclusion
rates
lessons
growth
INTRO


2020
2012
2014
2016
2018
2008
2010
2022
Mar 2023


2020
2012
2014
2016
2018
2008
Mar
2023
2010
2022


