World Population Review
UK Office of National Statistics (October 2022)
Bank of International Settlements (Q2 2022)
Sources:
Today, a range of developed and developing countries have elevated debt levels. This may well indicate where some of the greater risks of financial crises lie.
Even now, pressures on debt are rising due to the expense of energy bills in Europe’s winter.
In Germany, the cost of the energy support package intended to protect residents from soaring gas and electricity prices has been reported at €200 billion, while the UK support package is expected to cost tens of billions of pounds.
Bull Markets Turn to Bear
Energy Costs Fuel Debt
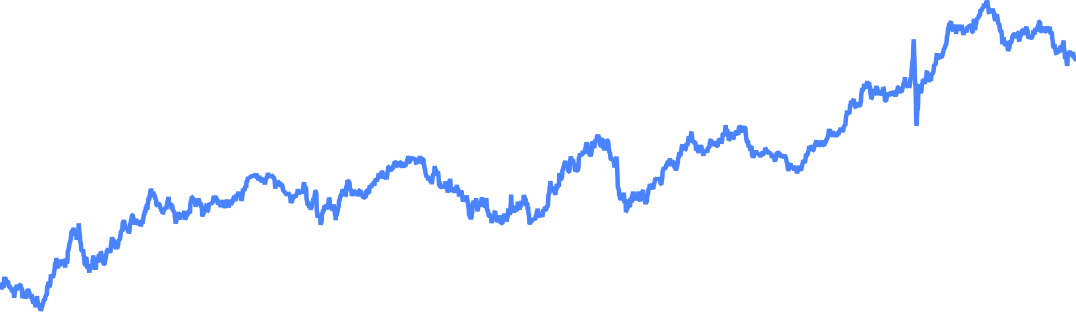
In the 2010-2020 decade of cheap money, most asset prices surged. There was a bull market in bonds, equities and real estate.
To escape depression, central banks introduced ultra-low and negative interest rate policies along with QE. The result: a world of debt-dependent growth.
Since the Federal Reserve made clear that it was determined to conquer inflation by raising rates at the end of 2021, though, the bull market has turned to bear. Unusually, virtually all asset prices are falling together.
The chart below shows how global debt spiked as a percentage of GDP in the pandemic.
Their rise accelerated afterwards, as both public and private sector debt rose during the “lower-for-longer” decade from 2010 to 2020, ahead of a final blowout during the pandemic.
2022’s record debt is a danger that was decades in the making. Debt levels started to rise before the GFC of 2007-2008, as new labor from developing economies such as China and eastern Europe suppressed inflation and interest rates.


Source: Refinitiv


Notable Indebted Countries, Debt-to-GDP ratios (%)
Total Global Debt Surpassed $300 Trillion in 2021

Source: Institute of International Finance + Reuters

% of GDP
Global debt (in USD)
% of GDP, weighted avg.
USD trillions
370
360
350
340
330
320
310
320
300
280
260
240
220
200
2022
2021
2020
2019
2018
2017
2016
2015


Bonds


Real estate

Equities


292%
China


206%
Greece


128%
Bahrain


266%
Japan


156%
Italy


134%
Portugal


350%
Venezuela


110%
United Kingdom


128%
United States


131%
Singapore


Chapters Menu


Explore


Explore
Explore
Explore
Explore


Select a Chapter to Continue:

CLOSE


Equities

Real estate
Bonds


Equities

Real estate
Bonds

150
Jan 2022
Nov 2022


200
250
300


150
2021
2020
2019
2018
2017
2016
2015
2014
2013
2011
2012
2010
200
250
300
USD

FTSE World Broad Investment-Grade Bond Index
Jan 1 2010 – Dec 31 2021
FTSE World Broad Investment-Grade Bond Index
2022 YTD


300
USD
FTSE Global All Cap Index rise
Jan 1 2010 – Dec 31 2021


FTSE Global All Cap Index
2022 YTD
300
Jan 2022
Nov 2022
700
800
900
400
500
600
700
800
900
400
500
600


2021
2020
2019
2018
2017
2016
2015
2014
2013
2011
2012
2010


50
100
150
300
250
200
100
150
300
250
200
MSCI World Real Estate
Jan 1 2010 – Dec 31 2021

MSCI World Real Estate
2022 YTD
50


USD


Jan 2022
Nov 2022
2021
2020
2019
2018
2017
2016
2015
2014
2013
2011
2012
2010


Explore
Explore
Explore
Explore
Explore
Select a Chapter to Continue:
Explore
Explore
Explore
Explore
Explore
Select a Chapter to Continue: