
Theme 1
The U.S. economy stands out from the crowd.
Theme 2
Global disinflation is showing signs of stalling.

Theme 3
Central banks believe they can cut rates without sacrificing inflation.
Key themes
Hover over each tile to read more about this quarter's key themes.
U.S. growth is downshifting somewhat as lower income households pull back, and corporates face higher refinancing costs. However, with most other global economies still struggling, the U.S. will remain the strongest global performer.
Read more about this theme

After having made significant progress last year, inflation deceleration has flattened out. The last mile of disinflation toward central bank targets will require some economic slowdown and job market rebalancing.
The Fed wants to cut policy rates, but it may be fazed by recent inflation surprises. It will likely cut policy rates two times this year, starting in September. Other central banks will also begin easing soon but will cut with greater urgency.
Theme 4
Equities should continue embracing the soft landing narrative.
Theme 5
Fixed income yields are attractive compared to equity yields.
Theme 6
With potential gains across asset classes, staying in cash is the main risk.
The constructive backdrop of solid growth, positive earnings and prospective rate cuts has been fueling market optimism. This mix should also support a broadening of the market rally as rate cuts come closer into sight.
U.S. Treasury yields should skew lower as the Fed cuts but will be limited by the shallow easing cycle. Credit spreads are
tight but, providing recession is avoided, should not widen significantly and provide important carry opportunities.
Assets in money market funds have ballooned to a record $6 trillion, with investors attracted by elevated yields. Now, this cash represents a potential tailwind to risk assets.
The U.S. economy stands out from the crowd.
Key takeaway
The U.S. is set to outperform its global peers once again. While Europe struggles to make signficant headway, the U.S. economy is heading for a soft landing.
The U.S. economy has withstood the most aggressive central bank rate hiking cycle in four decades and continues to grow strongly, overshadowing other major global economies. In the second half of 2023, the U.S. economy posted an average quarterly GDP growth rate of 4.1%. By contrast, the UK entered technical recession, while the Euro area remained entrenched in a state of stagnation.
Looking forward, Europe is seeing signs of a cyclical upturn in the manufacturing cycle and should avoid recession, while Japan’s reflation story has legs. U.S. growth is set to cool over the coming quarters as consumers pull back slightly, the labor market rebalances, and corporates finally confront higher refinancing costs. But overall, growth will likely only slow to trend, with 2024 marking another year of U.S. economic outperformance.
Global growth
Quarterly, 4Q 2022 - 4Q 2023
Source: Federal Reserve Bank of New York, Bloomberg, Principal Asset Management. Data as of March 31, 2024.
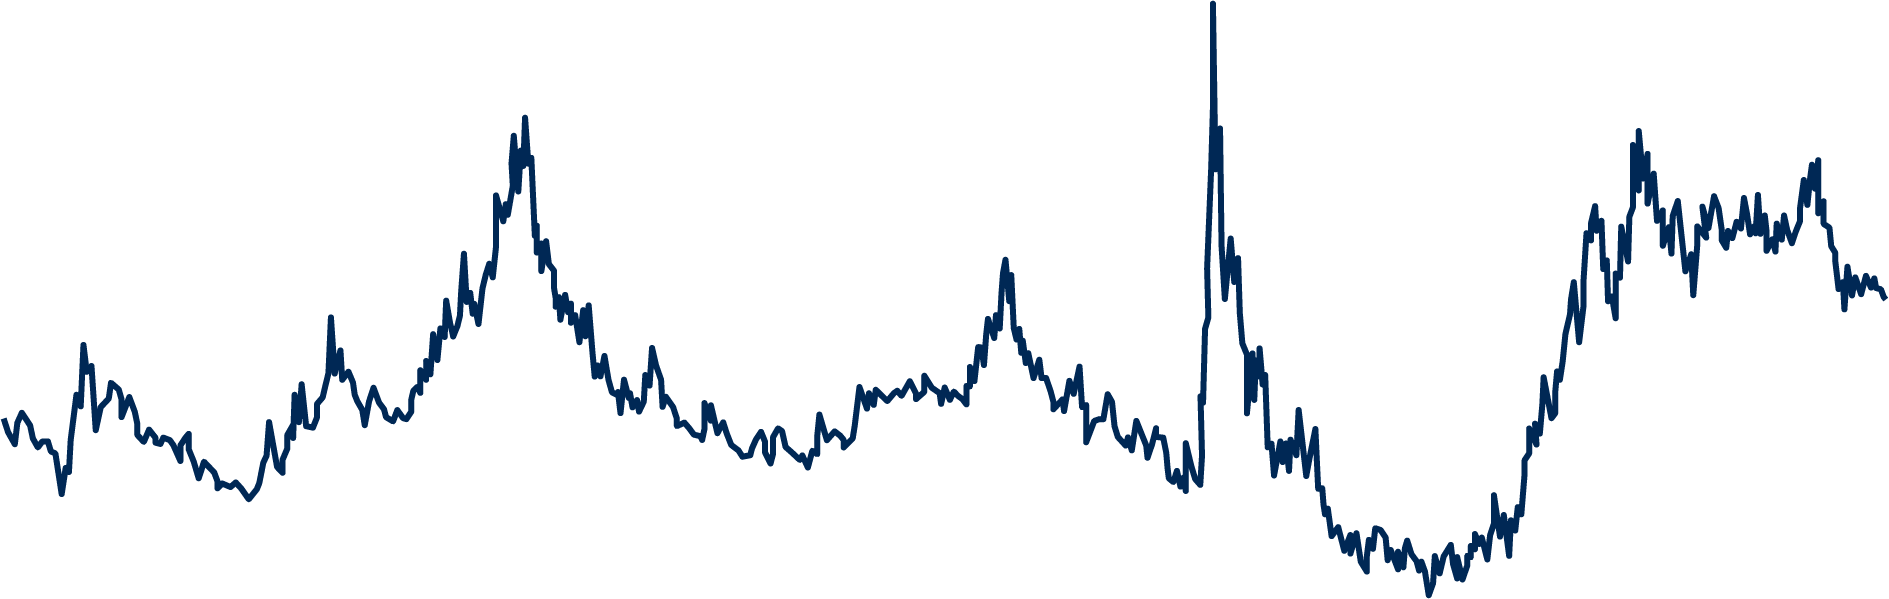
Global inflation: A frustratingly slow last mile
Key takeaway
The last mile to central banks’ inflation targets is proving tough and may require some (small) cracks in the labor markets to materialize.
Global disinflation has made significant headway, and generally without job losses. However, there are now signs that inflation is no longer decelerating. Recent U.S. inflation prints represent a setback in the Fed’s effort to build additional confidence in the sustainability of disinflation. While core goods inflation has dropped sharply, driven by normalizing supply chains, core services inflation ex-housing—the segment of the consumer basket most closely related to the labor market—remains strong, raising concerns that the U.S. labor market is simply too hot to permit inflation to reach the 2% target.
In the UK and the Euro area, central banks are closely focused on wage growth. Lackluster economic activity suggests wage growth is likely to weaken, but clear evidence is necessary before both central banks can begin executing rate cuts. By contrast, for the Bank of Japan (BOJ), the “shunto” wage negotiations, which showed stronger-than-expected wage growth, were the final piece of the inflation puzzle to convince the BOJ to shift away from negative rates.
GDP-weighted inflation
January 2007 - present
Source: Bloomberg, Principal Asset Allocation. Data as of February 29, 2024.
Download Full PDF

Global central banks: More reason to cut than the Fed
Key takeaway
Global central banks would prefer to start cutting rates at the same time as the Fed. Yet their weaker economies mean they will move with greater urgency. Their relatively dovish policy path will keep upward pressure on the U.S. dollar.
Typically, as the largest economy in the world, the U.S. sets the stage, and global central banks wait for a signal from the Fed before they begin their easing cycles. Yet the European Central Bank (ECB) and the Bank of England (BoE) are struggling with weak economies and have a clearer need to loosen monetary policy than the Fed. They too are waiting to gather sufficient evidence of sustained disinflation before they enact a rate cut.
We expect the ECB rate cutting cycle to be delayed until June and, for the BoE, potentially late summer. However, both central banks will be uncomfortable starting their cutting cycles several months ahead of the Fed.
Once they do start cutting rates, the BoE and ECB are likely to move with more urgency than the Fed as they are facing a greater risk of protracted economic downturns. As a result, the U.S. dollar will likely see an extended period of strength, only slightly muted by the Bank of Japan’s policy moves towards a more restrictive setting.
Global central bank rates
January 2021 - present, forecasted through 2025
Source: Federal Reserve, European Central Bank, Bank of England, Principal Asset Management. Data as of April 10, 2024.
Download Full PDF
Equities should continue embracing the soft landing narrative.
Key takeaway
Equity markets are facing a goldilocks combination of a soft landing and rate cuts. This should support a broadening of the market rally to other more cyclical sectors.
Central banks have fueled a market rally as they embrace optimism about inflation without sacrificing growth. Historically, when central bank easing takes place against a backdrop of a soft landing (like in 1995) the economy enters a mid-cycle position—whereby growth is stimulated by rate cuts, extending the economic expansion, the earnings upswing and, therefore, the market rally.
The Magnificent 7 should extend their positive performance. After all, the strong balance sheet characteristics and secure competitive market positions of the Magnificent 7 imply that a significant correction is unlikely, despite their valuations drawing comparisons to the 2000s tech bubble. Yet, this year, the combination of a soft economic landing and rate cuts should see strong performance broadening to other more cyclical sectors and markets whose valuations are not quite so stretched
The stock market and earnings
S&P 500 Index price and trailing earnings-per-share, 1990-present
Source: Clearnomics, Standard & Poor’s, Bloomberg, Principal Asset Management. Data as of March 31, 2024.
Learn more about the factors impacting markets and portfolios in the quarter ahead by downloading the full PDF.
Download Full PDF
Download Full PDF
Fixed income: We’re here for the carry
Key takeaway
Although credit spreads remain tight, the fixed income asset class is offering important carry opportunities. Concerns around the high yield maturity wall are likely overblown.
The combination of solid economic growth and a Fed that is clearly keen to cut policy rates has solidified a constructive backdrop for credit.
Spreads are historically tight for both investment grade and high yield credit. Yet, while spreads may not tighten significantly from here, provided the economy does not deteriorate significantly, they should not widen much either. More pertinently, credit is offering important additional carry to U.S. Treasurys, while the total yield available in fixed income is also attractive compared to equities.
A much-flagged risk for high yield this year is that the wall of maturing debt will face significantly higher refinancing costs, potentially triggering a spike in defaults. However, the resilient macro backdrop and strong balance sheets suggest that companies should scale the wall relatively unscathed.
Yield comparison: High yield bonds, investment grade bonds, U.S. Treasurys, and S&P 500
High yield bond yield-to-worst, investment grade bond yield-to-worst, U.S. Treasury yield-to-worst, S&P 500 12m forward earnings yield
Source: S&P Dow Jones, Federal Reserve, Bloomberg, Principal Asset Management. Data as of March 31, 2024.
The wall of cash is looking for a new home
Key takeaway
Money market funds have surged in recent years but, in 2024, with rate cuts likely and the economy still on a positive path, risk assets should perform strongly, and cash is set to lose its attractiveness.
Assets in money market funds have ballooned to a record $6 trillion, with investors attracted by elevated yields and partially hiding from an uncertain U.S. economic outlook. Many of the concerns and questions of recent years should finally be resolved over the coming months. The economy is slowing but is on course for a soft landing, earnings growth will likely remain positive, and, most importantly, the Fed is on the verge of rate cuts, reducing the attractiveness of cash.
Non-cash assets can deliver solid returns and provide important diversification in portfolios. In the base case scenario, a soft landing, risk assets like equities should outperform. If, however, this is too optimistic and recession materializes, bonds can offer stability and a hedge against the downside risks. If inflation resurges, alternatives such as real assets can outperform. Investors should be prepared: Rate cuts should ignite a surge in sentiment—and there’s a massive $6 trillion mountain of cash to fuel the resulting rally in risk assets.
U.S. total money market fund assets
Trillions, 2000-present
Source: Federal Reserve, Investment Company Institute, Bloomberg, Principal Asset Allocation. Data as of March 31, 2024.
Index Descriptions
Important Information
Bloomberg Commodity Total Return index is composed of futures contracts and reflects the returns on a fully collateralized investment in the BCOM. This combines the returns of the BCOM with the returns on cash collateral invested in 13 week (3 Month) U.S. Treasury Bills�Bloomberg Global Aggregate Bond Index comprises global investment grade debt including treasuries, government-related, corporate, and securitized fixed-rate bonds from developed and emerging market issuers. There are four regional aggregate benchmarks that largely comprise the Global Aggregate Index: the US Aggregate, the Pan-European Aggregate, the Asian-Pacific Aggregate, and the Canadian Aggregate Indices. The Index also includes Eurodollar, Euro-Yen, and 144A Index-eligible securities and debt from other local currency markets not tracked by regional aggregate benchmarks�Bloomberg U.S. Agency Bond Index is composed of agency securities that are publicly issued by U.S. government agencies, and corporate and non-U.S. debt guaranteed by the U.S. government.�Bloomberg U.S. Aggregate Bond Index is the most widely followed broad market U.S. bond index. It measures the investment grade, US dollar-denominated, fixed-rate taxable bond market.�Bloomberg U.S. High-Yield Corporate Bond Index is a rules-based, market-value-weighted index engineered to measure publicly issued non-investment grade USD fixed-rate, taxable and corporate bonds.�Bloomberg U.S. Corp High Yield 2% Issuer Capped Index is an unmanaged index comprised of fixed rate, non-investment grade debt securities that are dollar denominated. The index limits the maximum exposure to any one issuer to 2%.�Bloomberg U.S. Corporate Investment Grade Index includes publicly issued U.S. corporate and specified foreign debentures and secured notes that meet the specified maturity, liquidity and quality requirements. To qualify, bonds must be SEC-registered. The corporate sectors are industrial, utility and finance, which include both U.S. and non-U.S. corporations.�Bloomberg U.S. Treasury Index measures U.S. dollar-denominated, fixed-rate, nominal debt issued by the U.S. Treasury. Treasury bills are excluded by the maturity constraint. STRIPS are excluded from the index because their inclusion would result in double-counting.�FTSE Global Core Infrastructure 50/50 Total Return Index comprises securities in developed countries which provide exposure to core infrastructure businesses, namely transportation, energy and telecommunications, as defined by FTSE's International Benchmark Classification.�The FTSE Nareit All Equity REITs Index is a free-float adjusted, market capitalization-weighted index of U.S. equity REITs.�HFRI 500 Fund Weighted Composite Index is a global, equal-weighted index of the largest hedge funds that report to the HFR Database which are open to new investments and offer quarterly liquidity or better.�ICE BofA Emerging Markets Corporate Plus Index, which tracks the performance of US dollar (USD) and Euro denominated emerging markets non-sovereign debt publicly issued within the major domestic and Eurobond markets.�ICE BofA MOVE index, or Merrill Lynch Option Volatility Estimate Index, is a crucial gauge of interest rate volatility in the U.S. Treasury market.�ICE BofA U.S. High Yield Index tracks the performance of US dollar denominated below investment grade rated corporate debt publicly issued in the US domestic market.�ICE BofA U.S. Investment Grade Institutional Capital Securities Index tracks the performance of US dollar denominated investment grade hybrid capital corporate and preferred securities publicly issued in the US domestic market.�ICE BofA U.S. Corporate Index consists of investment-grade corporate bonds that have a remaining maturity of greater than or equal to one year and have $250 million or more of outstanding face value.�J.P. Morgan Emerging Markets Bond Index Global Core tracks liquid, U.S. dollar emerging market fixed and floating-rate debt instruments issued by sovereign and quasi sovereign entities.�ISM manufacturing index is a leading economic indicator that measures the growth in the manufacturing sector in the United States.�MSCI ACWI Index includes large and mid cap stocks across developed and emerging market countries.�MSCI ACWI Utilities Index captures large and mid cap representation across 23 Developed Markets (DM) and 24 Emerging Markets (EM) countries*. All securities in the index are classified in the Utilities sector as per the Global Industry Classification Standard (GICS®).
Market indices have been provided for comparison purposes only. They are unmanaged and do not reflect any fees or expenses. Individuals cannot invest directly in an index
MSCI Brazil Index is designed to measure the performance of the large and mid cap segments of the Brazilian market.
MSCI China Index captures large and mid cap representation across China A shares, H shares, B shares, Red chips, P chips and foreign listings (e.g. ADRs).
MSCI EAFE Index is listed for foreign stock funds (EAFE refers to Europe, Australasia, and Far East). Widely accepted as a benchmark for international stock performance, the EAFE Index is an aggregate of 21 individual country indexes.
MSCI Emerging Markets Index consists of large and mid cap companies across 24 countries and represents 10% of the world market capitalization. The index covers approximately 85% of the free float-adjusted market capitalization in each country in each of the 24 countries.
MSCI Europe Index captures large and mid cap representation across 15 Developed Markets (DM) countries in Europe.
MSCI Europe Banks Index is composed of large and mid cap stocks across 15 Developed Markets countries in Europe. All securities in the index are classified in the Banks industry group (within the Financials sector) according to the Global Industry Classification Standard (GICS®).
MSCI Germany Index is designed to measure the performance of the large and mid cap segments of the German market.
MSCI India Index is designed to measure the performance of the large and mid cap segments of the Indian market.
MSCI Japan Index is designed to measure the performance of the large and mid cap segments of the Japanese market.
MSCI United Kingdom Index is designed to measure the performance of the large and mid cap segments of the UK market.
MSCI USA Growth Index captures large and mid cap securities exhibiting overall growth style characteristics in the U.S. The growth investment style characteristics for index construction are defined using five variables: long-term forward EPS growth rate, short-term forward EPS growth rate, current internal growth rate and long-term historical EPS growth trend and long-term historical sales per share growth trend.
MSCI USA Index is a market capitalization weighted index designed to measure the performance of equity securities in the top 85% by market capitalization of equity securities listed on stock exchanges in the United States.
MSCI USA Large Cap Index is designed to measure the performance of the large cap segments of the U.S. market.
MSCI USA Mid Cap Index is designed to measure the performance of the mid cap segments of the U.S. market.
MSCI USA Quality Index aims to capture the performance of quality growth stocks by identifying stocks with high quality scores based on three main fundamental variables: high return on equity (ROE), stable year-over-year earnings growth and low financial leverage. The MSCI Quality Indexes complement existing MSCI Factor Indexes and can provide an effective diversification role in a portfolio of factor strategies.
MSCI USA Small Cap Index is designed to measure the performance of the small cap segment of the U.S. equity market.
MSCI USA Value Index captures large and mid cap U.S. securities exhibiting overall value style characteristics. The value investment style characteristics for index construction are defined using three variables: book value to price, 12-month forward earnings to price and dividend yield.
Russell 2000 Index is a small-cap U.S. stock market index that makes up the smallest 2,000 stocks in the Russell 3000 Index.
Standard & Poor's 500 Index is a market capitalization-weighted index of 500 widely held stocks often used as a proxy for the stock market.
U.S. dollar index (USDX) is a measure of the value of the U.S. dollar relative to a basket of foreign currencies.
Market indices have been provided for comparison purposes only. They are unmanaged and do not reflect any fees or expenses. Individuals cannot invest directly in an index.
Index Descriptions


global market perspectives
For Public Distribution in the United States. For Institutional, Professinal, Qualified and/or Wholesale Investor Use Only in other Permitted Jurisdictions as defined by local laws and regulations.
What's not to like?
2Q 2024
Download Full PDF
Watch Webcast

Meet the Team

View next theme

View next theme
View last theme
View next theme
View last theme
Click through arrows below to learn more about our key themes.
U.S. growth will likely slow somewhat as lower income households pull back and corporates face higher refinancing costs. But with most other global economies still struggling, the U.S. will remain the strongest global performer.
Read more about this theme

01
02
Theme 2
Global disinflation is showing signs of stalling.
After having made significant progress last year, inflation deceleration has flattened out. The last mile of disinflation toward central bank targets will require some economic slowdown and job market rebalancing and will take time.
03
Theme 3
Central banks believe they can cut rates without sacrificing inflation.
The Fed wants to cut policy rates, but it may be fazed by recent inflation surprises. It will likely cut policy rates two times this year, starting in September. Other central banks will also begin easing soon but will cut with greater urgency.
Read more about this theme
Read more about this theme

This document is intended for use in:
•The United States by Principal Global Investors, LLC, which is regulated by the U.S. Securities and Exchange Commission.
•Europe by Principal Global Investors (Ireland) Limited, 70 Sir John Rogerson’s Quay, Dublin 2, D02 R296, Ireland. Principal Global Investors (Ireland) Limited is regulated by the Central Bank of Ireland. Clients that do not directly contract with Principal Global Investors (Europe) Limited ("PGIE") or Principal Global Investors (Ireland) Limited (“PGII”) will not benefit from the protections offered by the rules and regulations of the Financial Conduct Authority or the Central Bank of Ireland, including those enacted under MiFID II. Further, where clients do contract with PGIE or PGII, PGIE or PGII may delegate management authority to affiliates that are not authorisedand regulated within Europe and in any such case, the client may not benefit from all protections offered by the rules and regulations of the Financial Conduct Authority, or the Central Bank of Ireland. In Europe, this document is directed exclusively at Professional Clients and Eligible Counterparties and should not be relied upon by Retail Clients (all as defined by the MiFID).
•United Kingdom by Principal Global Investors (Europe) Limited, Level 1, 1 Wood Street, London, EC2V 7 JB, registered in England, No. 03819986, which is authorized and regulated by the Financial Conduct Authority ("FCA").
•United Arab Emirates by Principal Global Investors LLC, a branch registered in the Dubai International Financial Centre and authorized by the Dubai Financial Services Authority as a representative office and is delivered on an individual basis to the recipient and should not be passed on or otherwise distributed by the recipient to any other person or organization.
•Singapore by Principal Global Investors (Singapore)Limited (ACRA Reg. No. 199603735H), which is regulated by the Monetary Authority of Singapore and is directed exclusively at institutional investors as defined by the Securities and Futures Act 2001. This advertisement or publication has not been reviewed by the Monetary Authority of Singapore.
•Australia by Principal Global Investors (Australia) Limited (ABN 45 102 488 068, AFS LicenceNo. 225385), which is regulated by the Australian Securities and Investments Commission and is only directed at wholesale clients as defined under Corporations Act 2001.
•This document is marketing material and is issued in Switzerland by Principal Global Investors (Switzerland) GmbH.
•Hong Kong SAR (China) by Principal Asset Management Company (Asia) Limited, which is regulated by the Securities and Futures Commission. This document has not been reviewed by the Securities and Futures Commission.
•Other APAC Countries/Jurisdictions, this material is issued for institutional investors only (or professional/sophisticated/qualified investors, as such term may apply in local jurisdictions) and is delivered on an individual basis to the recipient and should not be passed on, used by any person or entity in any jurisdiction or country where such distribution or use would be contrary to locallaw or regulation.
Nothing in this document is, and shall not be considered as, an offer of financial products or services in Brazil. This presentation has been prepared for informational purposes only and is intended only for the designated recipients hereof. Principal Global Investors is not a Brazilian financial institution and is not licensed to and does not operate as a financial institution in Brazil.
Risk considerations
Investing involves risk, including possible loss of principal. Past performance is no guarantee of future results. Equity investments involve greater risk, including higher volatility, than fixed-income investments. Fixed-income investments are subject to interest rate risk; as interest rates rise their value will decline. International and global investing involves greater risks such as currency fluctuations, political/social instability and differing accounting standards.
Important Information
This material covers general information only and does not take account of any investor’s investment objectives or financial situation and should not be construed as specific investment advice, a recommendation, or be relied on in any way as a guarantee, promise, forecast or prediction of future events regarding an investment or the markets in general. The opinions and predictions expressed are subject to change without prior notice. The information presented has been derived from sources believed to be accurate; however, we do not independently verify or guarantee its accuracy or validity. Any reference to a specific investment or security does not constitute a recommendation to buy, sell, or hold such investment or security, nor an indication that the investment manager or its affiliates has recommended a specific security for any client account. Subject to any contrary provisions of applicable law, the investment manager and its affiliates, and their officers, directors, employees, agents, disclaim any express or implied warranty of reliability or accuracy and any responsibility arising in any way (including by reason of negligence) for errors or omissions in the information or data provided.
This material may contain ‘forward-looking’ information that is not purely historical in nature and may include, among other things, projections and forecasts. There is no guarantee that any forecasts made will come to pass. Reliance upon information in this material is at the sole discretion of the reader.
This material is not intended for distribution to or use by any person or entity in any jurisdiction or country where such distribution or use would be contrary to local law or regulation.
Important Information
Insurance products and plan administrative services provided through Principal Life Insurance Co. Principal Funds, Inc. is distributed by Principal Funds Distributor, Inc. Securities are offered through Principal Securities, Inc., 800 547-7754, Member SIPC and/or independent broker/dealers. Principal Life, Principal Funds Distributor, Inc., and Principal Securities are members of the Principal Financial Group®, Des Moines, IA50392.
© 2024, Principal Financial Services, Inc. Principal Asset ManagementSM is a trade name of Principal Global Investors, LLC. Principal®, Principal Financial Group®, Principal Asset Management, and Principal and the logomark design are registered trademarks and service marks of Principal Financial Services, Inc., a Principal Financial Group company, in various countries around the world and may be used only with the permission of Principal Financial Services, Inc.
3487973
6%
4%
2%
0%
-2%
-4%
UK
U.S.
Japan
Europe area
2022 4Q
2023 1Q
2023 2Q
2023 3Q
2023 4Q
6%
5%
4%
3%
2%
1%
0%
Jan 21
Apr
21
Jul
21
Oct
21
Jan
22
Apr
22
Jul
22
Oct
22
Jan
23
Apr
23
Jul 23
Oct 23
Jan 24 Apr 24
Jul 24
Oct 24
Jan 25
Apr 25
Jul
25
Oct
25
Federal Reserve
European Central Bank
Bank of England
5,000
4,000
3,000
2,000
1,000
0
1995
2000
2005
2010
2015
2020
$200
$150
$100
$50
$0
View next theme
View last theme
S&P 500 Index (LHS)
S&P 500 EPS (RHS)
Tech bubble peak:
1,527
EPS $53
Housing bubble peak:
1,565
EPS $93
March 29, 2024:
5,254
EPS $223
14%
12%
10%
8%
6%
4%
2%
0%
2013
2014
2015
2016
2017
2018
2019
2020
2021
2022
2023
2024
U.S. high yield
U.S. investment grade
S&P 500
10y U.S. Treasury
$6.0
$5.5
$5.0
$4.5
$4.0
$3.5
$3.0
$2.5
$2.0
$1.5
2000
2005
2010
2015
2020
2025
Global Financial Crisis
Pandemic
Fed rate hikes
$6.0tn


View next theme
View last theme
View last theme
Download Full PDF
View Disclosures
Hear why Seema Shah, Chief Global Strategist, believes a shift toward easier financial conditions positions investors for potential outperformance during the remainder of 2024.
2Q 2024
Global market perspectives

Seema Shah
Chief Global Strategist
Principal Global Insights Team


Brian Skoypec, CIMA
Director, Global Insights & Content Strategy
Benjamin Brandsgard
Insights Strategist


2Q 2024
2Q 2024


Download Full PDF
Global central banks: More reason to cut than the Fed
Key takeaway
Although global central banks will likely start cutting rates at the same time as the Fed, they will then move with greater urgency. Their relatively dovish policy path will keep upward pressure on the U.S. dollar.
Typically, as the largest economy in the world, the U.S. sets the stage, and global central banks wait for a signal from the Fed before they begin their easing cycles. With the Fed likely to reduce policy rates around mid-year, global central bank policies will once again be synchronized—despite the divergence in economic growth prospects.
The European Central Bank (ECB) and the Bank of England (BoE) are struggling with weak economies and have a clearer need to loosen monetary policy than the Fed. However, they are waiting to gather sufficient evidence of sustained disinflation before they enact a rate cut. As a result, the ECB rate cutting cycle will likely be delayed until June—the same month as the Fed—and, for the BoE, late summe
Once they do start cutting rates, the BoE and ECB are likely to move with more urgency than the Fed as they are facing a greater risk of protracted economic downturns. As a result, the U.S. dollar is likely looking at an extended period of strength, only slightly muted by the Bank of Japan’s policy moves towards a more restrictive setting.
Global central bank rates
January 2021 - present, forecasted through 2025
Source: Federal Reserve, European Central Bank, Bank of England, Principal Asset Management. Data as of April 10, 2024.


Download Full PDF
Equities should continue embracing the soft landing narrative.
Key takeaway
Equity markets are facing a goldilocks combination of a soft landing and rate cuts. This should support a broadening of the market rally to other more cyclical sectors.
Central banks have fueled a market rally as they embrace optimism about inflation without sacrificing growth. Historically, when central bank easing takes place against a backdrop of a soft landing (like in 1995) the economy enters a mid-cycle position—whereby growth is stimulated by rate cuts, extending the economic expansion, the earnings upswing and, therefore, the market rally.
The Magnificent 7 should extend their positive performance. After all, the strong balance sheet characteristics and secure competitive market positions of the Magnificent 7 imply that a significant correction is unlikely, despite their valuations drawing comparisons to the 2000s tech bubble. Yet, this year, the combination of a soft economic landing and rate cuts should see strong performance broadening to other more cyclical sectors and markets whose valuations are not quite so stretched.
The stock market and earnings
S&P 500 Index price and trailing earnings-per-share, 1990-present
Source: Clearnomics, Standard & Poor’s, Bloomberg, Principal Asset Management. Data as of March 31, 2024.

View next theme
View last theme
View next theme
View last theme
Download Full PDF
Fixed income: We’re here for the carry
Key takeaway
Although credit spreads remain tight, the fixed income asset class is offering important carry opportunities. Concerns around the high yield maturity wall are likely overblown.
The combination of solid economic growth and a Fed that is clearly keen to cut policy rates has solidified a constructive backdrop for credit.
Spreads are historically tight for both investment grade and high yield credit. Yet, while spreads may not tighten significantly from here, provided the economy does not deteriorate significantly, they should not widen much either. More pertinently, credit is offering important additional carry to U.S. Treasurys, while the total yield available in fixed income is also attractive compared to equities.
A much-flagged risk for high yield this year is that the wall of maturing debt will face significantly higher refinancing costs, potentially triggering a spike in defaults. However, the resilient macro backdrop and strong balance sheets suggest that companies should scale the wall relatively unscathed.
Yield comparison: High yield bonds, investment grade bonds, U.S. Treasurys, and S&P 500
High yield bond yield-to-worst, investment grade bond yield-to-worst, U.S. Treasury yield-to-worst, S&P 500 12m forward earnings yield
Source: S&P Dow Jones, Federal Reserve, Bloomberg, Principal Asset Management. Data as of March 31, 2024.
10%
8%
6%
4%
2%
0%
-2%
'07
'08
'09
'10
'11
'12
'13
'14
'15
'16
'17
'18
'19
'20
'21
'22
'23
'24
U.S.
Developed markets
Emerging markets
Download Full PDF
The wall of cash is looking for a new home
Key takeaway
Money market funds have surged in recent years but, in 2024, with rate cuts likely and the economy still on a positive path, risk assets should perform strongly, and cash is set to lose its attractiveness.
Assets in money market funds have ballooned to a record $6 trillion, with investors attracted by elevated yields and partially hiding from an uncertain U.S. economic outlook. Many of the concerns and questions of recent years should finally be resolved over the coming months. The economy is slowing but is on course for a soft landing, earnings growth will likely remain positive, and, most importantly, the Fed is on the verge of rate cuts, reducing the attractiveness of cash.
Non-cash assets can deliver solid returns and provide important diversification in portfolios. In the base case scenario, a soft landing, risk assets like equities should outperform. If, however, this is too optimistic and recession materializes, bonds can offer stability and a hedge against the downside risks. If inflation resurges, alternatives such as real assets can outperform. Investors should be prepared: Rate cuts should ignite a surge in sentiment—and there’s a massive $6 trillion mountain of cash to fuel the resulting rally in risk assets.
U.S. total money market fund assets
Trillions, 2000-present
Source: Federal Reserve, Investment Company Institute, Bloomberg, Principal Asset Allocation. Data as of January 10, 2024.
Insurance products and plan administrative services provided through Principal Life Insurance Co. Principal Funds, Inc. is distributed by Principal Funds Distributor, Inc. Securities are offered through Principal Securities, Inc., 800 547-7754, Member SIPC and/or independent broker/dealers. Principal Life, Principal Funds Distributor, Inc., and Principal Securities are members of the Principal Financial Group®, Des Moines, IA50392.
© 2024, Principal Financial Services, Inc. Principal Asset ManagementSM is a trade name of Principal Global Investors, LLC. Principal®, Principal Financial Group®, Principal Asset Management, and Principal and the logomark design are registered trademarks and service marks of Principal Financial Services, Inc., a Principal Financial Group company, in various countries around the world and may be used only with the permission of Principal Financial Services, Inc.
3487973
Read more about this theme
Read more about this theme
14%
12%
10%
8%
6%
4%
2%
0%
2013
2014
2015
2016
2017
2018
2019
2020
2021
2022
2023
2024
U.S. high yield
U.S. investment grade
S&P 500
U.S. treasury

$6.0
$5.5
$5.0
$4.5
$4.0
$3.5
$3.0
$2.5
$2.0
$1.5
2000
2005
2010
2015
2020
2025
Global Financial Crisis
Pandemic
Fed rate hikes
$6.0tn
View next theme
View last theme
View disclosures
View last theme
Insurance products and plan administrative services provided through Principal Life Insurance Co. Principal Funds, Inc. is distributed by Principal Funds Distributor, Inc. Securities are offered through Principal Securities, Inc., 800 547-7754, Member SIPC and/or independent broker/dealers. Principal Life, Principal Funds Distributor, Inc., and Principal Securities are members of the Principal Financial Group®, Des Moines, IA50392.
© 2024, Principal Financial Services, Inc. Principal Asset ManagementSM is a trade name of Principal Global Investors, LLC. Principal®, Principal Financial Group®, Principal Asset Management, and Principal and the logomark design are registered trademarks and service marks of Principal Financial Services, Inc., a Principal Financial Group company, in various countries around the world and may be used only with the permission of Principal Financial Services, Inc.
3487973
10%
8%
6%
4%
2%
0%
-2%
'07
'08
'09
'10
'11
'12
'13
'14
'15
'16
'17
'18
'19
'20
'21
'22
'23
'24
U.S.
Developed markets
Emerging markets
04
Theme 4
Equities should continue embracing the soft landing narrative.
The constructive backdrop of solid growth, positive earnings and prospective rate cuts has been fueling market optimism. This mix should also support a broadening of the market rally as rate cuts come closer into sight.
Read more about this theme
05
Theme 5
Equities are embracing the soft landing/rate cuts combination.
The constructive backdrop of solid growth, positive earnings and prospective rate cuts is fueling market optimism. This mix should also support a broadening of the market rally as rate cuts come closer into sight.
Read more about this theme
06
Theme 6
With potential gains across asset classes, staying in cash is the main risk.
Assets in money market funds have ballooned to a record $6 trillion, with investors attracted by elevated yields. Now, this cash represents a potential tailwind to risk assets.
Read more about this theme
Download Full PDF
Meet the Team
Download Full PDF
Watch Webcast

Meet the Team
Coming Soon
Read more about this theme
Read more about this theme
Read more about this theme