The Freight Economist
January 2025
Executive summary
Monthly economic and market update: Year in review
Tractor and trailer orders surged in November, potentially indicating
rising carrier confidence in
a market rebound.
U.S. economy
Income and savings
Labor market
Housing market


Freight demand
Imports
Truck
tonnage
Manufacturing
Consumer spending


December marked a strong finish for container imports.
U.S. container imports approached 2.4 million TEU in December. Compared to December 2023, volumes increased by 12.4%, and a remarkable 24.3% surge was observed compared to pre-pandemic levels in December 2019. For the entirety of 2024, total container imports reached 28.2M TEU, representing a 13% increase over 2023's total of 25M TEU. Imports from China specifically saw a 1.7% increase in December, reaching 902,519 TEU, and a 14.5% year-over-year increase compared to December 2023.
Imports

What does it mean for truck tonnage?
Consumer spending
Key data points and commentary
Trucking
volume

Rail volume
and rates

Geographic
trends

Routing guide trends

Routing guide trends
Geographic trends
Average m/m and y/y van spot rate index by origin regions – December
Source: DAT
Trucking volume
Freight volumes contracted in the last two months. The Cass Freight Shipments Index declined by 3.1% in December (seasonally adjusted), reversing the 2.8% gain in November. Year-over-year, the index contracted by 6.5% in December, the largest decline since January 2023. For 2023, the index registered a 4.1% decrease. Similarly, the American Trucking Associations (ATA) Truck Tonnage Index fell 1.9% and was down 1% year-over-year.
Rail volume and rates
Rail and intermodal transportation costs remained relatively stable in December. While the Producer Price Index for intermodal freight saw a slight 0.2% decrease, resulting in a 5.3% year-over-year decline, this trend is not expected to continue. In fact, intermodal rates are likely to increase, mirroring the recent upward trajectory of truckload contract rates. Conversely, the Producer Price Index for rail freight remained unchanged in December, yet still exhibited a 2.7% year-over-year increase.

Mazen’s work focuses on analyzing the freight transportation landscape, and producing short- and long-term forecasts based on supply and demand dynamics. He is also a research affiliate with the Intelligent Transportation Systems (ITS) Lab at MIT, where he completed his PhD in 2019. His work falls at the intersection of ITS, economic modeling, and analytics.
mdanaf@uberfreight.com
By Mazen Danaf, Senior Economist and Applied Scientist, Uber Freight
Featuring insights and contributions from Uber Freight leadership,
technologists and market specialists.


Routing guide performance deteriorated further in December. The first tender acceptance rate fell from 91% to 89%, and routing guide compliance fell from 94% to 92%. These were the lowest levels since mid-2022. Cost over the primary carrier surged from 1.9% to 3%, indicating that market tightening is beginning to impact shippers’ financials.
Real disposable income increased by 0.2% in November, representing a 2.6% year-over-year gain. This inflation-adjusted figure indicates that consumers' purchasing power has strengthened over the past 12 months. While still lagging 3.2% below the pre-pandemic trend, real disposable income has been steadily recovering since the trough experienced in early 2022.
To sustain the same level of consumer spending growth, particularly given the recent period of slower income growth, consumers have been reducing their saving rates. The current saving rate stands at 4.4%, notably lower than the pre-pandemic average range of 7% to 8%.


Executive
summary
U.S.
economy
Freight
demand
Freight
supply
Income and savings

Outbound dry van spot rates increased across all mega-regions in December. The Southeast experienced the most significant increase at +6.5%, while the West saw the smallest increase at +3.6%. This Southeast increase was counterseasonal, as these markets typically peak during the summer produce season. Compared to the previous year, rates were higher across all regions. The West exhibited the highest year-over-year growth at 15.9%, while the Southeast showed the lowest at 2.5%.
Key data
points
Shipper and carrier insights: 2024 lookback
Consumer spending remained robust in November.
Real spending on goods increased by 0.7% month-over-month and 3.4% year-over-year. Durable goods were a significant driver, rising 1.8% in November and 5.7% compared to the same period last year. Nondurable goods spending grew more modestly, up 0.2% month-over-month and 2.2% year-over-year. Notably, goods spending has outpaced services spending over the past year. Services spending rose only 0.1% in November and 2.7% year-over-year.
Inflation

Consumer spending continues to drive truckload demand.
Consumer-driven demand rose modestly in November, increasing by 0.3% and exhibiting a healthy year-over-year growth rate of 2.2%. Conversely, manufacturing-driven demand remained stagnant, registering a 1.5% decline compared to the previous year. Wholesale-driven demand also contracted, falling by 1% in November, erasing gains achieved in prior months.
An unusual surge in import and export activity in November resulted in an overall increase in total truckload demand. However, this import/export boost is unlikely to sustain long-term growth, necessitating a recovery within the manufacturing sector. Encouragingly, the ISM Purchasing Managers' Index (PMI) is starting to show signs of this recovery, with manufacturers' new orders demonstrating signs of improvement.


1/2
2/2
The U.S. economy displayed resilience in December, adding a robust 256,000 jobs, a substantial increase compared to the 212,000 added in November. While the final phase in the battle against inflation is proving more arduous, indicators point towards stability in freight-generating economic activity, particularly within the manufacturing sector.
1/2


Rail and intermodal volumes both experienced a 2.5% decline in December, which is typical during the holiday season due to reduced economic activity. Despite this seasonal dip, intermodal volumes demonstrated year-over-year strength, increasing by 6.3%. In contrast, carload volumes lagged behind, showing a 2.8% decrease compared to the same period last year.


1/2
2/2
Shipper and carrier insights
The housing market continues to grapple with the persistent headwind of elevated mortgage rates. Despite a recent reduction in the Federal Funds rate, the 30-year fixed mortgage rate has steadily climbed since late September 2024, exceeding 7% once more in early January. This has exerted a significant dampening effect on housing activity.
While new home sales exhibited a modest recovery in November, increasing 5.9% month-over-month and 8.7% year-over-year, they remain substantially below their peak levels attained during the pandemic-era housing boom, representing a 35.6% decline. The struggling housing market continues to suppress freight demand, impacting the demand for construction materials and related sectors such as furniture, appliances, and home improvement goods.
A glimmer of hope emerged in December with a sharp 15.8% surge in housing starts on a seasonally adjusted basis. However, it is crucial to note that this indicator is inherently volatile and subject to shifting seasonal patterns. The sustainability of this increase in the coming months remains uncertain.

Housing market
The Consumer Price Index (CPI) increased by 0.4% in December, following a 0.3% rise in November. While the annual inflation rate remained below 3%, the three-month annualized inflation rate suggests a higher rate of 3.1%. Energy prices surged by 2.6% in December, contributing to over forty percent of the overall monthly price increase, according to the US Bureau of Labor Statistics. Excluding volatile food and energy prices (core inflation), prices rose 0.2% in December, resulting in a 2.9% year-over-year increase.
Combined with the Producer Price Index (PPI) rising 3.3% year-over-year, these indices suggest that the Federal Reserve's fight against inflation is far from over. This may lead to a slower pace of interest rate cuts in 2025 than initially anticipated.

Inflation
Signs of stability in unemployment and job growth.
The U.S. economy demonstrated resilience in December, adding a robust 256,000 jobs, a significant increase from the 212,000 jobs added in November. This suggests a stabilization of the labor market following a period of noticeable softening. The unemployment rate also decreased, falling from 4.2% in November to 4.1% in December. This rate has remained relatively stable since June of last year, hovering within a narrow range.
Despite persistent inflation, which remains slightly above the Federal Reserve's target of 2%, the recent stability in both employment growth and inflation suggests that the economy may be successfully navigating a "soft landing." The absence of a second wave of soaring inflation and the avoidance of excessive layoffs and unemployment further support this positive outlook.

Labor market


Positive signs emerge in the manufacturing sector.
The ISM Manufacturing PMI edged up to 49.3 in December. Demand strengthened, production met company expectations, and workforce reductions continued, according to the Institute for Supply Management (ISM). Price pressures remained subdued. With the index nearing 50, the manufacturing economy appears to be stabilizing after a prolonged period of contraction spanning 25 months. Encouragingly, new orders rose above the 50.0 expansion threshold for the second straight month, signaling a positive outlook for future demand.
Manufacturing

Freight supply
Spot rates

Carrier
operating costs

Supply and demand indices

Tractor and trailer orders

Truckload demand rebounded in November, increasing by 0.6% after a decline in October. The increase was mostly driven by imports and exports. While demand was 0.5% higher year-over-year, it remained 3.5% below the peak seen in early 2022. Both truckload supply and demand have exhibited stable trends over the past two years.
Truckload supply and demand indices
Dry van spot rates surged 6.1% in December, marking the largest monthly increase since December 2022. Rates were 4.8% higher than the same period in the previous year. Despite typical seasonal headwinds, rates continued to climb in the first two weeks of January, primarily driven by disruptions caused by winter storms. Reefer spot rates also saw an increase, rising 1.5% in December and exceeding the prior year's levels by 4%.
Contract rates followed a similar upward trend, with dry van increasing by 1%, reefer by 0.4%, and flatbed by 1.2% in December. Notably, dry van and reefer contract rates have now demonstrated four consecutive months of growth, according to ACT Research.

Spot rates
Market conditions
Market
conditions
Despite recent gains, the spot market remains unprofitable for carriers.
Truck operating costs rose 2 cents/mile in 2023 despite a 9-cent diesel price decline. This was due to year-over-year increases in insurance (+13%), truck and trailer costs (+9%), and driver wages (+8%). Costs fell 2 cents/mile in 2024 according to Uber Freight’s estimates, resulting in stable costs over the past two years.
The cost per loaded mile remains significantly above spot rates. However, rates are increasing to align with higher costs, which are not expected to fall further in the coming year.
Carrier operating costs
Are we witnessing a market shift?
Spot rates are an early indicator of the freight cycle. They typically decline in January as peak season demand subsides. However, weather disruptions, particularly in the Pacific Northwest, Midwest, and Northeast, can prolong tightness. This effect was pronounced last year and this year due to winter storms.
Within the freight market, a surprising trend has emerged in January: market tightening, contrary to typical seasonal softening. This unexpected tightening may be a temporary consequence of severe weather conditions impacting the nation. In 2023, following severe winter storms in January, the national average spot rate per mile on the TM platform plummeted 24% from January to April as weather disruptions subsided. Whether a similar decline will transpire this year remains uncertain, but the forthcoming weeks will be pivotal in determining the market's trajectory. Persistent market tightness would signify a favorable shift in the balance of power, favoring carriers.
2/2
High mortgage rates weigh down on freight demand.
Industrial production of machinery, primary metals, and fabricated metals has remained relatively flat or slightly declined over the past year. A recovery in these sectors seems unlikely in the near future, as orders and shipments of core capital goods—a key indicator of manufacturing activity—have also stagnated.
Orders for core capital goods, which are nondefense capital goods excluding aircraft, are considered an early indicator of manufacturing activity. Weak orders and shipments in this sector suggest that a broader economic recovery may be delayed.


Industrial equipment and supplies
Automotive
Auto manufacturing has been one of the bright spots in the economy over the past year, driven by pent-up demand and a shortage of vehicles at dealerships. While production rose to meet demand, the market is starting to show signs of saturation, with inventories gradually normalizing and potential glut looming on the wholesale side.


Paper and plastics
Paper and plastics are highly used in the packaging industry, which has been affected by the recent slowdown in food spending after the economy re-opened. In addition, the demand for paper products was already on a downward trajectory due to factors such as digitalization, adoption of alternatives (plastics), and growth of e-commerce. The pandemic further accelerated this decline. Moreover, a surge in downstream inventories led to a slowdown in manufacturers’ demand.


Nondurable consumer goods
Demand for food consumed at home fell from its pandemic highs as the economy re-opened, normalizing back to its pre-pandemic levels. Demand for other consumer goods (such as apparel) continues to be pressured by external competition, slowing consumer demand, and high downstream inventories.


Durable consumer goods
Durable consumer goods such as appliances, furniture, and wood products are affected by the ongoing housing recession. New home sales remain below the 2019 levels, and about 30% below the pandemic peak. Similarly, housing starts are at their lowest level since the beginning of the housing recession, 32% below the 2022 peak.


The final stretch in the battle against inflation is
proving more challenging.
Consumers are adjusting to a new normal.

1
Contrary to typical seasonal trends, all indicators suggest a tightening market in January rather than a softening. For instance, the DAT load-to-truck ratio (LTR) surged to 6.14 in December, a substantial increase compared to 3.37 in December 2023 and 3.89 in December 2022. This momentum carried into January, with the LTR exceeding 9 – the highest level observed since February 2022.
Concurrently, the FreightWaves tender rejection index surged during the pre-holiday period, climbing from 6.4% to 10.2%. While it moderated slightly from its peak on December 22nd, settling at 6.8%, the index remained significantly higher than the same period last year and subsequently climbed again in January, reaching 8.3%.
On the Uber Freight Transportation Management (TM) platform, the national average spot rate per mile across all asset- and non-asset-based carriers fell slightly during the first two weeks of January, but remained 5% above the average December level, and 6.2% above the comparable year-ago levels.
Tractor and trailer orders surged in November.
Sleeper tractor orders surged 57% in November, exceeding the previous year's levels by 11%. November’s sleeper tractor orders were the highest in 25 months. Similarly, dry van trailer orders climbed 58% and were 15% higher year-over-year. While sleeper tractor orders declined by 11% in December, they remained significantly higher than the prior year, at 67% above the same period.
Day cab tractor orders also demonstrated robust growth, rising 24% in December and 29% in January, resulting in a 62% year-over-year increase.
This recent surge in orders reflects a growing confidence among carriers in an imminent market recovery. However, it also carries the potential for a delayed or less pronounced recovery once this new capacity enters the market.

Tractor and trailer orders


Similarly, the rising percentage of spot-FAM shipments points to a tighter market. Spot-FAM shipments accounted for just 7.4% of all shipments in the first two weeks of 2024, but this steadily rose to 9% in the first two weeks of 2025, indicating a 22% increase in spot market activity.
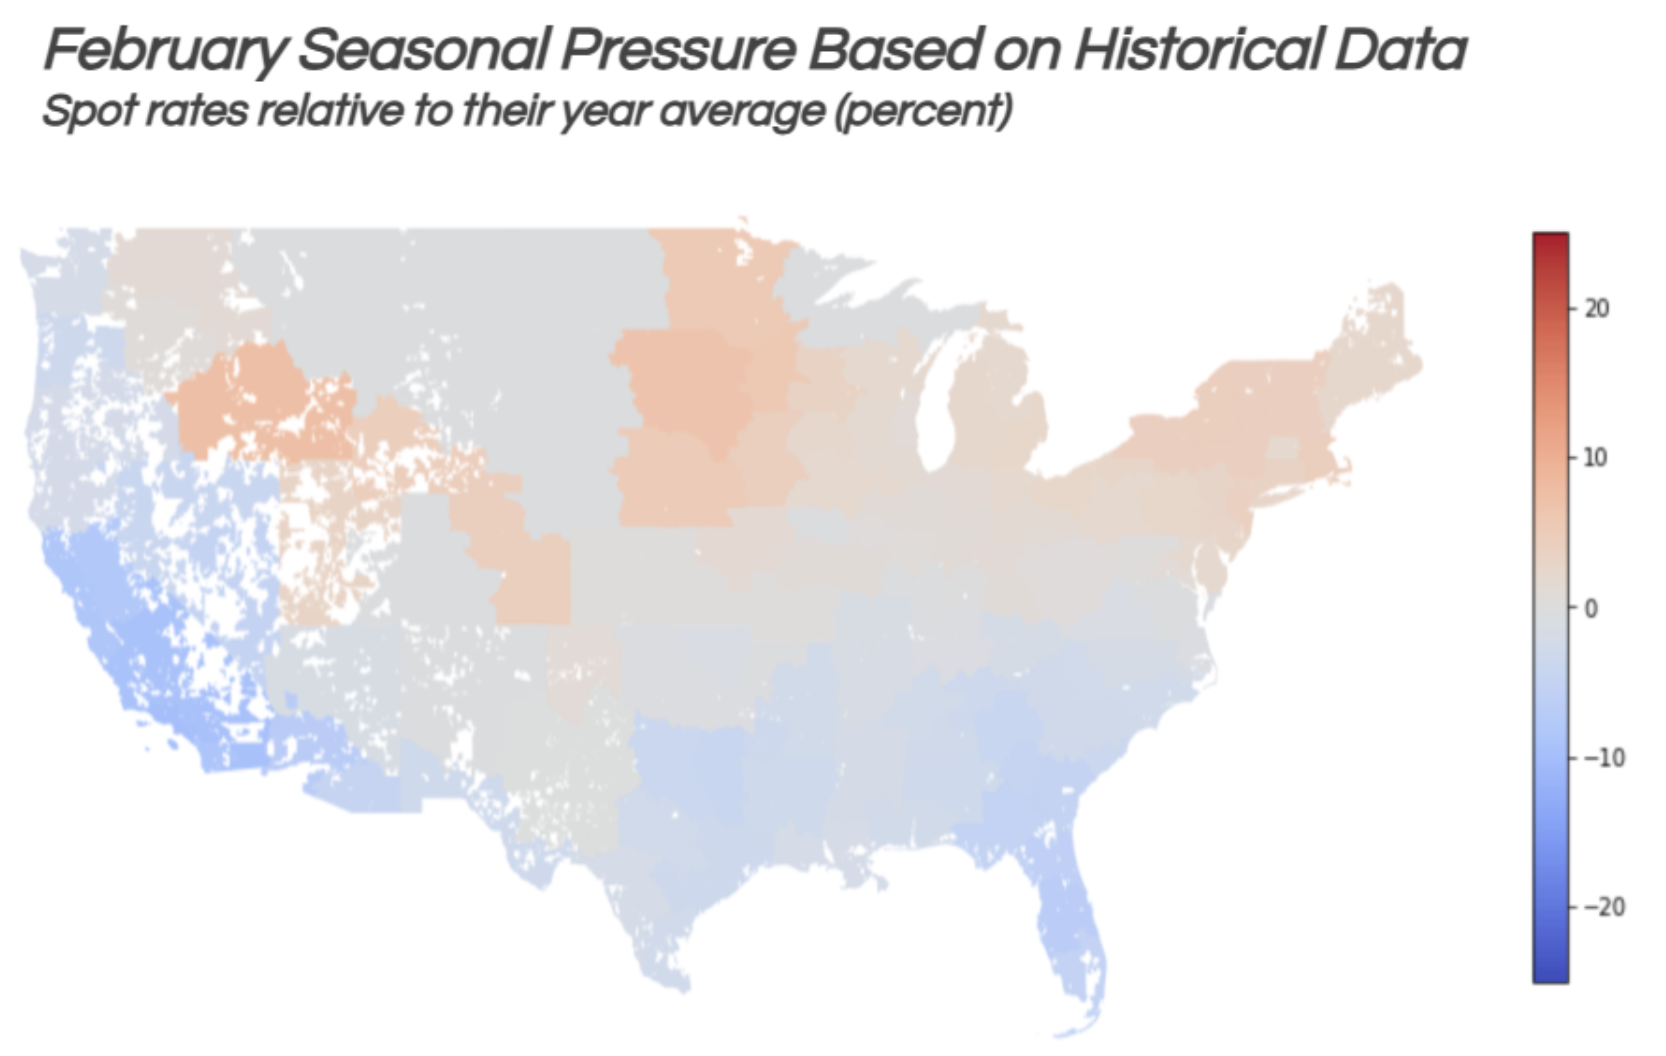
Compared to the first map above, which depicts typical seasonal pressures in January, the map below reveals that this year is witnessing a significant tightening, particularly in the Northeast, Midwest, and Southeast—regions heavily impacted by recent winter storms.

February typically marks a decline in spot market demand as the holiday rush subsides and drivers return to work. This usually results in spot rates falling below annual averages, with the exception of a few Midwest regions.
Last year, following severe winter storms in January, the national average spot rate per mile on the TM platform plunged 24% from January to April as weather disruptions subsided. Whether a similar decline will occur this year remains uncertain, but the next few weeks will be crucial in determining the market's trajectory. Continued market tightness would indicate a favorable shift in the balance of power toward carriers.