The Freight Economist
August 2025
Executive summary
Monthly economic and market update
July’s containerized
imports reached the second-highest level
on record.
U.S. economy
U.S. GDP
Inflation
Tariffs


Freight demand
Imports
Truck
tonnage
Manufacturing
Spending
on goods


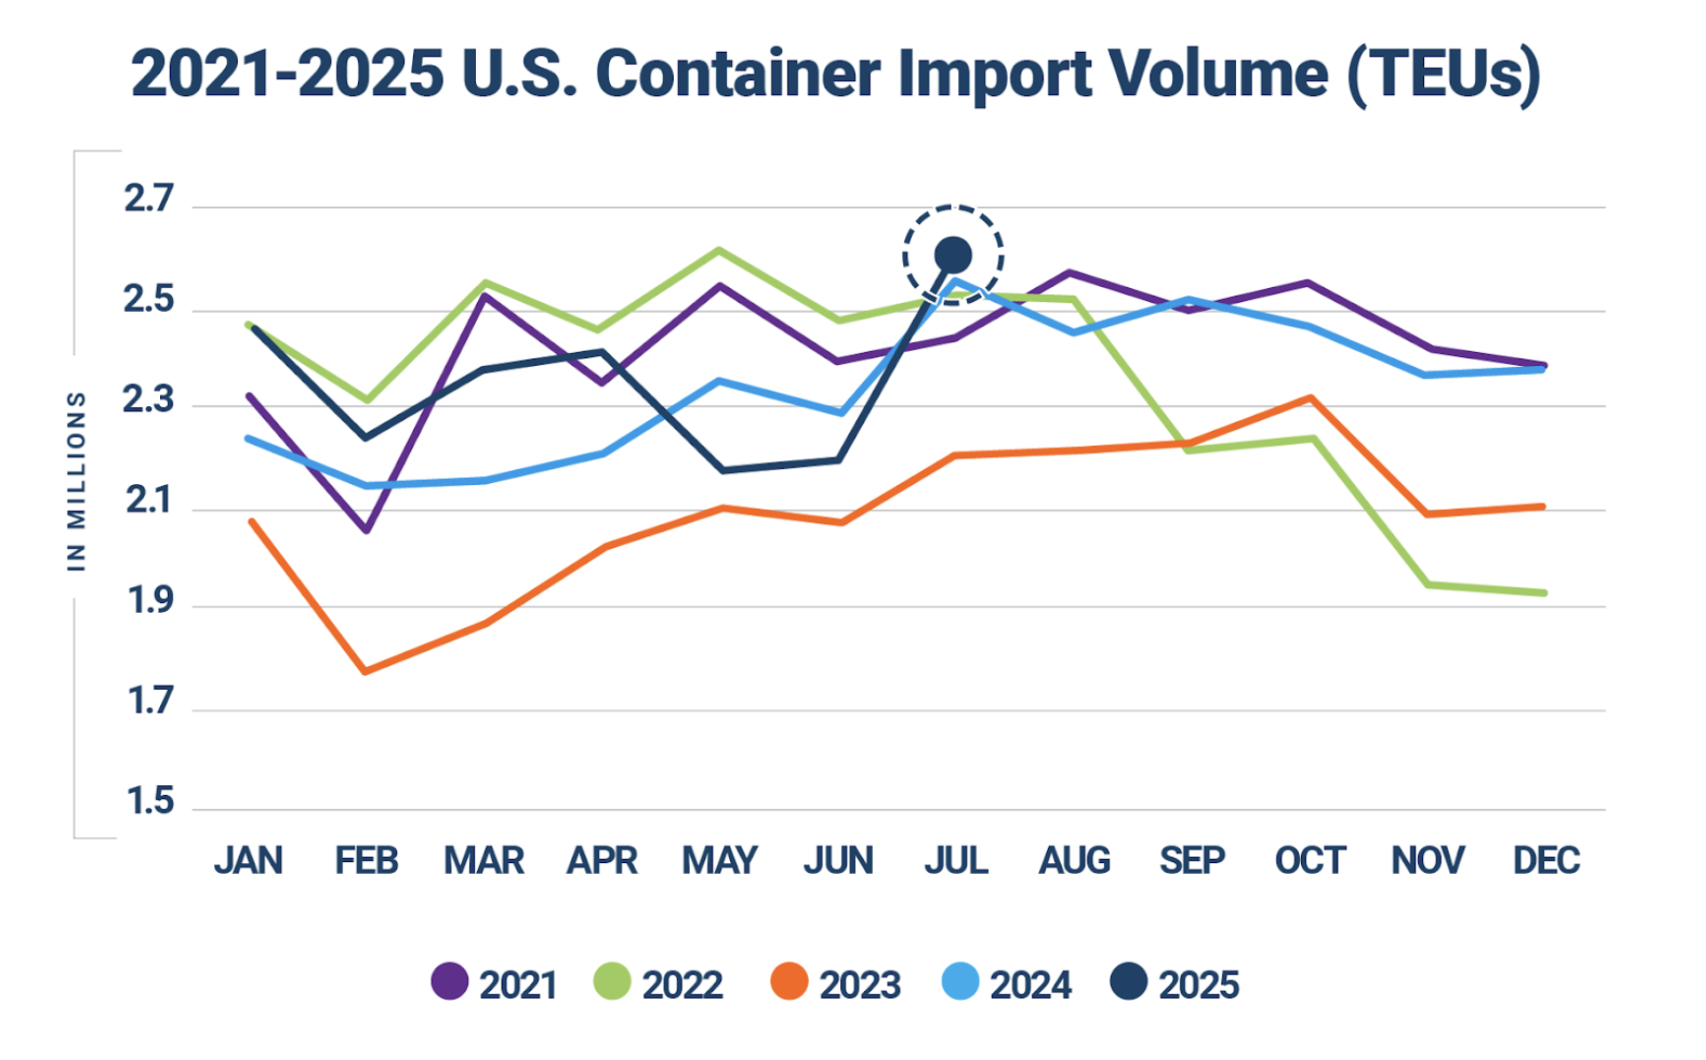
In July, container imports reached the second-highest level on record.
Container imports surged by 18.2% from June. While July is a typically strong month for imports, this growth outpaced seasonal trends, rising 13% even on a seasonally adjusted basis.
This surge was primarily led by imports from China, which saw a 44.4% month-over-month increase. This followed the U.S.–China trade truce announcement, which reduced the tariff rate on Chinese goods from 145% to 30%.
Much of this growth is likely unsustainable and a result of "front-loading" by shippers. The truce, which was recently extended, was initially set to end in October. To get ahead of the high tariff rates, companies were both accelerating new shipments and releasing inventory that had been held back.
Imports
What does it mean for truck tonnage?
Spending on goods
Key data points and commentary
Trucking
volume

Intermodal
rates

Geographic
trends

Routing guide trends

Routing guide trends
Geographic trends
Trucking volume
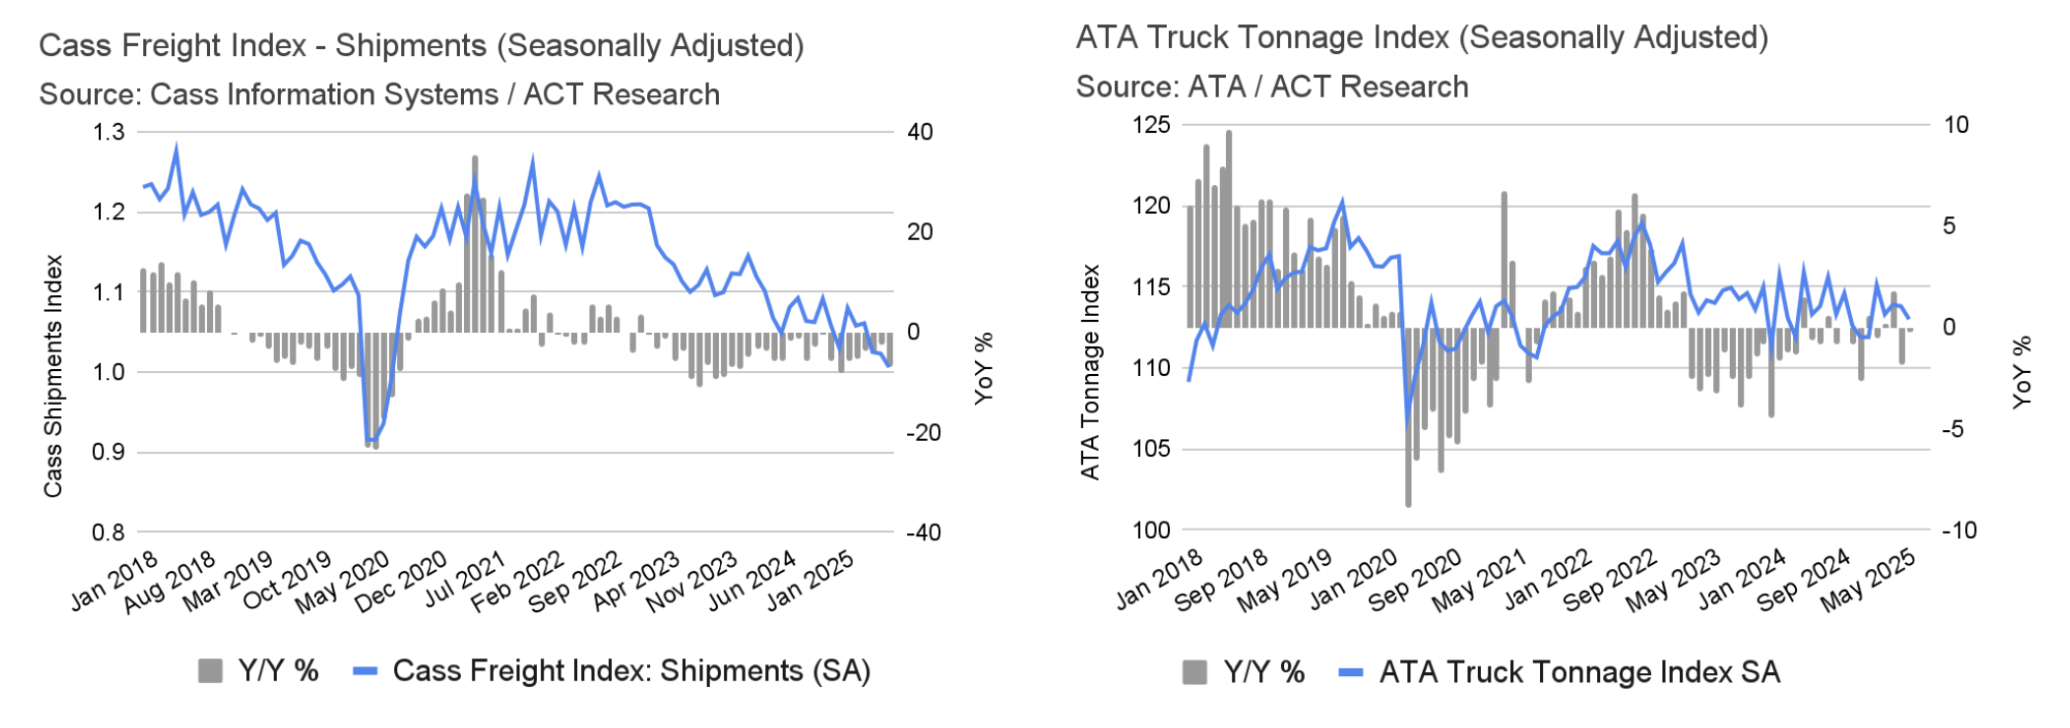
The Cass Freight Shipments Index continued its steep downward trend in July, falling 1.7% on a seasonally adjusted basis and a significant 6.9% from July of 2024. As this index measures the number of shipments, regardless of volume, the weakness can be attributed to slowing Less-Than-Truckload (LTL) demand. While still depressed, truckload volume has not experienced a substantial year-over-year decline. According to the American Trucking Associations' Truck Tonnage Index, trucking volumes decreased by 0.4% in June, following a slight 0.1% drop in May. On a quarterly basis, volumes saw a 0.2% increase from the first quarter but were down 0.2% compared to the same period last year.
Intermodal rates
Mazen’s work focuses on analyzing the freight transportation landscape, and producing short- and long-term forecasts based on supply and demand dynamics. He is also a research affiliate with the Intelligent Transportation Systems (ITS) Lab at MIT, where he completed his PhD in 2019. His work falls at the intersection of ITS, economic modeling, and analytics.
mdanaf@uberfreight.com
By Mazen Danaf, Senior Economist and Applied Scientist, Uber Freight
Featuring insights and contributions from Uber Freight leadership,
technologists and market specialists.

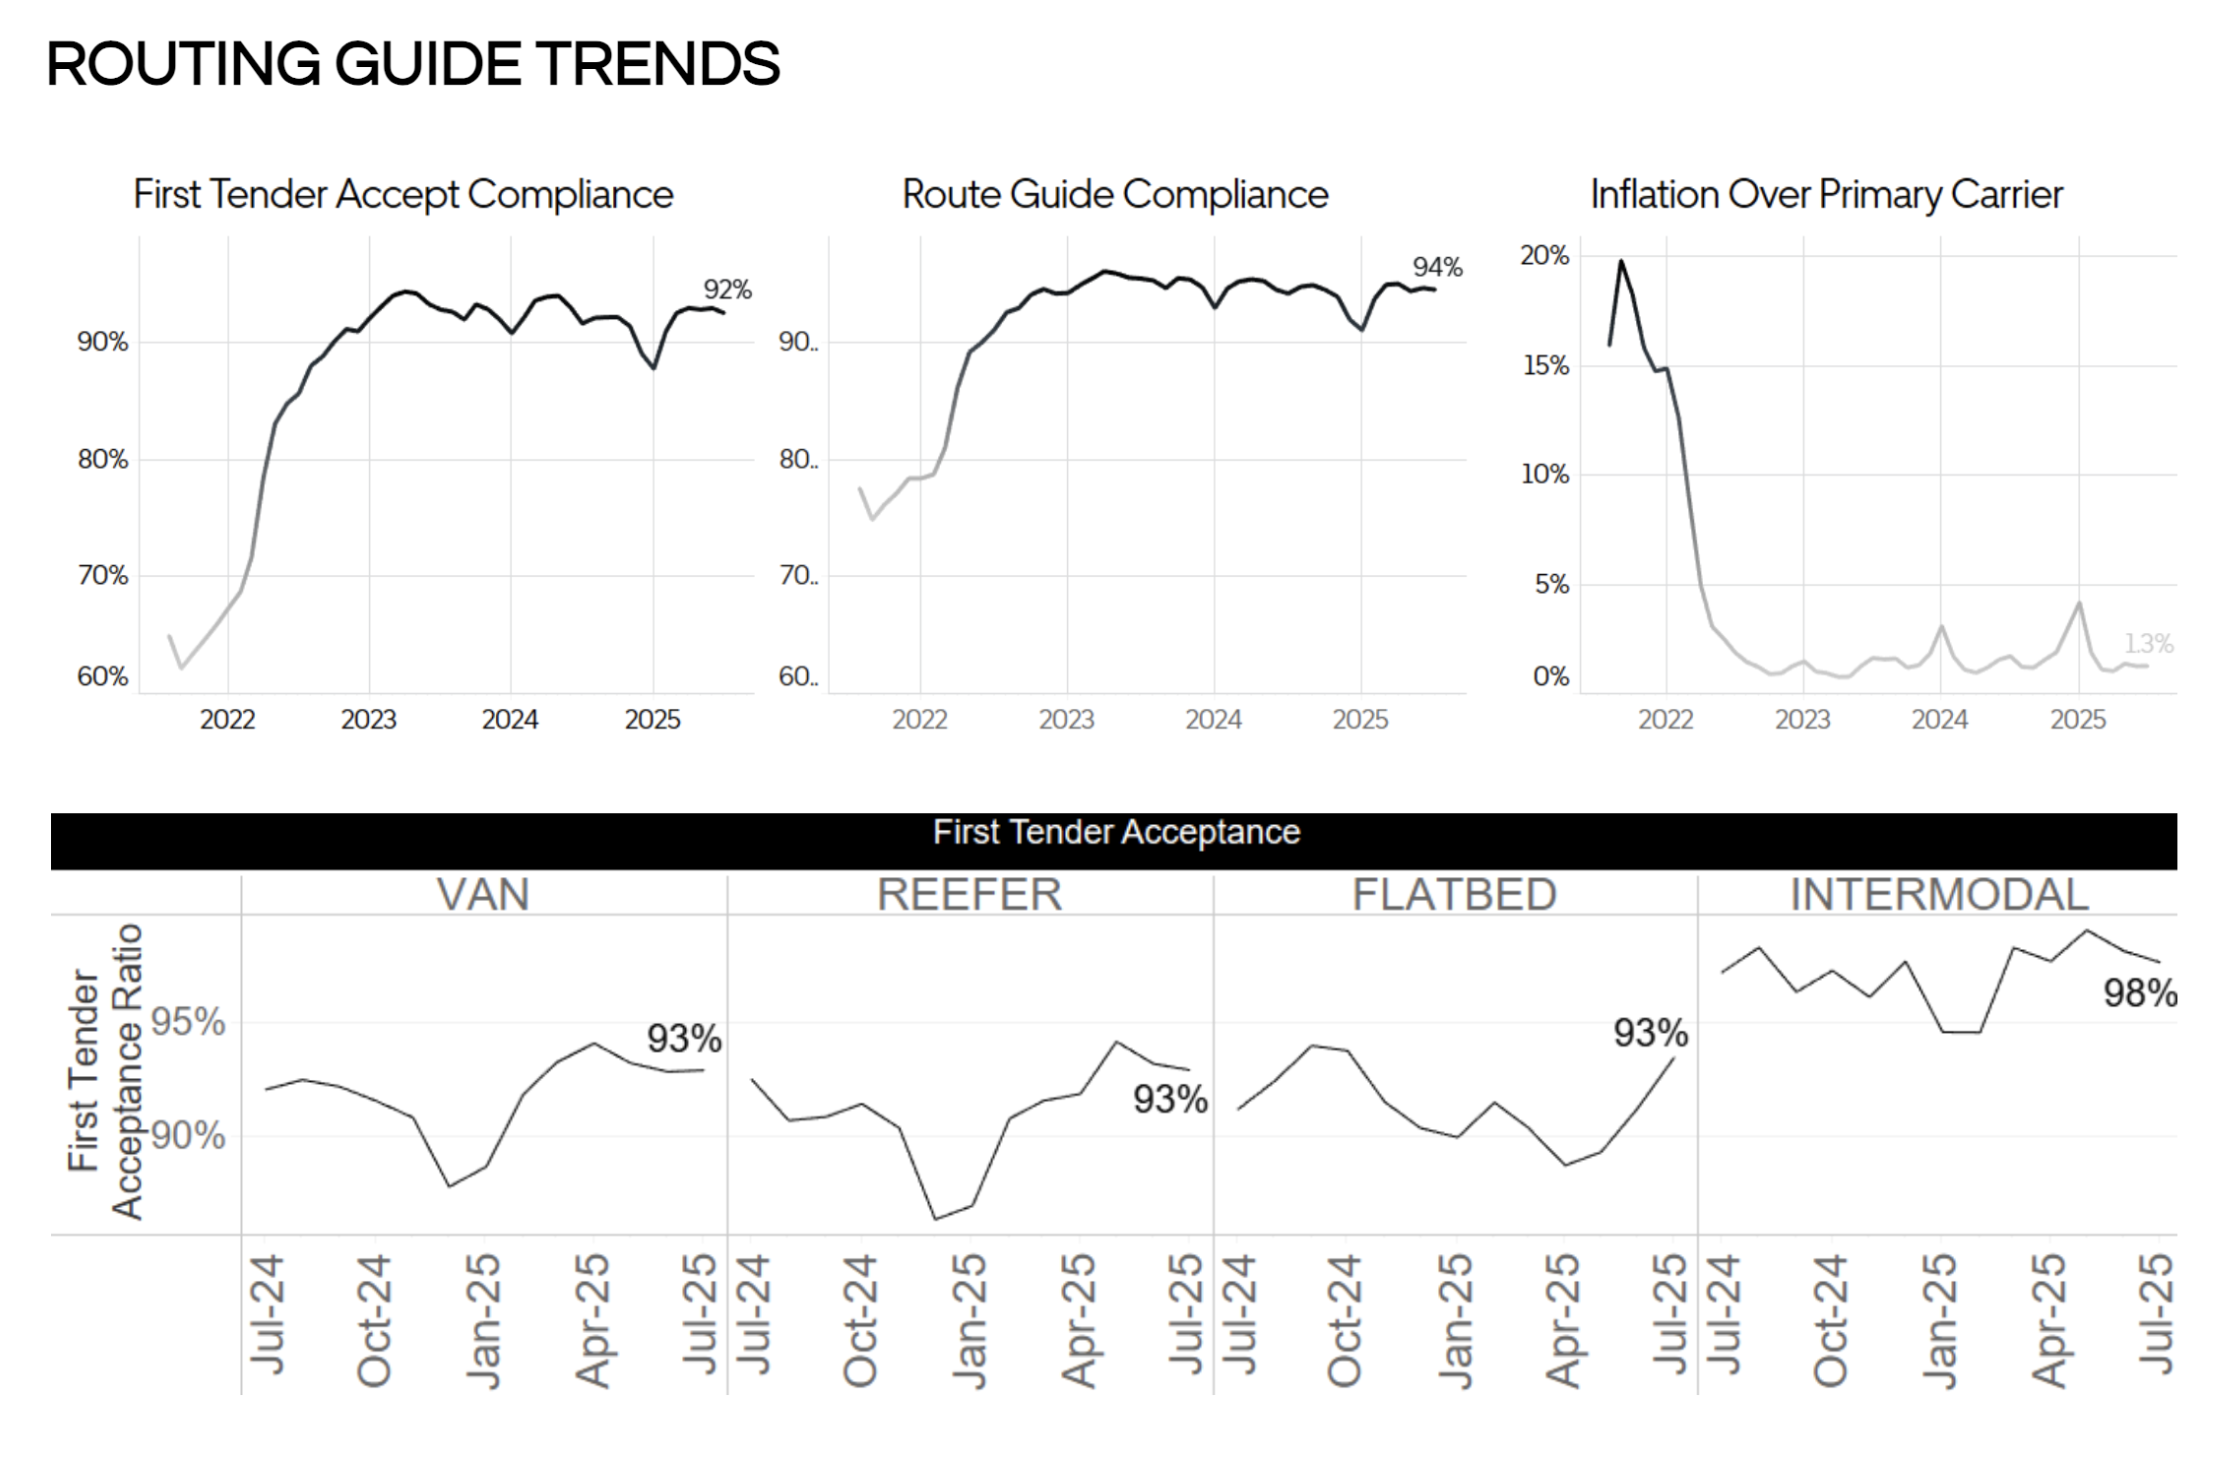
Route guide performance remained robust, defying seasonal expectations, indicating continued softness. The average First Tender Acceptance rate fell slightly to 92% in July, while Route Guide Compliance remained at 94%. This occurred despite expectations of tightening due to the summer produce season, which was apparently underwhelming this year. Costs over the primary carrier remained at 1.3%, indicating that routing guide failures, which are infrequent, are not impacting shippers' financials.
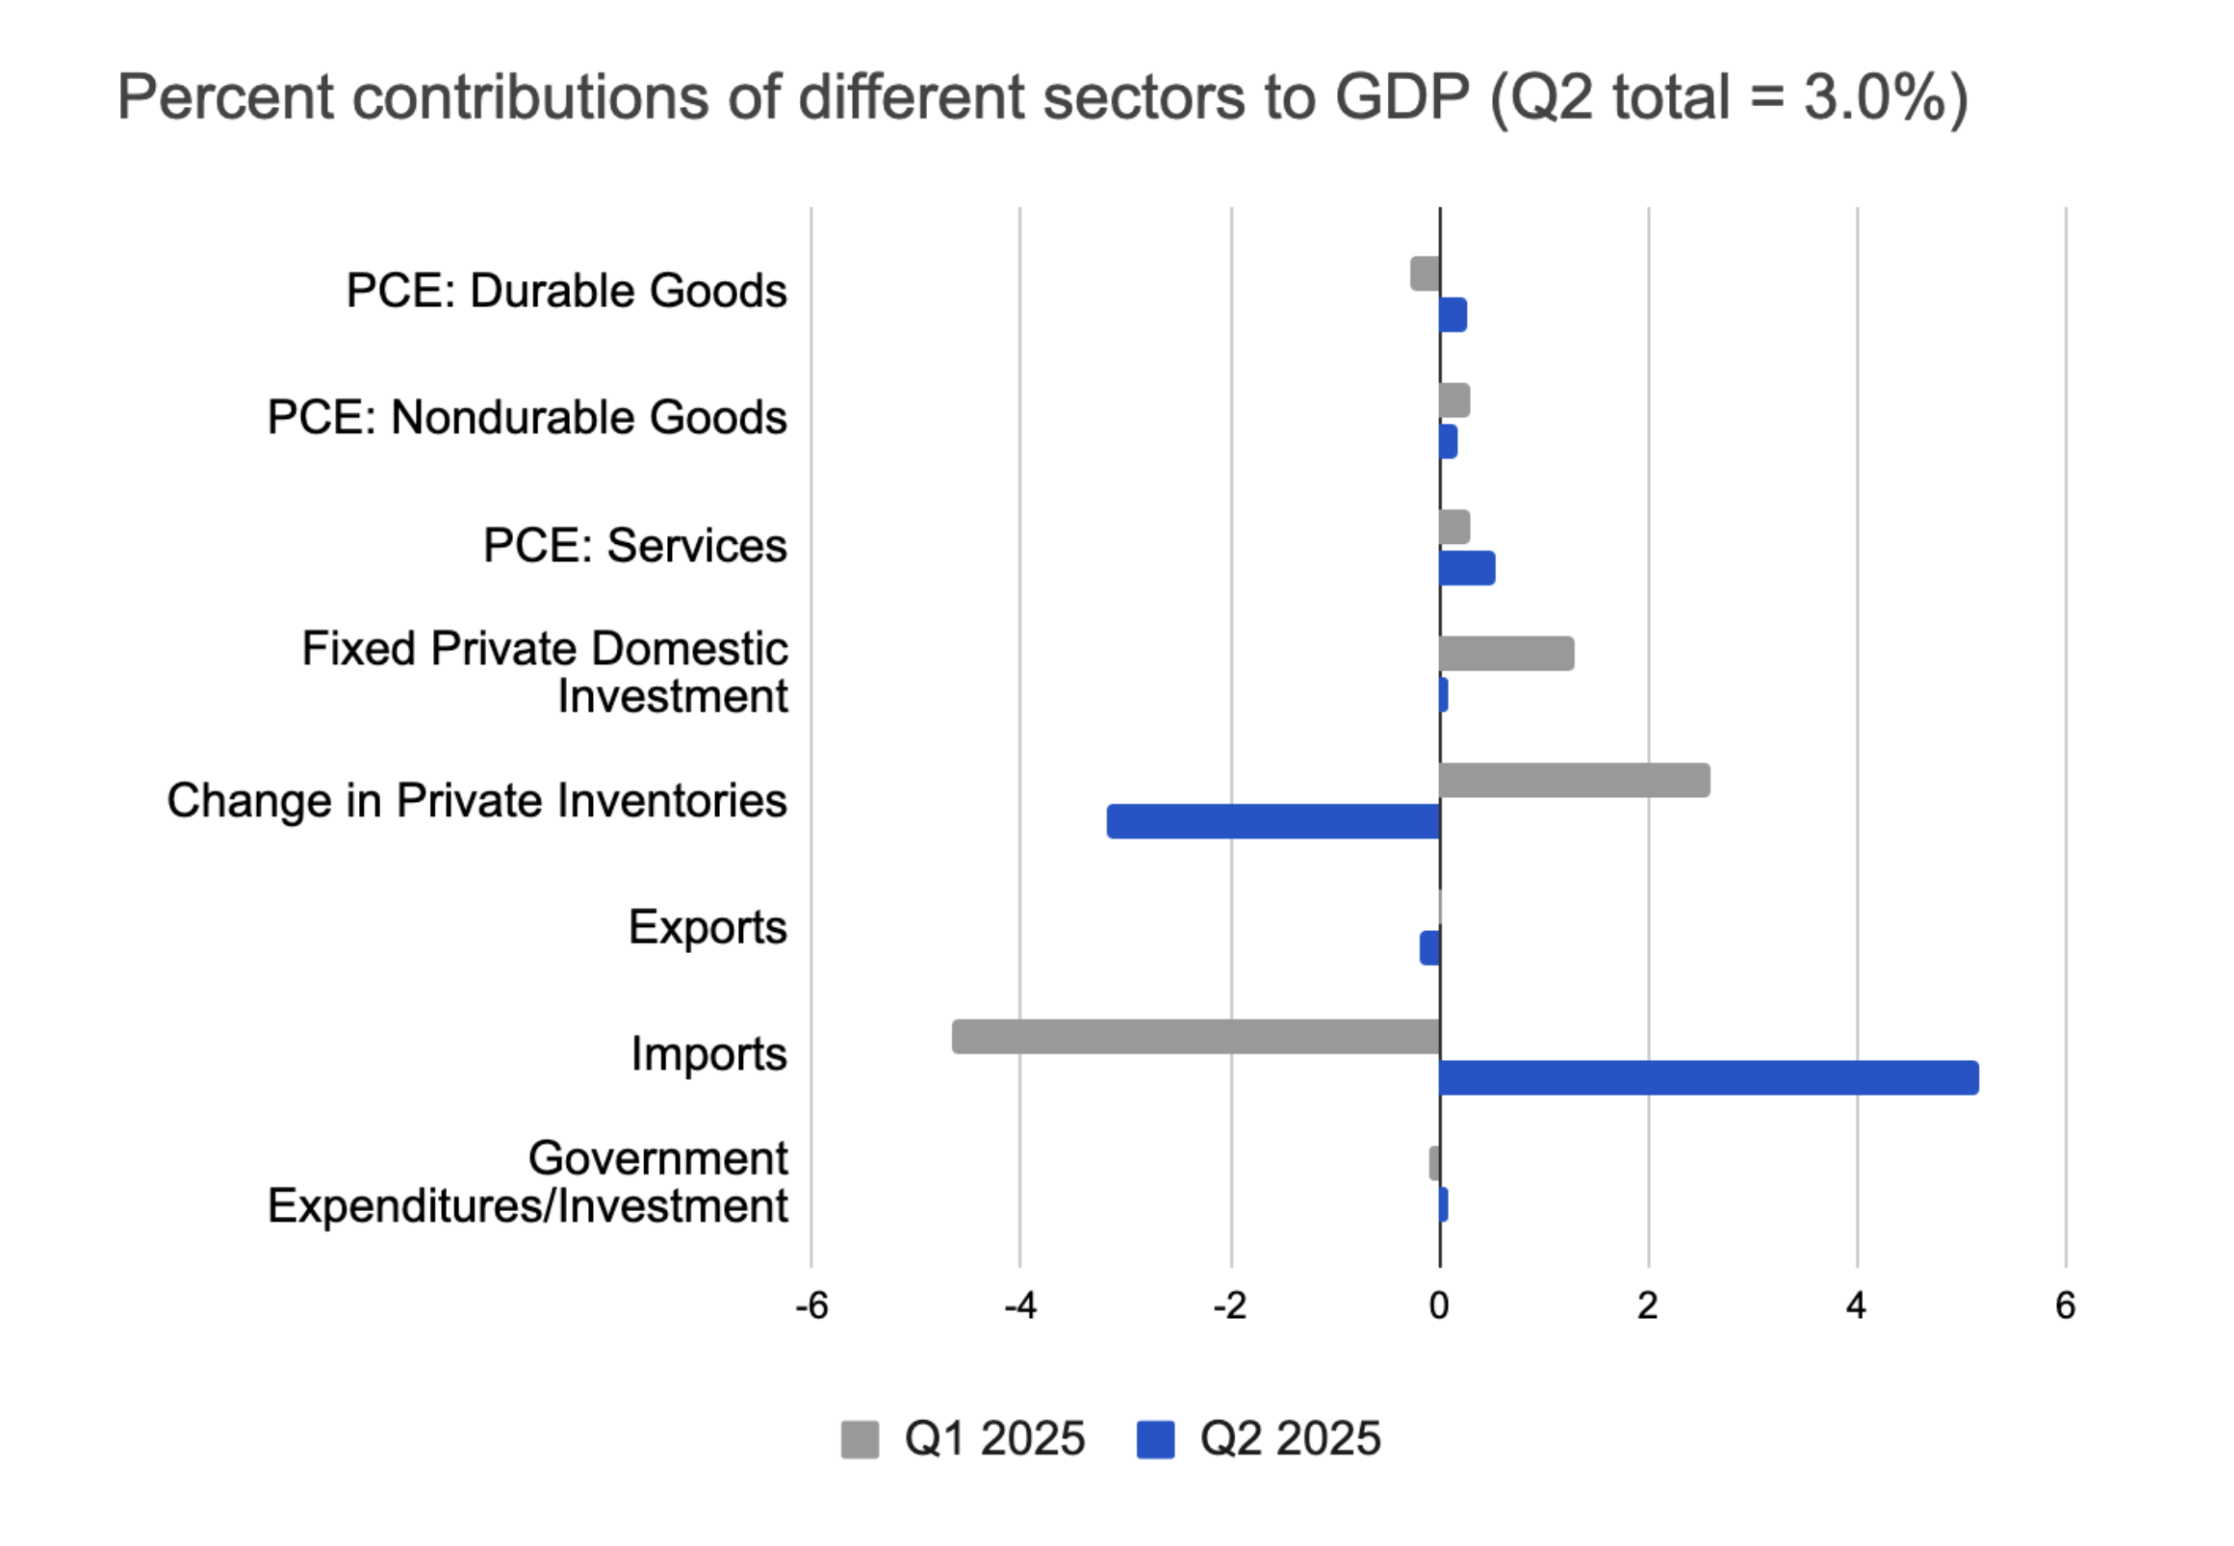
In the second quarter, real gross domestic product (GDP) increased by 3% on an annualized basis, a significant turnaround from the 0.5% decline in the previous quarter. This shift was largely influenced by changes in private inventories and imports.
In the first quarter, a surge in imports driven by pre-stocking ahead of new tariffs negatively impacted GDP. Since imports are subtracted when calculating GDP, this led to a substantial 4.7% reduction. This influx of goods, combined with a brief boost in manufacturing output, resulted in a 2.6% increase in private inventories during that period, partially offsetting the reduction caused by imports.
The trend reversed sharply in the second quarter. Once the tariffs were in effect, imports dropped significantly, contributing 5.2% to the quarter's GDP growth. However, this was coupled with a manufacturing slowdown, causing private inventories to shrink and subtract a negative 3.2% from GDP.
Executive
summary
U.S.
economy
Freight
demand
Freight
supply
U.S. GDP
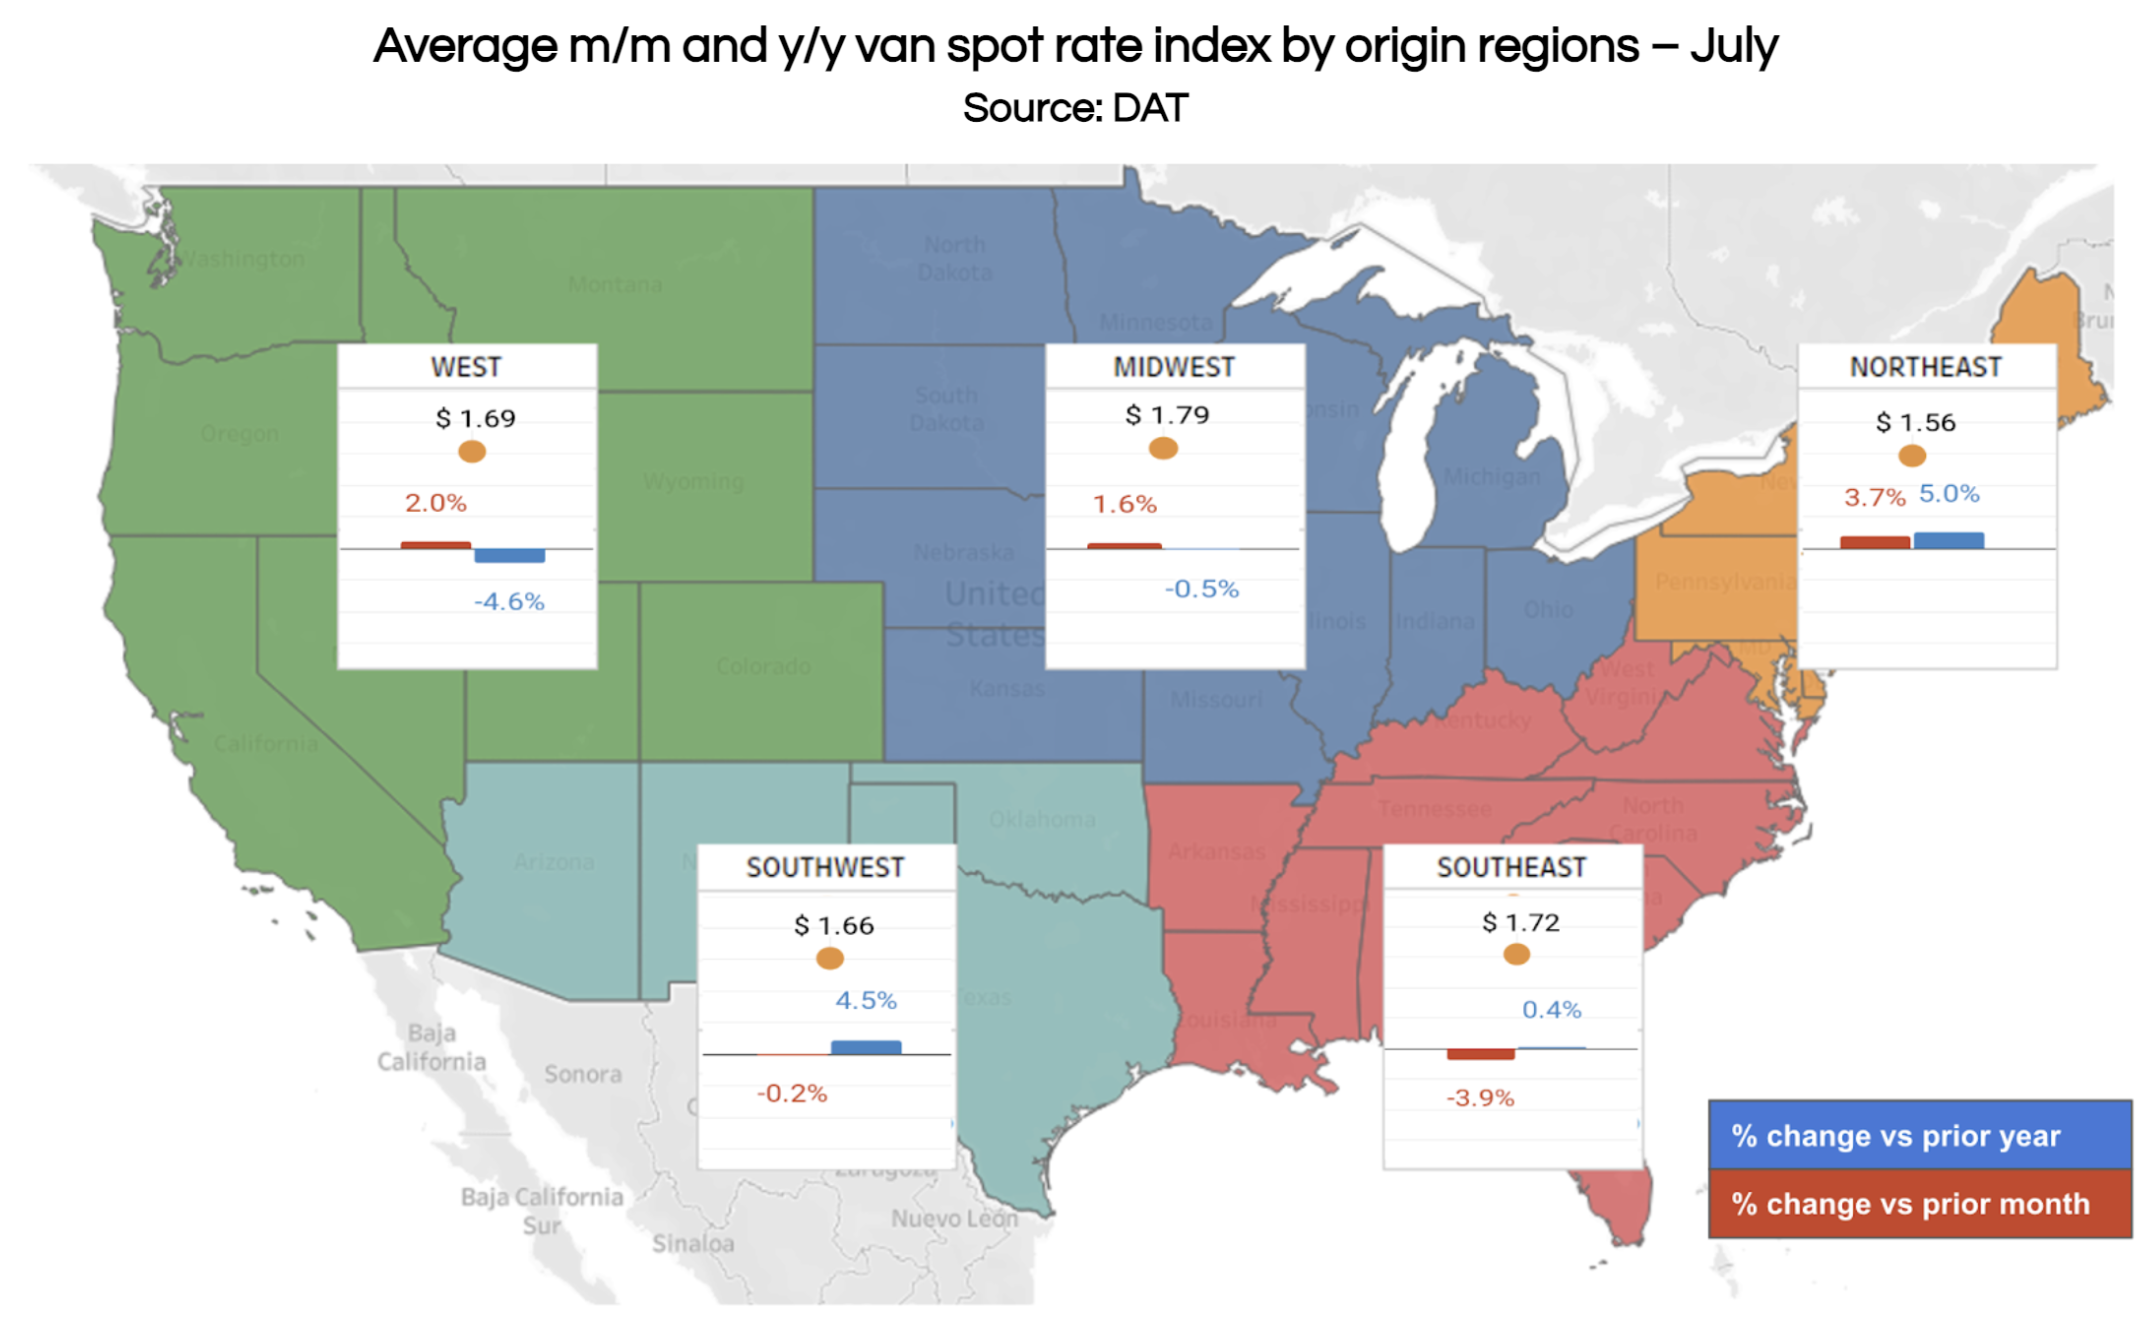
July's freight market was defined by seasonal patterns and the impact of the tariff pauses and deals. As the produce season ended, spot rates in the Southeast dropped 3.9% from June. Conversely, a surge in imports related to the tariff truce and peak season planning caused spot rates to rise in other key regions: 2% in the West and 3.7% in the Northeast. When compared to the same time last year, regional performance varied. The Southeast and Midwest markets were mostly flat, while the Northeast and Southwest saw rates increase by 5% and 4.5%, respectively. Meanwhile, the West region experienced a year-over-year decline of 4.6%, which could be attributed to imports slowing down in May and June.
Key data
points
Shipper and carrier insights
Is market tightness building beneath the surface?
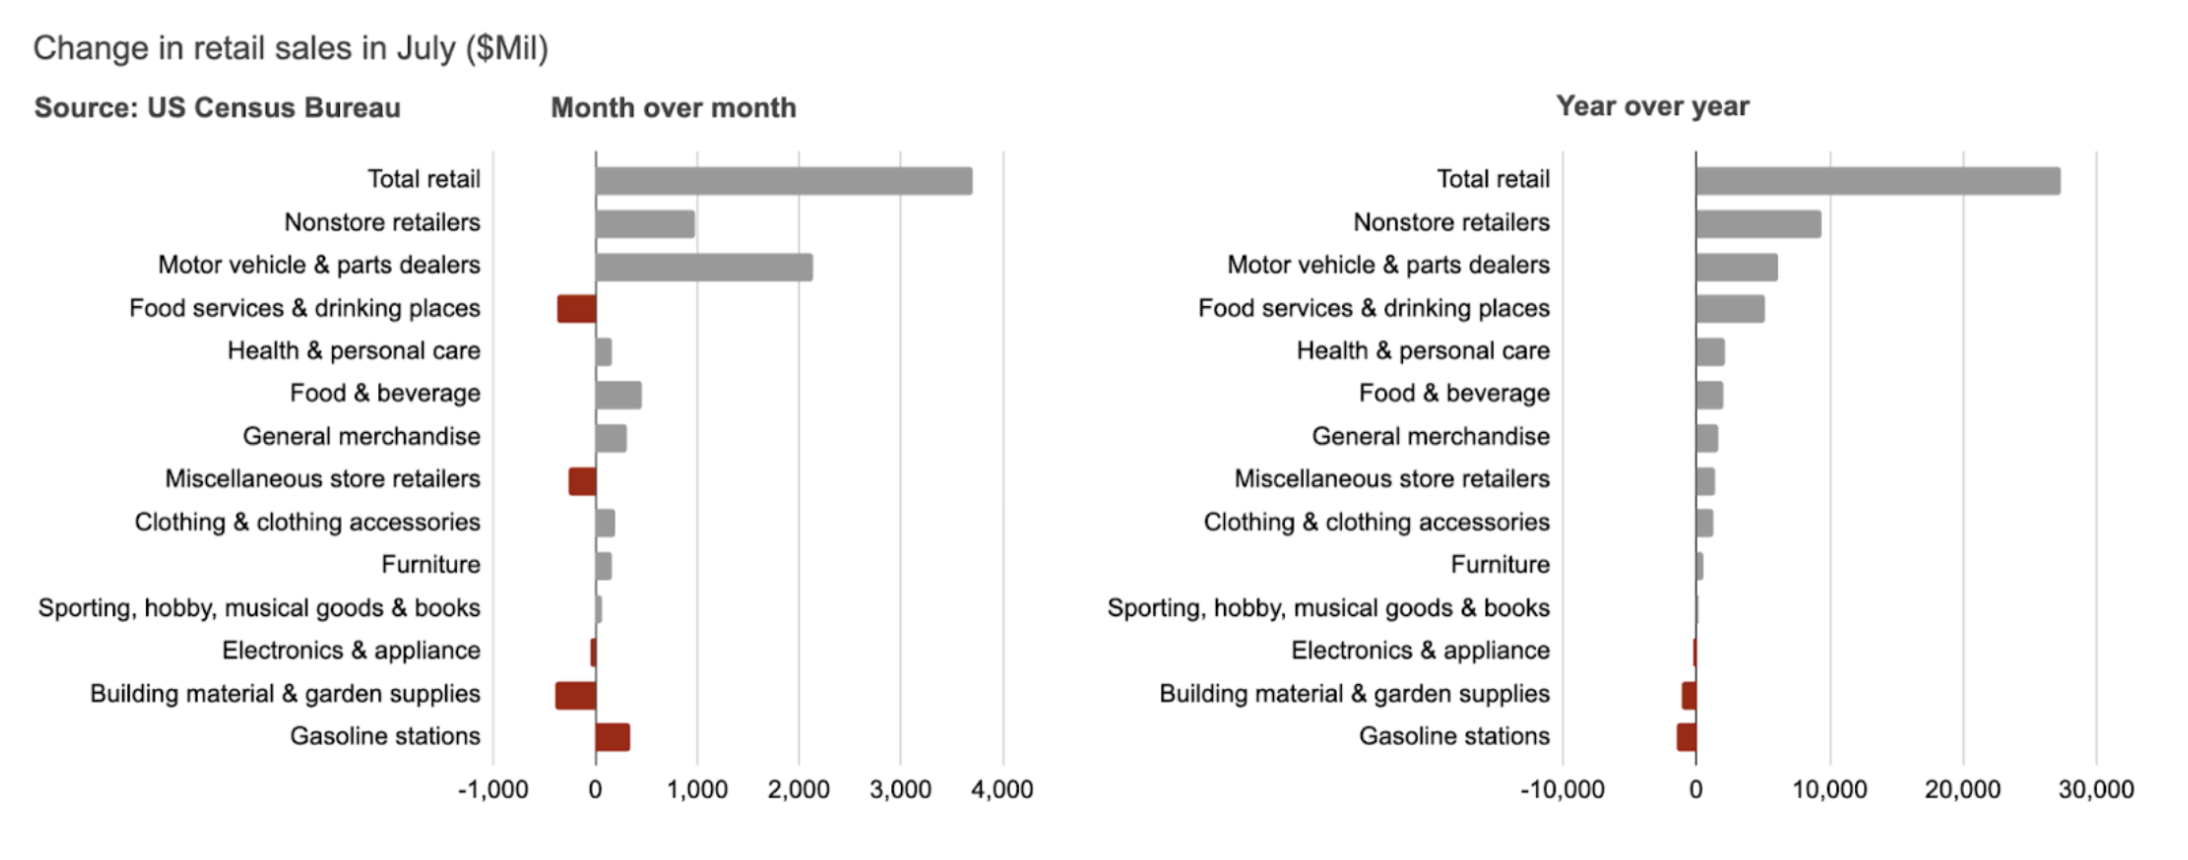
Consumer spending increased in July, but some sectors continued to struggle.
Retail and food services sales went up by 0.5%, a 3.9% increase from July 2024. This growth rate is consistent with the year-over-year trend observed since the second half of 2024. The primary drivers of July's growth were motor vehicles and parts and nonstore retailers (e-commerce).
However, some sectors continued to underperform both monthly and annually, including furniture, building materials and garden supplies, and appliances. These areas have been negatively affected by the stagnant U.S. real estate market, which has led to fewer home sales and a slowdown in related demand.
Labor Market

Truckload demand slowed in June after a pre-stocking surge.
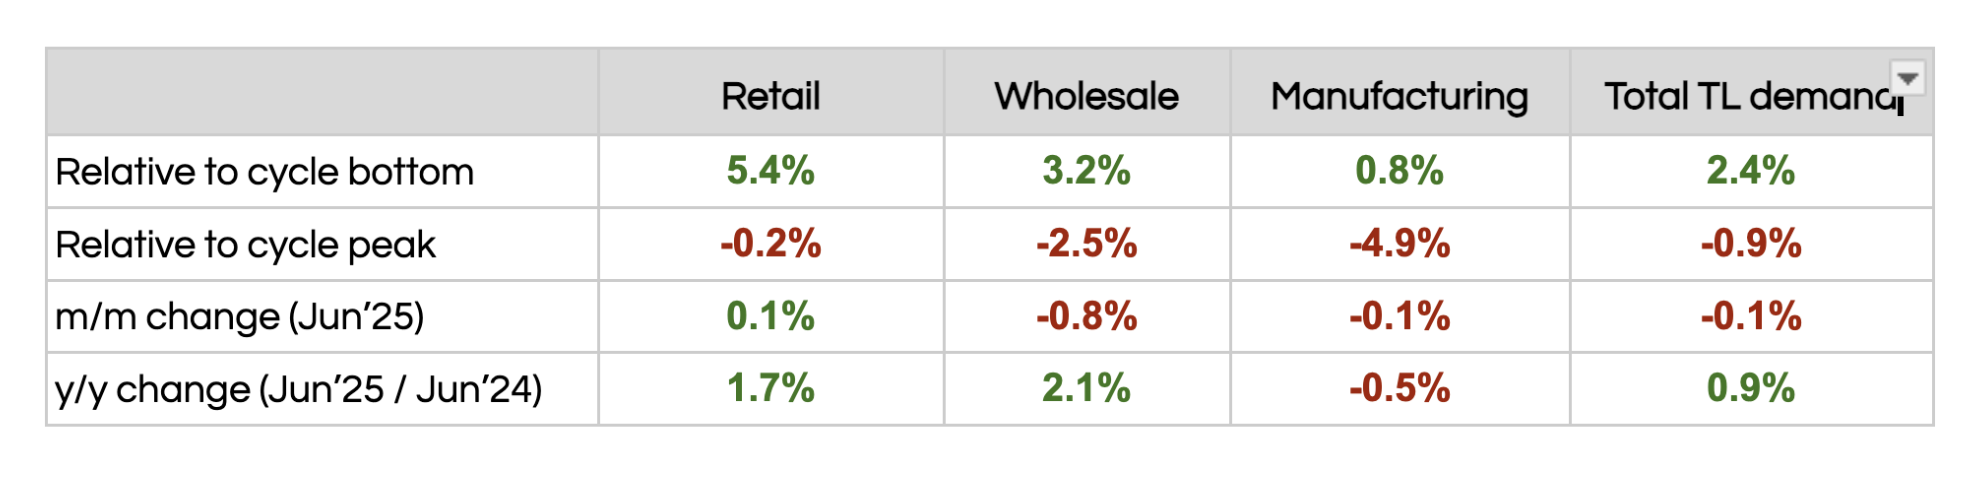
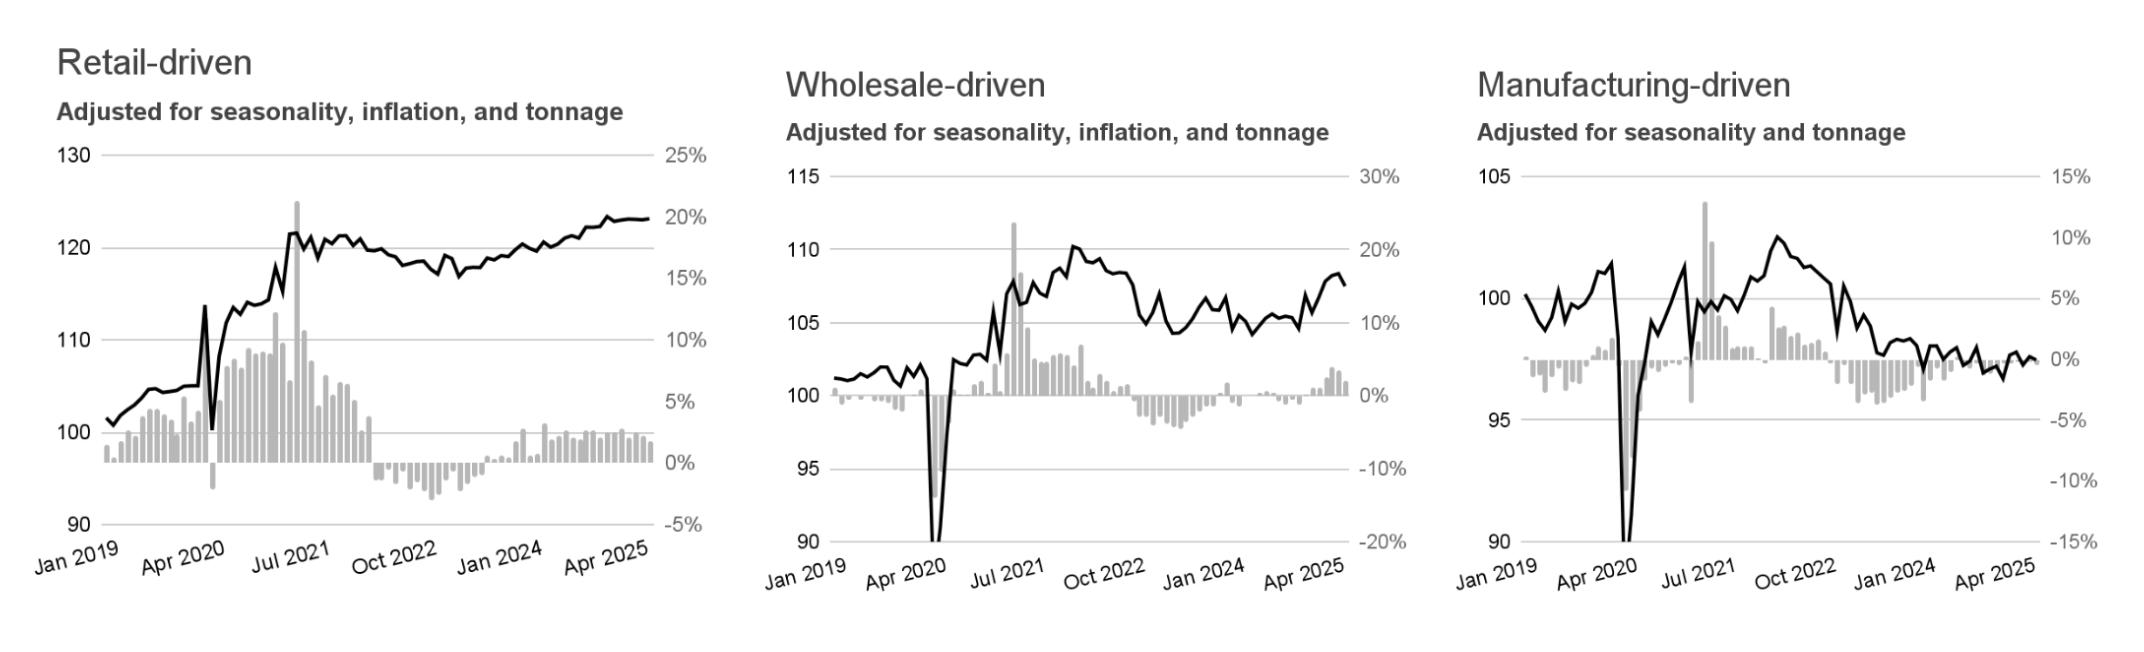
In June, truckload demand fell as the pre-stocking wave, which had boosted wholesale activity over the previous three months, began to subside. Consumer-driven demand remained relatively flat, rising a slight 0.1% and showing little change since February 2025. Meanwhile, wholesale demand dropped by 0.8%, and manufacturing-driven demand fell 0.1% during the month.
When compared to their year-ago levels, consumer demand was up 1.7% and wholesale demand was 2.1% higher, while manufacturing demand was 0.5% lower.


1/2
2/2
Tariffs, which are currently at their highest levels since the 1930s, have started driving inflation higher. The Producer Price Index (PPI), which tracks wholesale prices, rose a notable 0.9% in July—its highest month-over-month increase since March 2022—and reached 3.3% above last year's level. These factors, alongside a slowing job market, create significant headwinds for truckload demand despite a recent surge from pre-stocking.
1/3


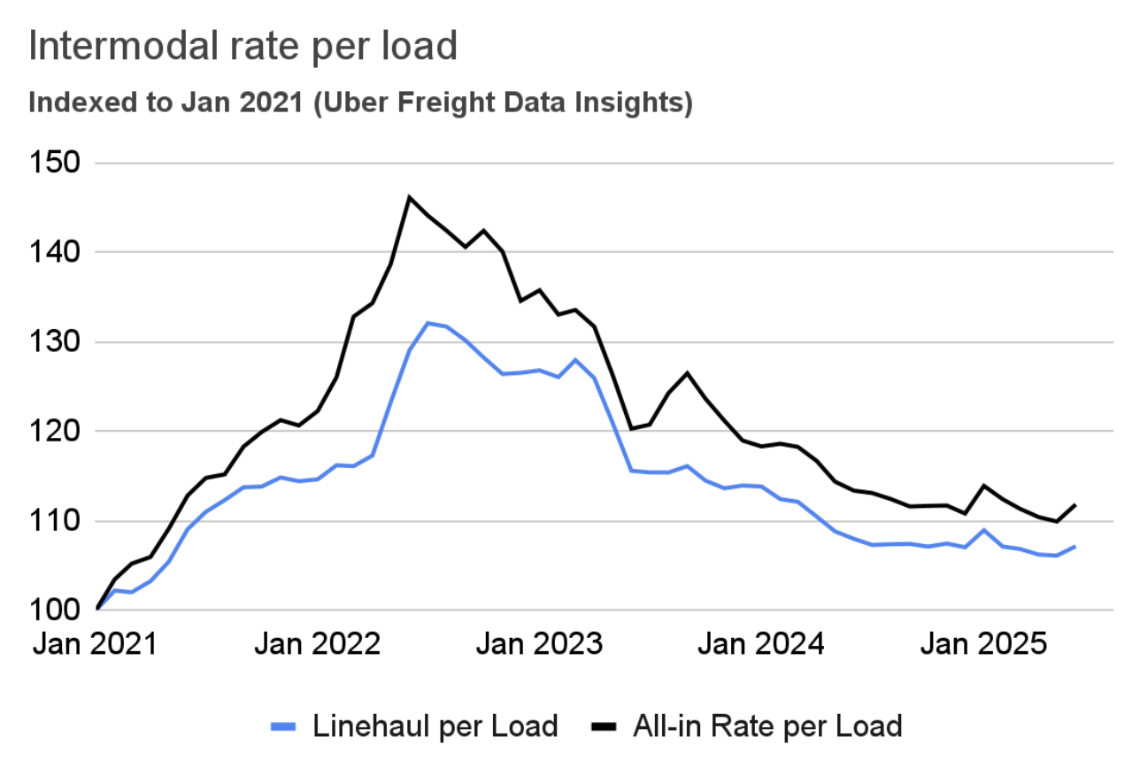
In July, linehaul intermodal rates experienced a modest 0.3% increase, according to Uber Freight's Intermodal Rate Index. The all-in rate per load, however, climbed higher by 1.3% month-over-month, primarily due to a rise in fuel prices. When compared to July 2024, both the rate per load and the all-in rate per load were essentially flat, showing an increase of just 0.1% year-over-year.
Shipper and carrier insights
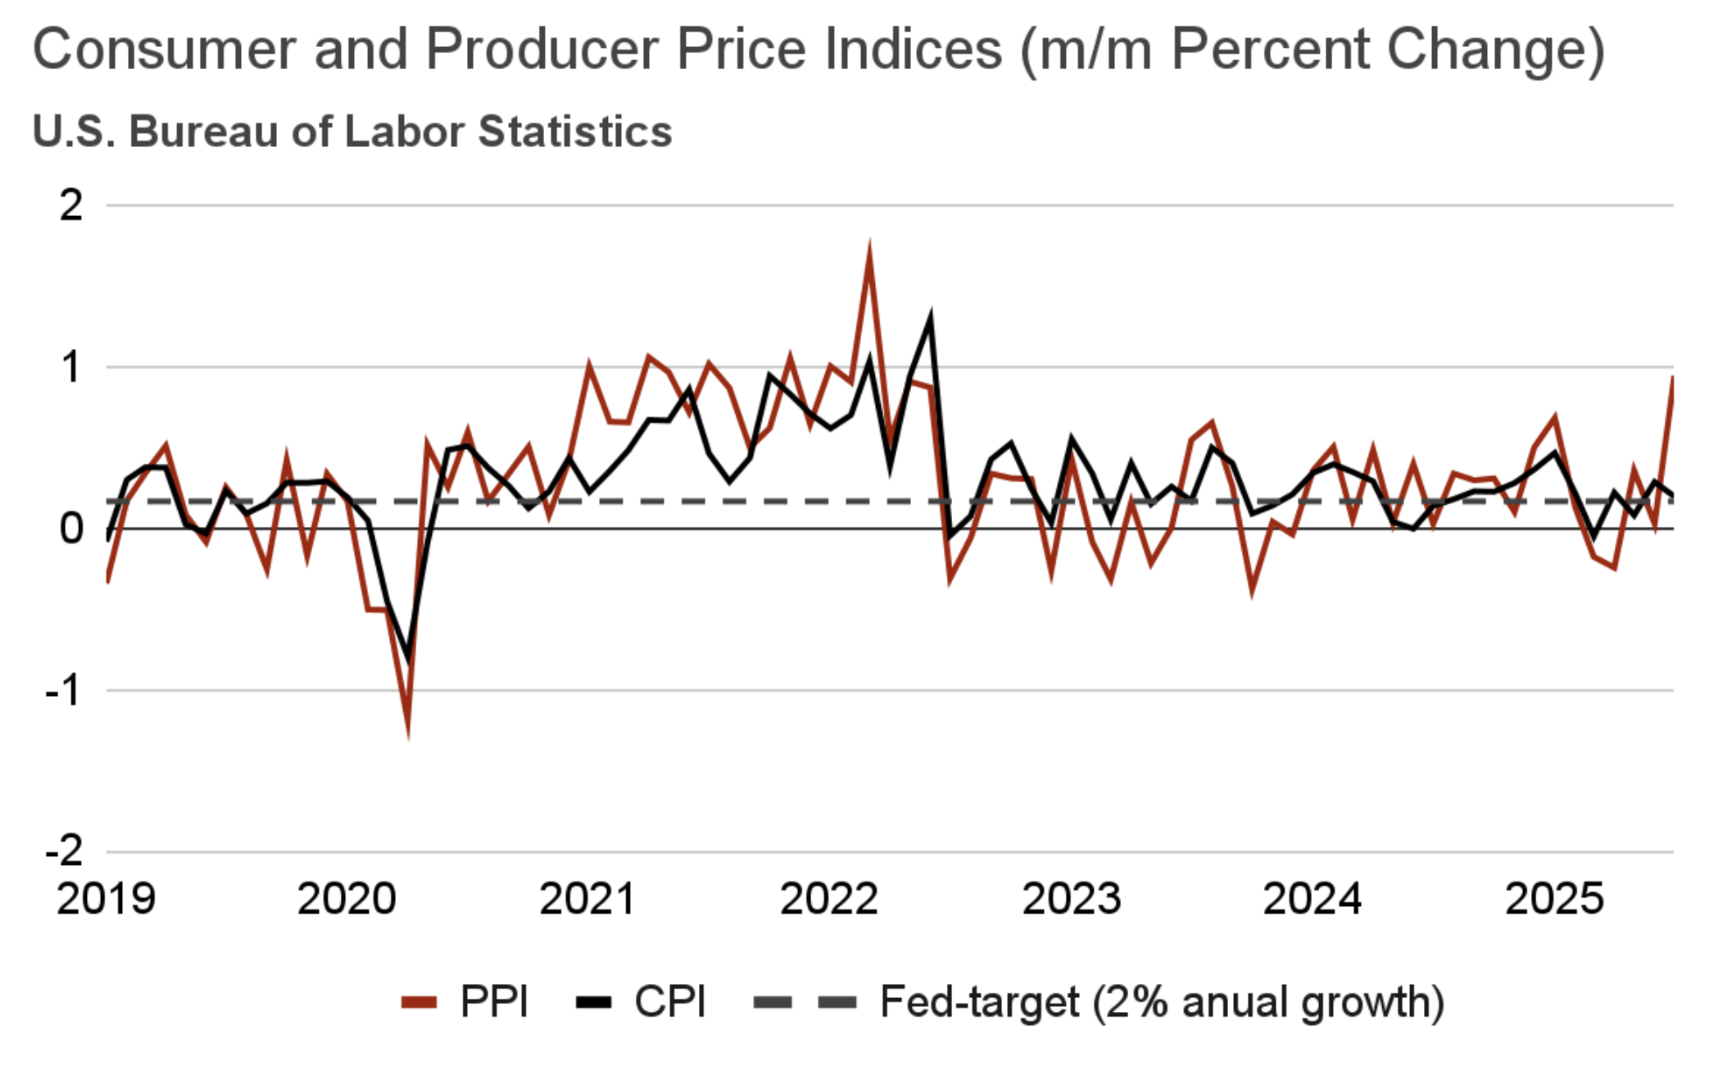
The Consumer Price Index (CPI) offered some short-lived relief this month, as it indicated that consumer prices had only increased by 0.2% in July. On a year-over-year basis, prices were 2.7% higher, similar to June's comparison.
However, this relief was brief, as the Producer Price Index (PPI), which measures wholesale prices, painted a different picture. Prices rose a significant 0.9% in July, the highest month-over-month increase since March 2022, and were 3.3% above the year-ago level. Since the PPI is a leading indicator of the CPI, this might suggest that inflation is once again a risk due to tariffs, even though it is not yet reflected in higher consumer prices.
The surge in July's PPI was primarily driven by food, where prices rose 1.4% and 4.2% year-over-year, and by trade services, where the PPI surged 2% in July and was 6.9% higher year-over-year.
Inflation
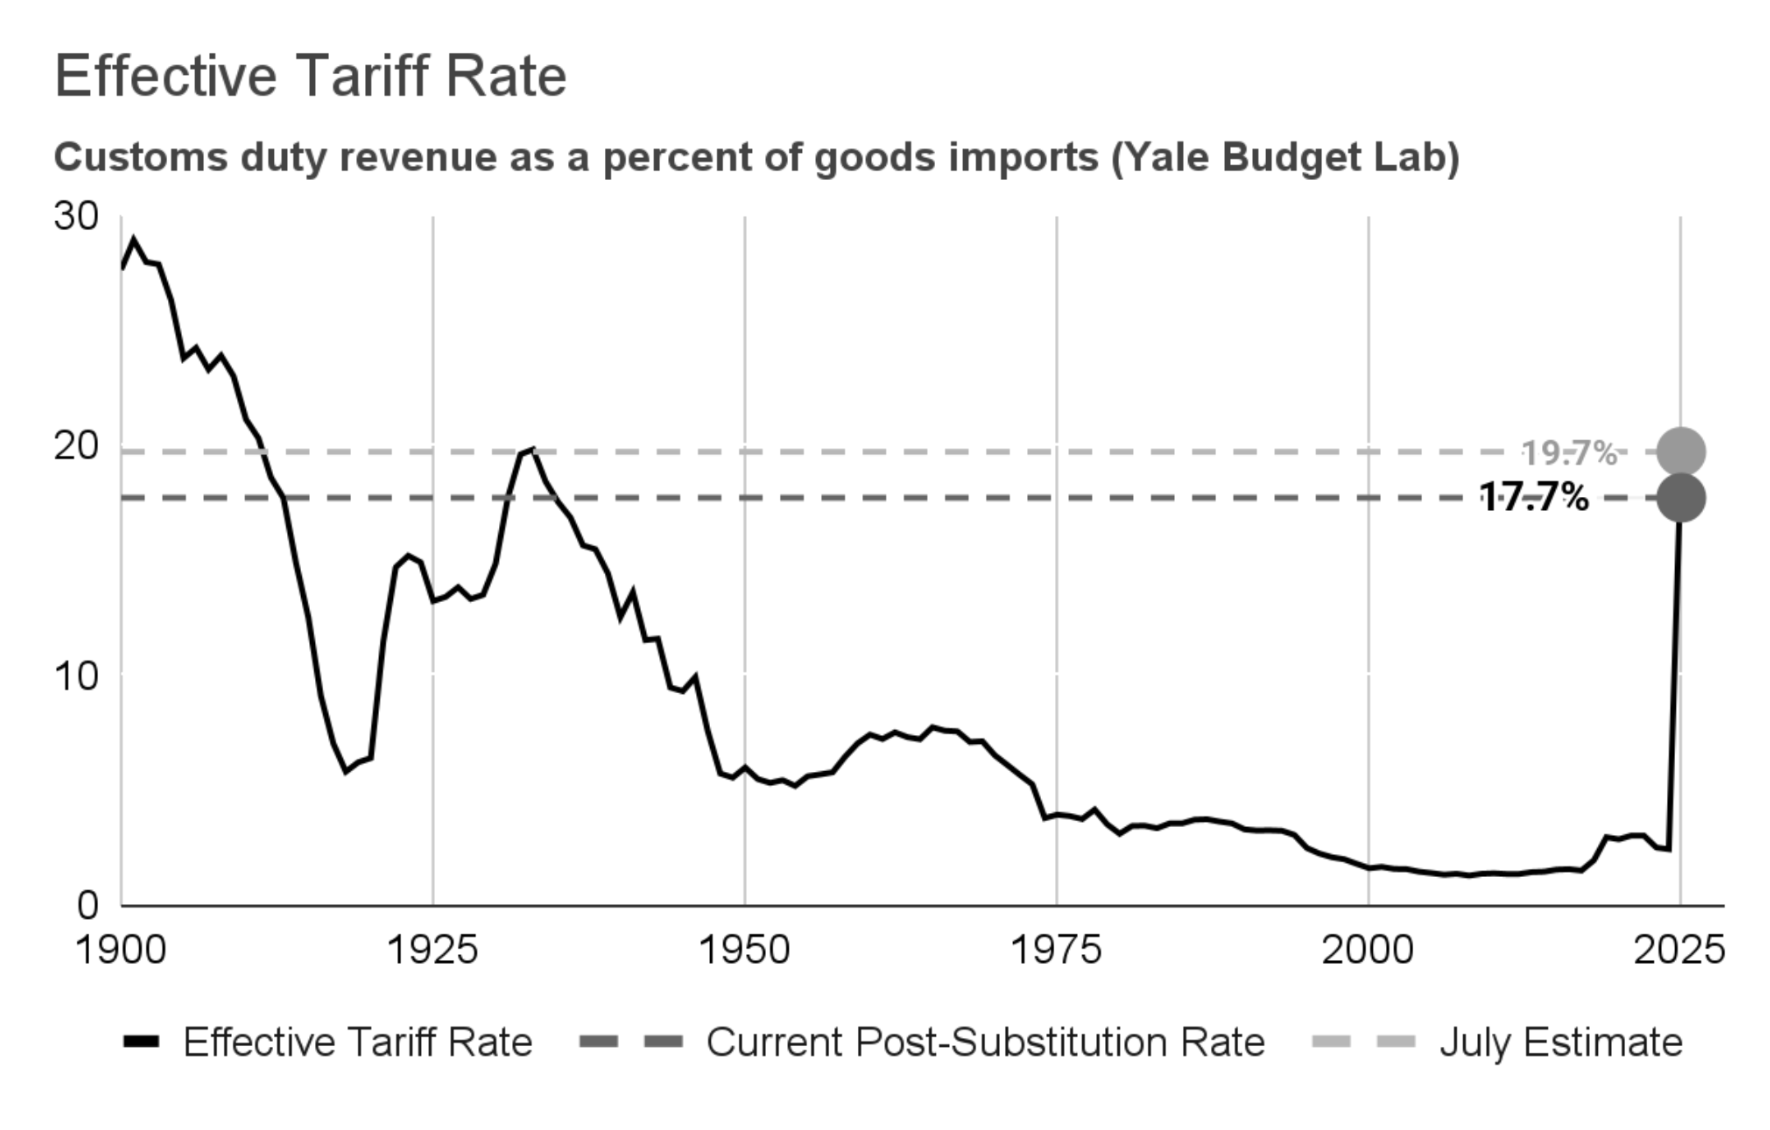
Consumers are currently facing an average effective tariff rate of 17.7%, the highest it has been since 1934, according to the Yale Budget Lab. These tariffs are expected to increase consumer prices by 1.5%, which translates to an average loss of $2,100 in household income.
Tariffs disproportionately impact certain industries. On the consumer side, the most affected sectors are clothing and textiles, followed by motor vehicles and parts. Industrially, the most impacted goods include metals, minerals, machinery, and electrical equipment.
While consumer price inflation remains in check, signs of inflation have started to emerge in the manufacturing and wholesale sectors, as seen in the ISM and Producer Price Index (PPI) data.
Tariffs


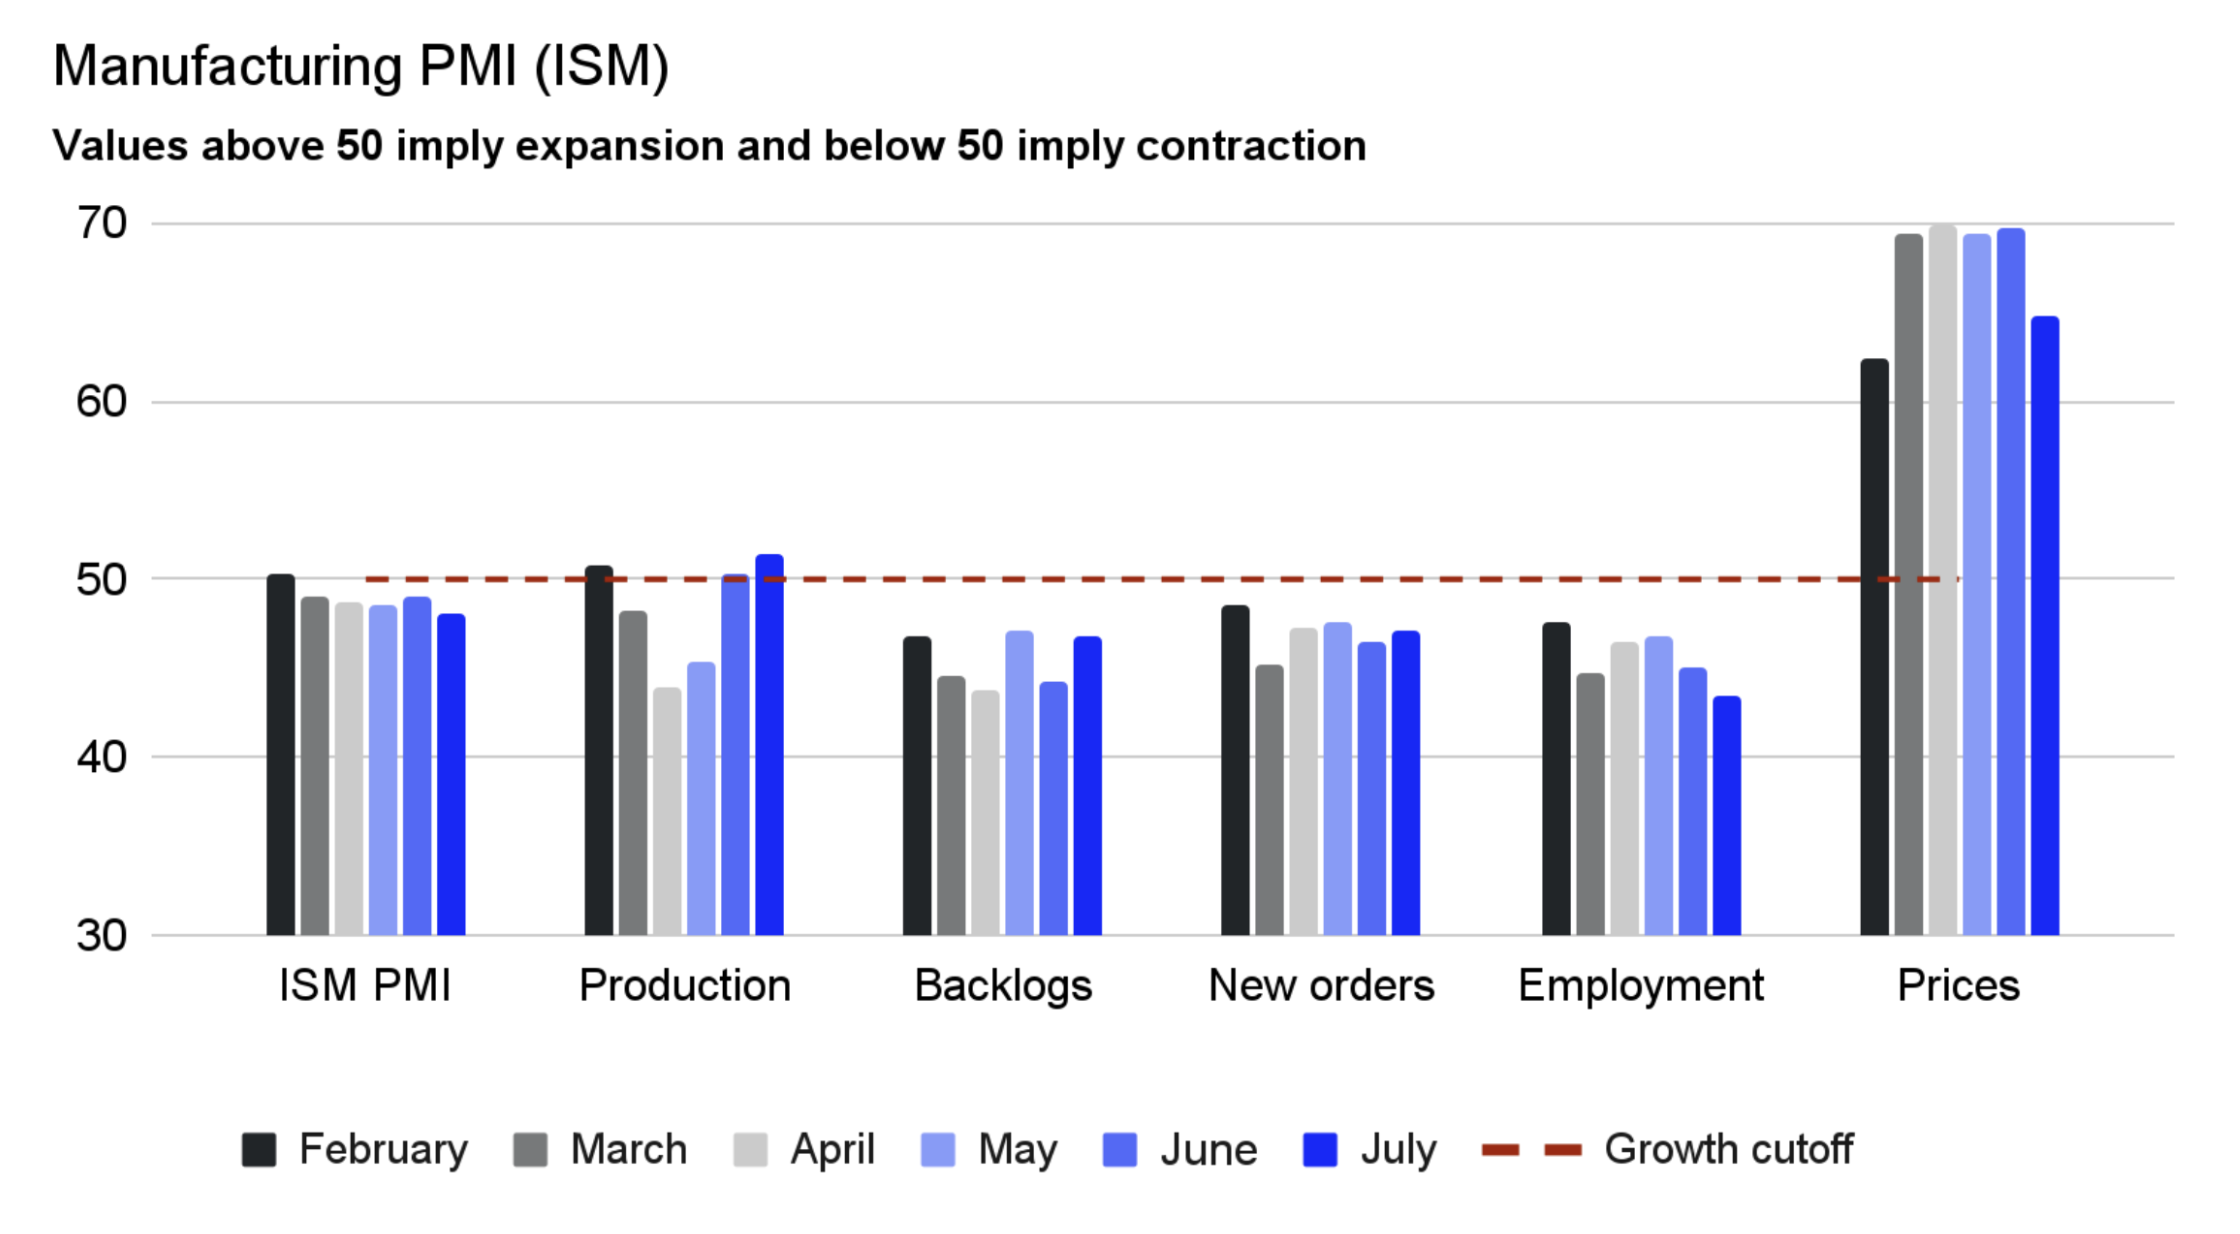
The U.S. manufacturing sector contracted further in July.
The Institute for Supply Management (ISM) Purchasing Managers' Index (PMI) for July fell to 48.0, signaling that the manufacturing sector is still contracting. While the Production index remained in expansion for the second consecutive month, the indices of Backlogs and New Orders were in contraction, suggesting weaker future demand.
The Prices Index fell, but remained significantly above 50.0, indicating that manufacturers are still facing inflation. Meanwhile, the Employment Index fell to 43.5, suggesting accelerating layoffs in the sector.
The portion of the manufacturing GDP that contracted grew to 79% in July, a significant increase from 46% in June. Furthermore, the percentage of GDP experiencing a strong contraction—defined by a composite PMI of 45 or lower—rose to 31% in July, up from 25% the previous month, according to ISM.
Manufacturing
Freight supply
Spot and
contract rates

Tractor
Orders

Supply and demand indices

Driver
employment

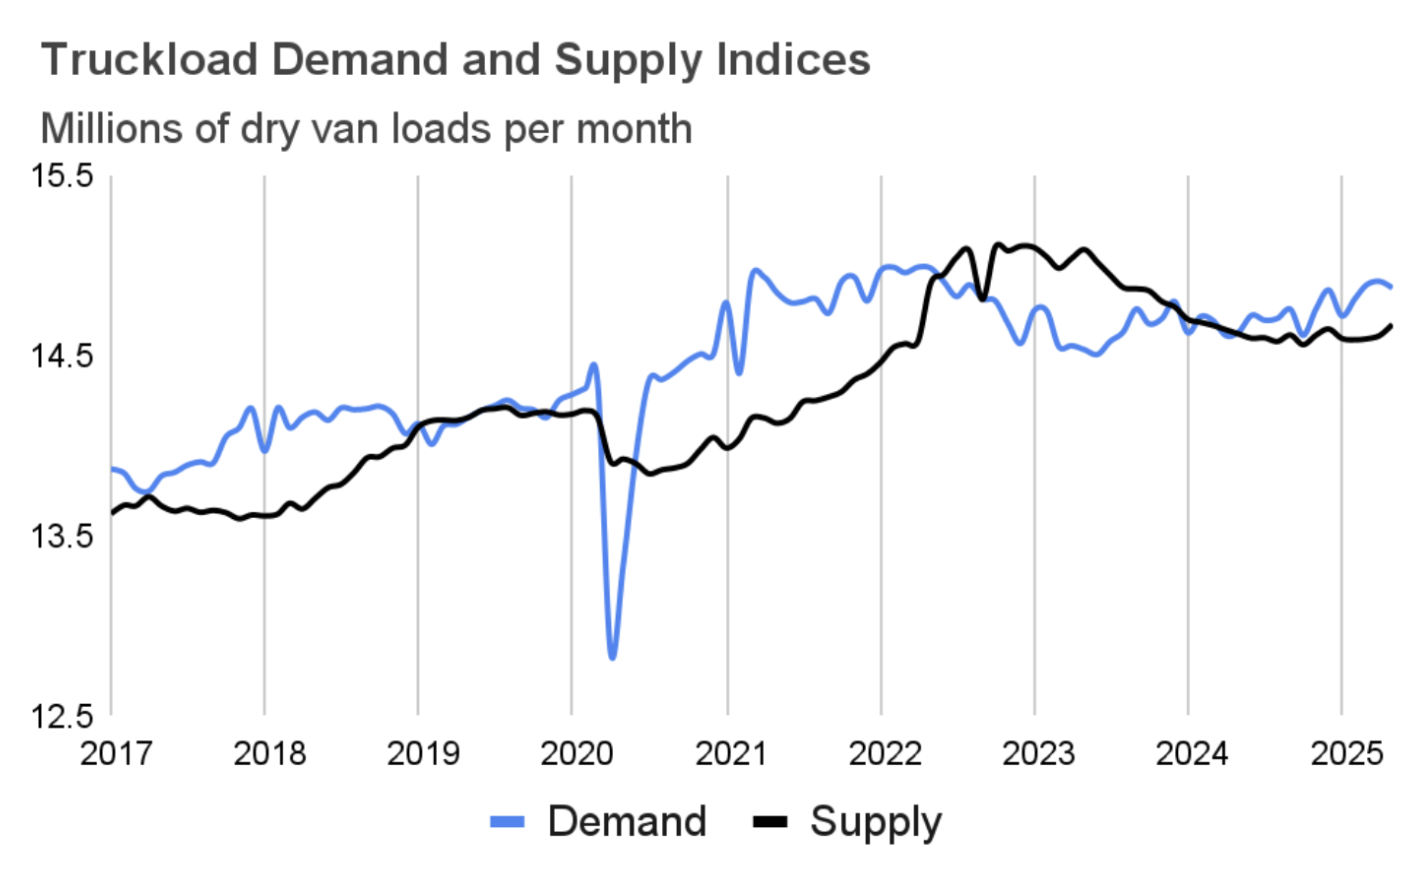
In June, truckload demand saw a 0.1% decrease, a result of a slowdown in wholesale activity after a recent surge driven by pre-stocking. Despite the monthly dip, demand remained 0.9% above levels from the previous year.
Meanwhile, truckload supply also dropped by 0.3%. This decline was due to fewer long-distance trucking jobs and slower tractor sales. Supply was nearly flat compared to the previous year, showing only a 0.2% increase.
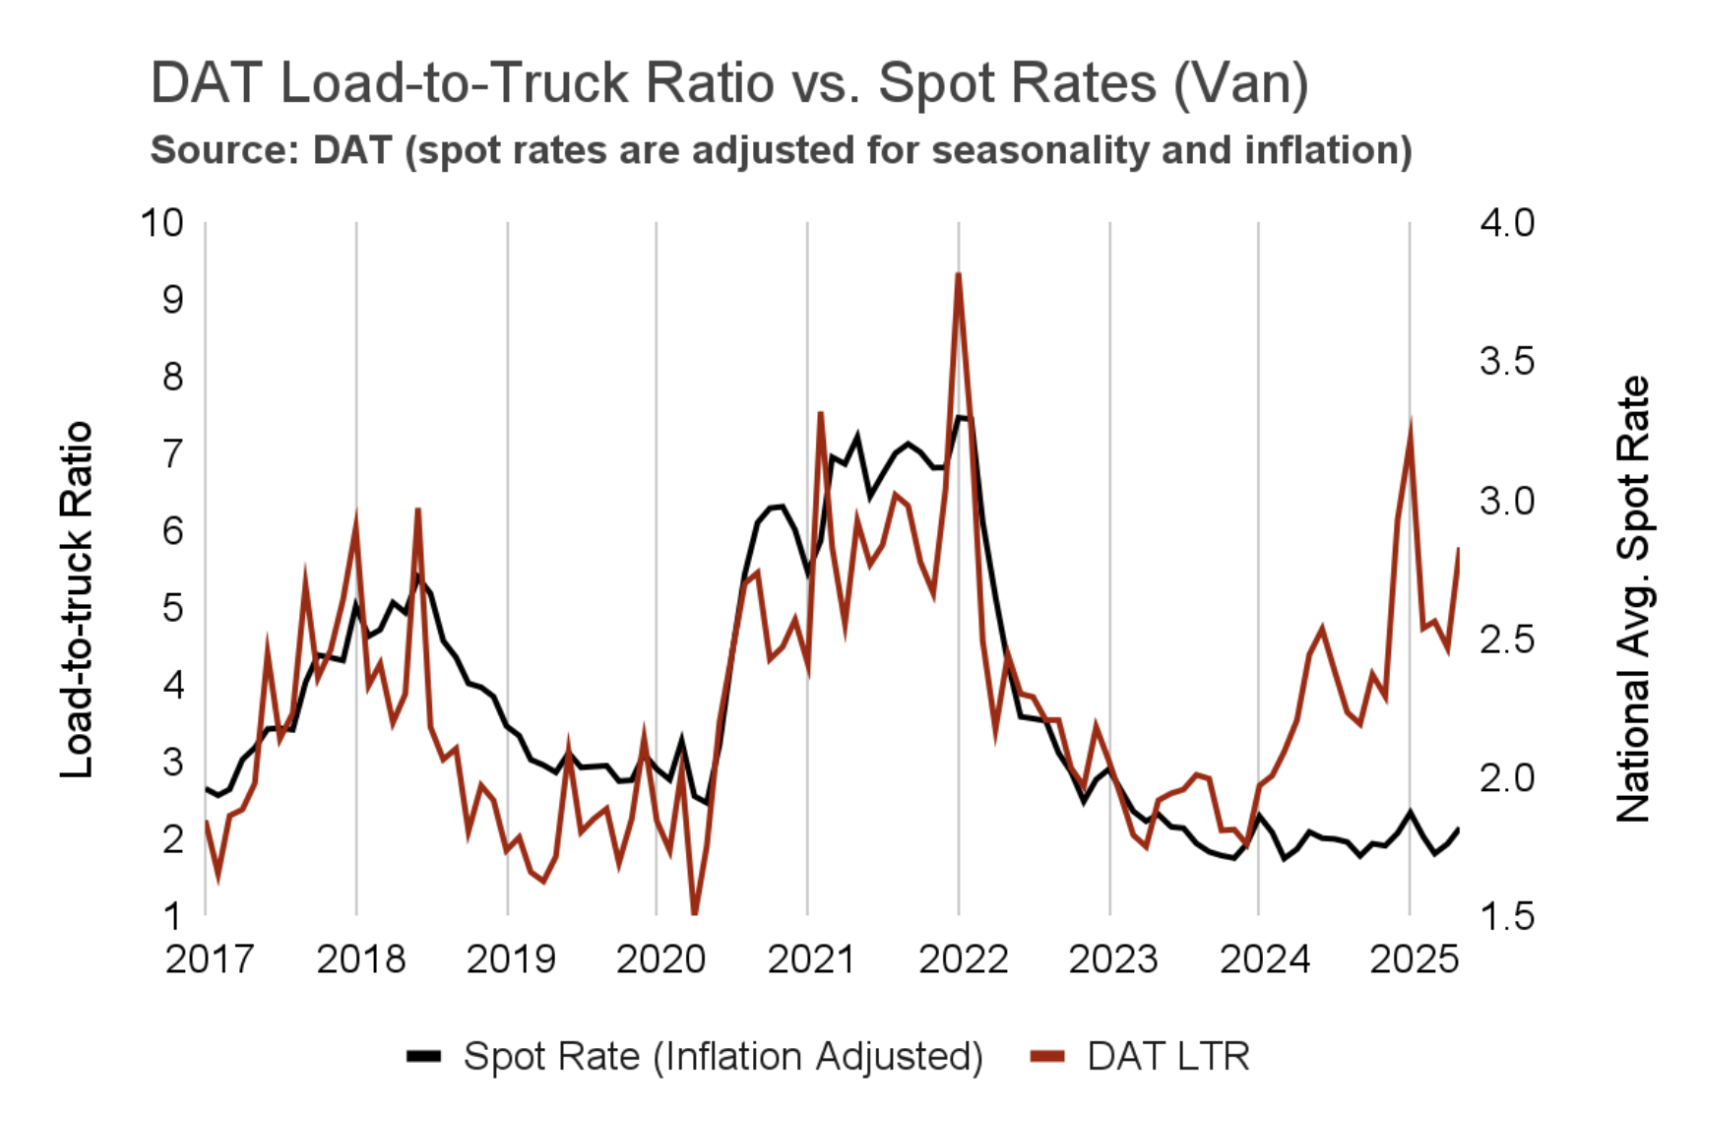
Overall, the market is experiencing tightening capacity as pre-stocking has caused demand to significantly outpace supply. Other key indicators, like DAT's load-to-truck ratio and FTR's truck utilization index, also rose, further supporting this trend. However, this tightening might be temporary, and has not yet led to an increase in rates.
Truckload supply and demand indices
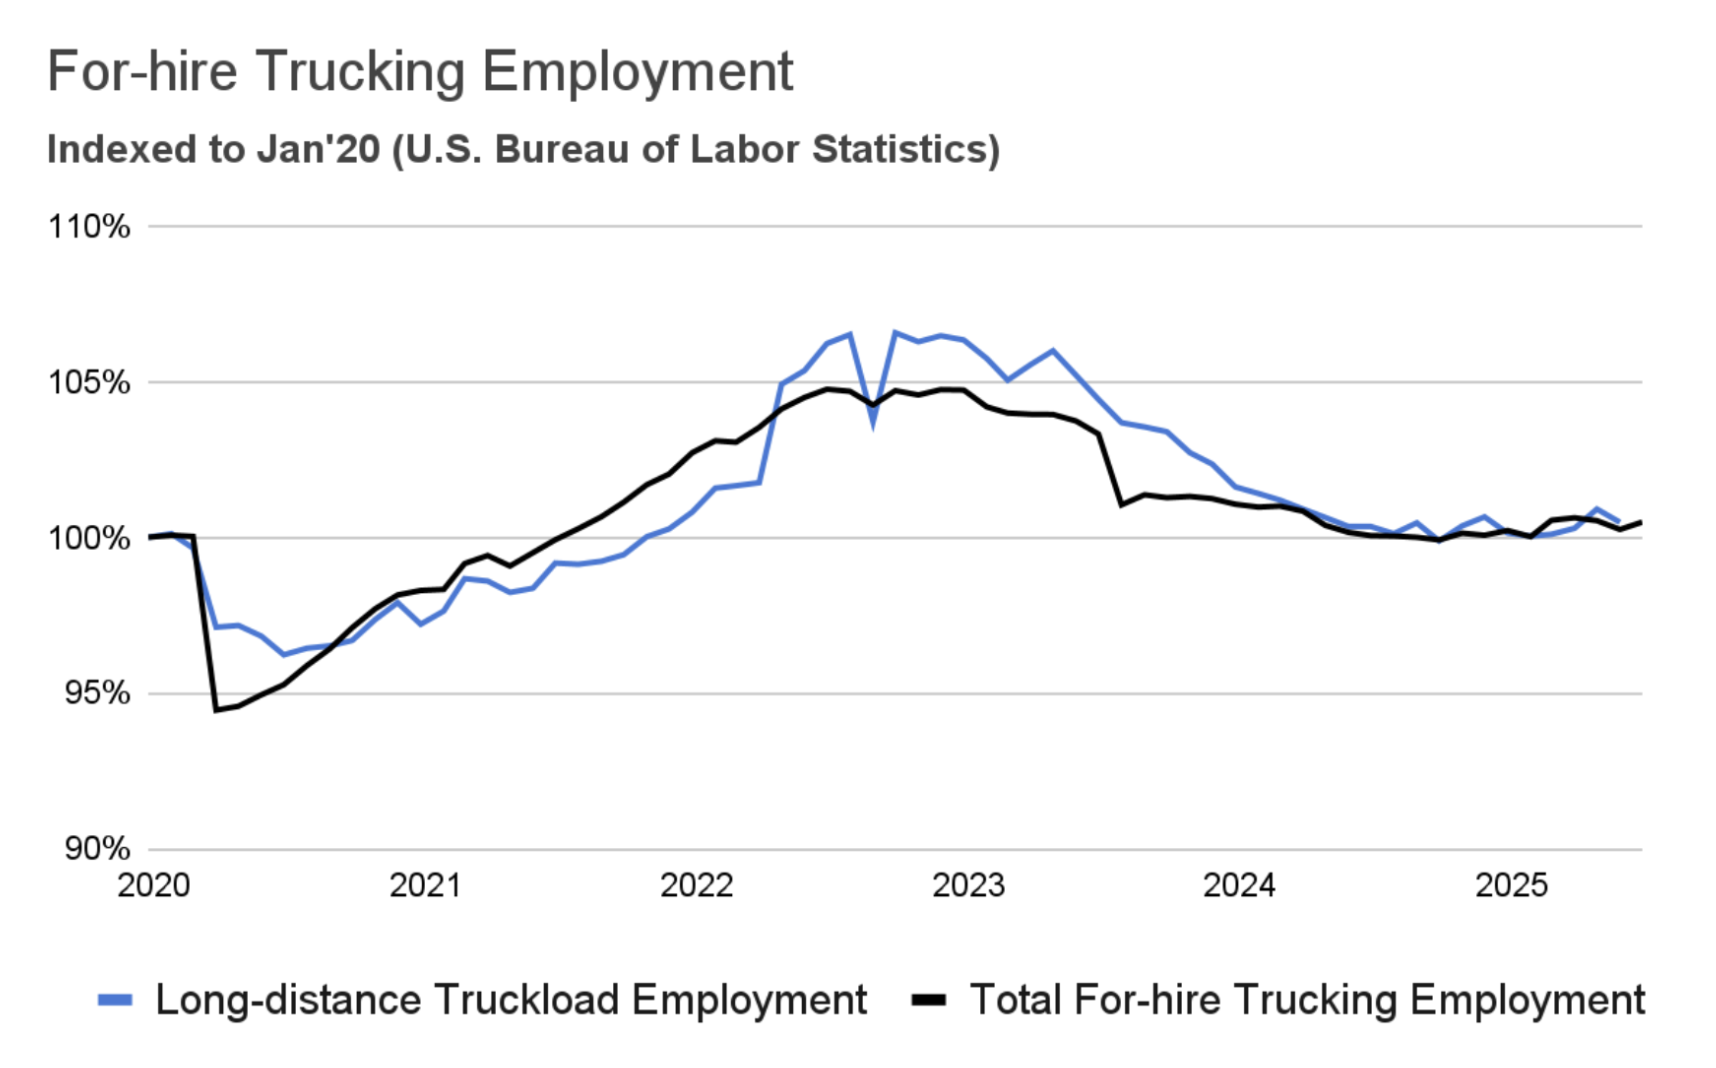
Trucking employment continued to move sideways, remaining near the 2019 levels.
In July, the trucking industry added 3,600 jobs, rebounding from a loss of 4,300 jobs in June. Overall, trucking employment was 0.4% higher year-over-year. July’s change appears to be within the typical month-over-month fluctuations rather than a consistent trend. Looking at specific sectors, long-distance truckload employment fell by 2,200 jobs in June, nearly offsetting May's gains, and the LTL sector saw little change.
Uber Freight estimates that current trucking operating costs still exceed spot rates by about 20% and even slightly surpass contract rates. This suggests that carrier margins are largely disappearing. In this soft market, carriers have little leverage with shippers but are attempting to exert what leverage they have with drivers. According to the same BLS report, the average hourly compensation for long-distance truckload drivers fell by 1.5% year-over-year in June, compared to a 3.9% y/y increase in other sectors across the economy.
Driver employment
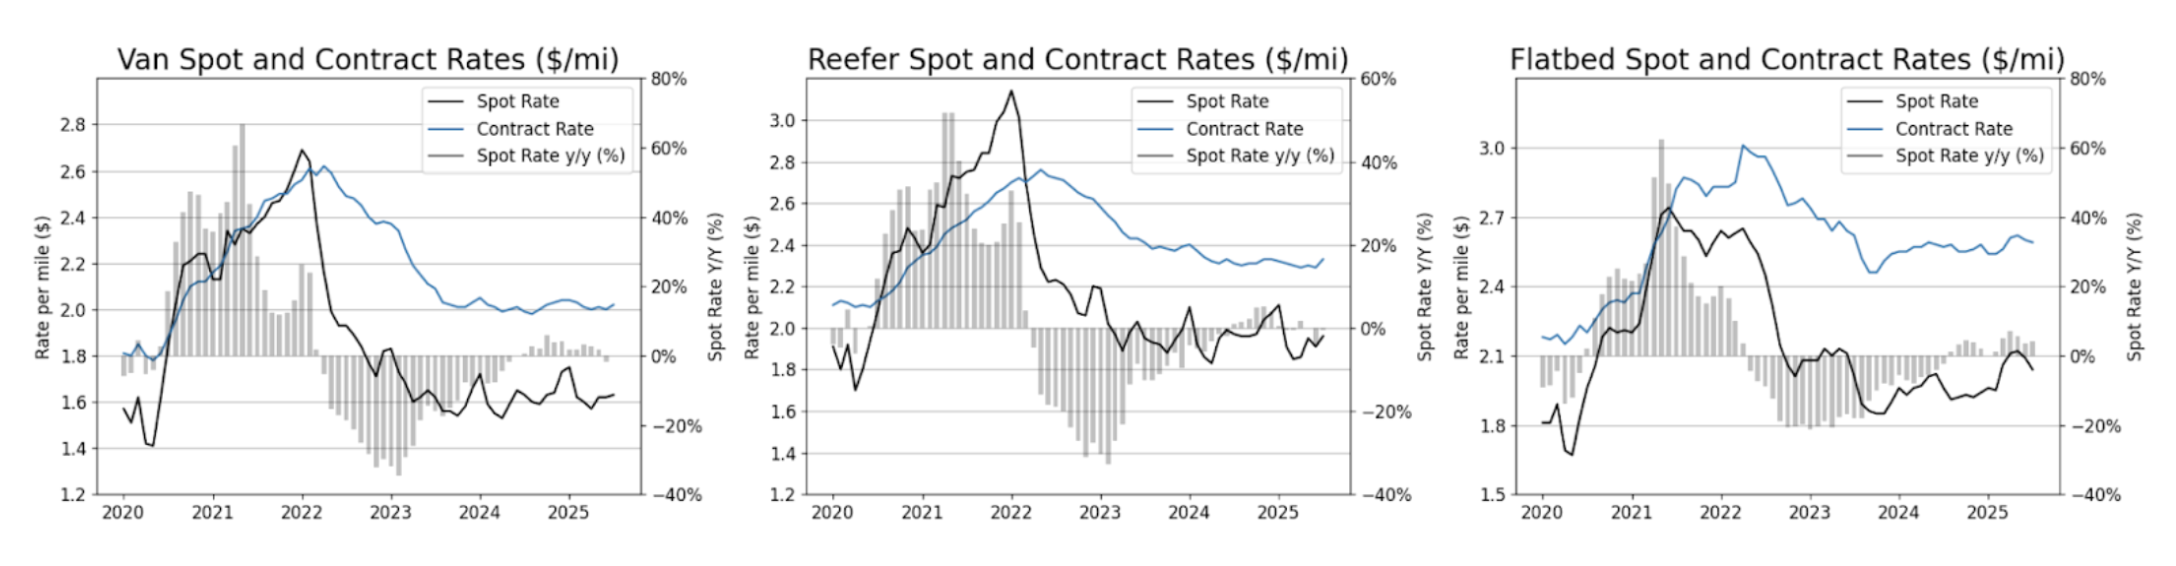
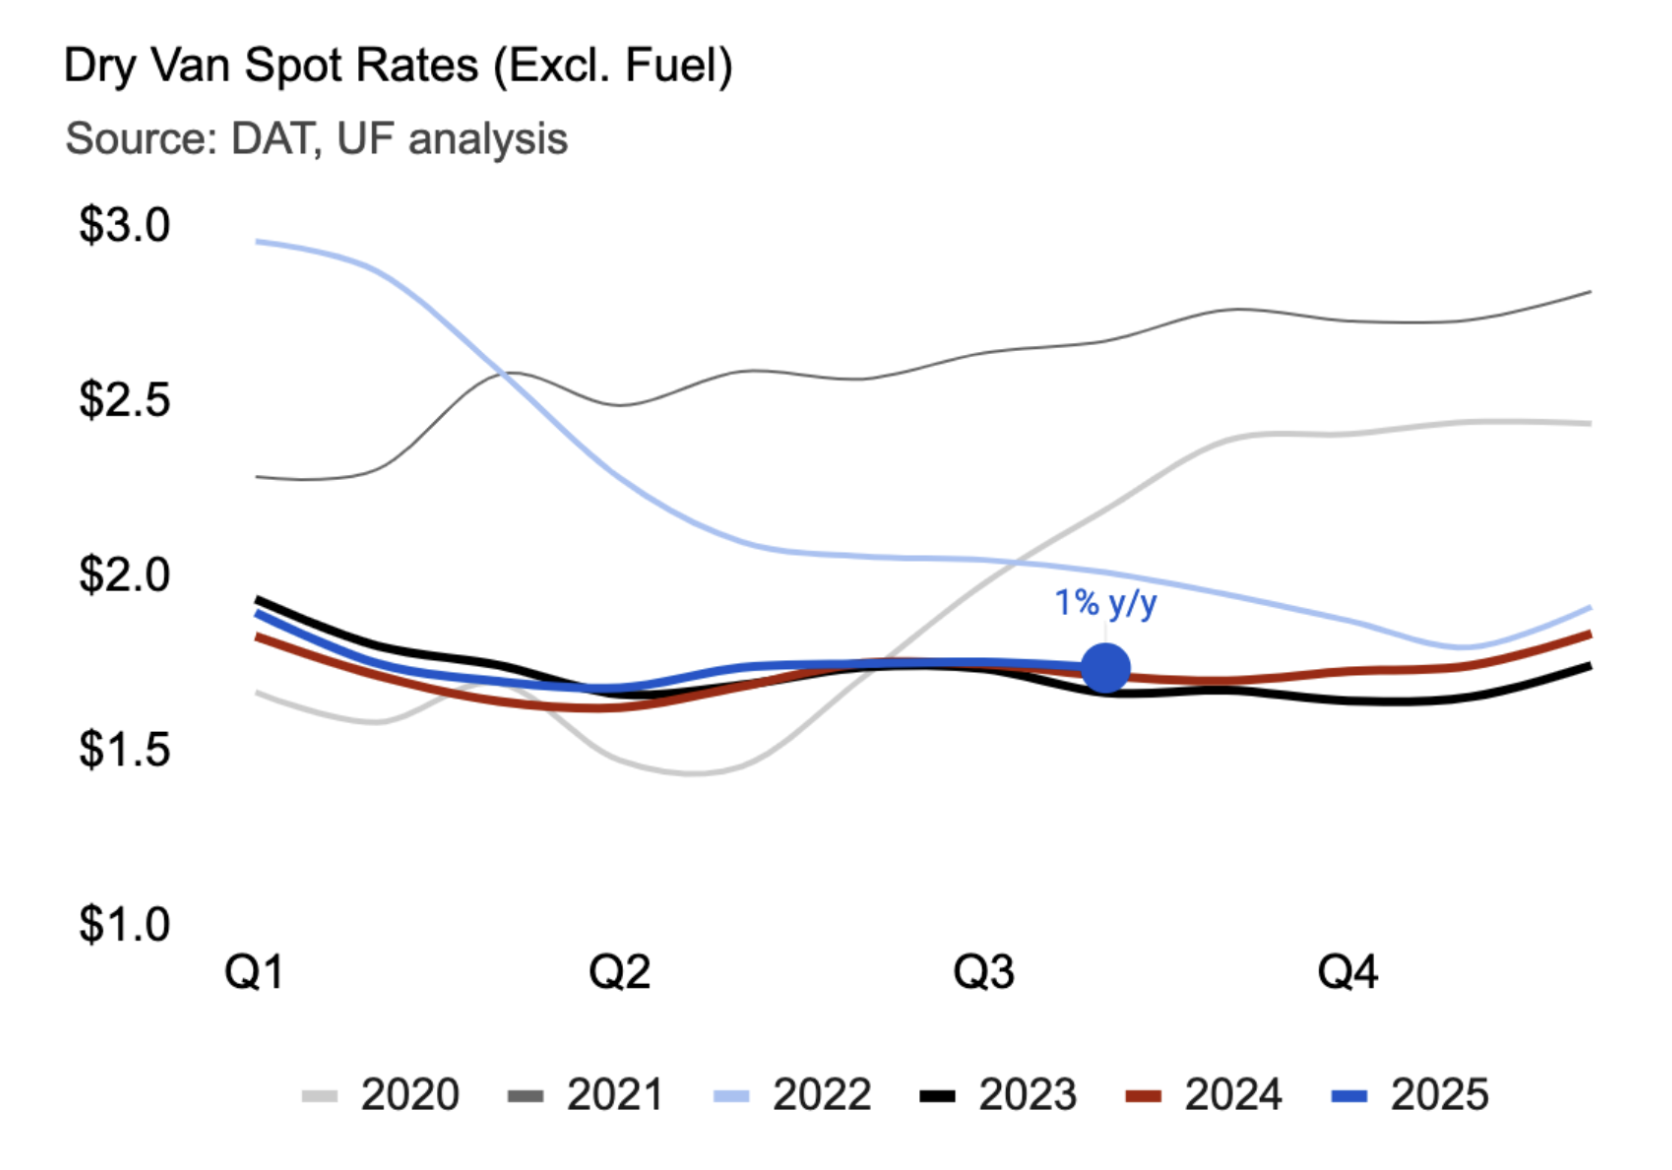
Spot rates remained flat in July, almost identical to their year-ago levels.
In July, van spot rates were flat, both month-over-month and year-over-year. Reefer spot rates, however, increased by 2% during the month but remained 0.5% lower than last year's rates. While spot rates were largely stagnant, contract rates edged up. Van contract rates rose 1.5% year-over-year, and reefer rates increased by 0.9% over the same period. Flatbed rates continued to be the top performer. Even after a seasonal dip of 2% in July, spot rates for flatbeds were still 4.1% higher year-over-year.
Spot and contract rates
Market conditions
Market
conditions
Current supply appears adequate for the current suppressed demand. However, it may not be sufficient if an external shock causes a surge in volumes. In fact, several indicators already suggest that capacity is quietly tightening in the spot market. This underlying trend makes the market vulnerable to supply or demand shocks that could push spot rates higher next year. This report offers recommendations for shippers to take advantage of the current soft market, which is expected to be the baseline for 2026. However, it also provides guidance to help them prepare for a potential—though less likely—market tightening.
3/3
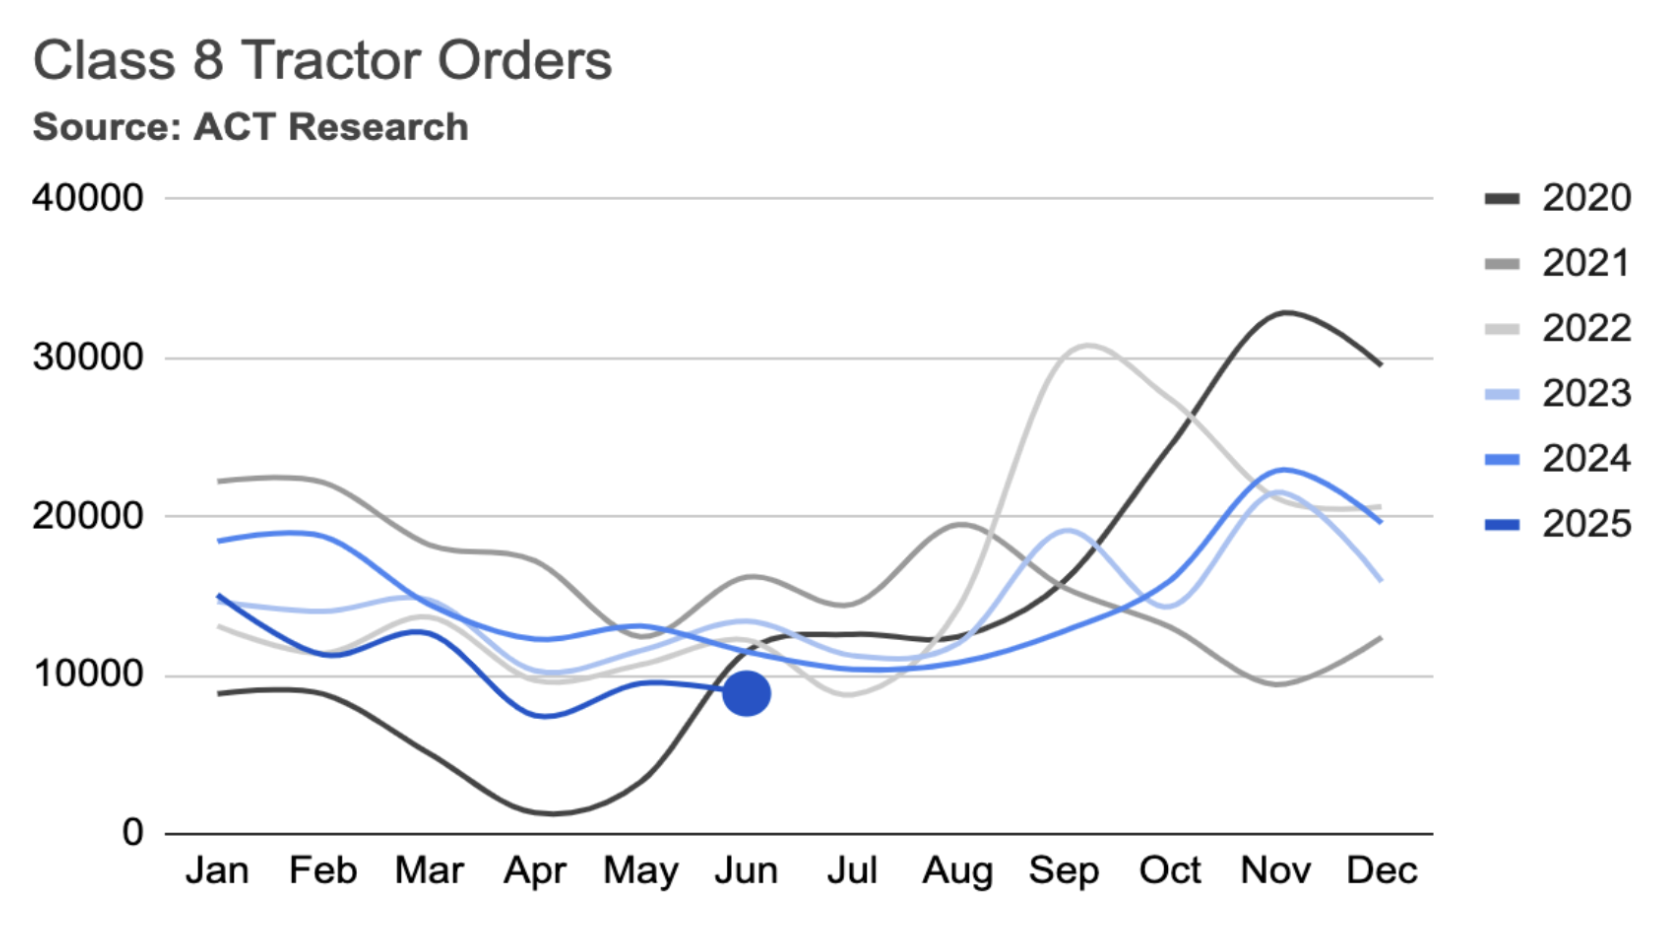
Carriers are maximizing fleet efficiency instead of investing in new trucks.
With the soft market pushing carrier margins to 15-year lows, Class 8 tractor orders are lagging. In the first half of 2025, orders dropped 27% year-over-year, while sales fell 14% and builds decreased 22%. Though not directly correlated with rates, weak truck orders have historically preceded tight markets by as much as a year.
In addition to hiring carriers at lower wages, carriers are investing in efficiency to maintain their razor-thin margins or even minimize losses. In 2024, average annual truck mileage increased, rising from 80,159 in 2023 to 82,677 in 2024, reversing a multi-year decline. Furthermore, trucks operated an average of 268 days per year in 2024, a substantial increase from 243 days in 2023.
Carrier population
The freight market, as reflected in spot and contract rates and route guide performance, has been flat for more than two years, with seasonality serving as the primary short-term driver. Forecasters, who have repeatedly predicted a market recovery, have repeatedly revised their projections downward. They are currently anticipating that the soft market will continue through at least the first half of 2026.
Meanwhile, freight supply has also been stagnant. A soft market has pushed carrier margins to 15-year lows, resulting in lagging Class 8 tractor orders. In the first half of 2025, orders were down 27% year-over-year, while sales fell 14% and new builds decreased by 22%. Furthermore, trucking employment has remained largely flat since a sharp capacity correction took place in 2024.
2/3
Tariffs are driving wholesale prices higher.
Industrial production of machinery, primary metals, and fabricated metals has remained relatively flat or slightly declined over the past year. A recovery in these sectors seems unlikely in the near future, as orders and shipments of core capital goods—a key indicator of manufacturing activity—have also stagnated.
Orders for core capital goods, which are nondefense capital goods excluding aircraft, are considered an early indicator of manufacturing activity. Weak orders and shipments in this sector suggest that a broader economic recovery may be delayed.


Industrial equipment and supplies
Automotive
Auto manufacturing has been one of the bright spots in the economy over the past year, driven by pent-up demand and a shortage of vehicles at dealerships. While production rose to meet demand, the market is starting to show signs of saturation, with inventories gradually normalizing and potential glut looming on the wholesale side.


Paper and plastics
Paper and plastics are highly used in the packaging industry, which has been affected by the recent slowdown in food spending after the economy re-opened. In addition, the demand for paper products was already on a downward trajectory due to factors such as digitalization, adoption of alternatives (plastics), and growth of e-commerce. The pandemic further accelerated this decline. Moreover, a surge in downstream inventories led to a slowdown in manufacturers’ demand.


Nondurable consumer goods
Demand for food consumed at home fell from its pandemic highs as the economy re-opened, normalizing back to its pre-pandemic levels. Demand for other consumer goods (such as apparel) continues to be pressured by external competition, slowing consumer demand, and high downstream inventories.


Durable consumer goods
Durable consumer goods such as appliances, furniture, and wood products are affected by the ongoing housing recession. New home sales remain below the 2019 levels, and about 30% below the pandemic peak. Similarly, housing starts are at their lowest level since the beginning of the housing recession, 32% below the 2022 peak.


Tariffs remain at their highest level since the 1930s.
The second quarter’s 3% GDP growth isn’t as good as it seems.
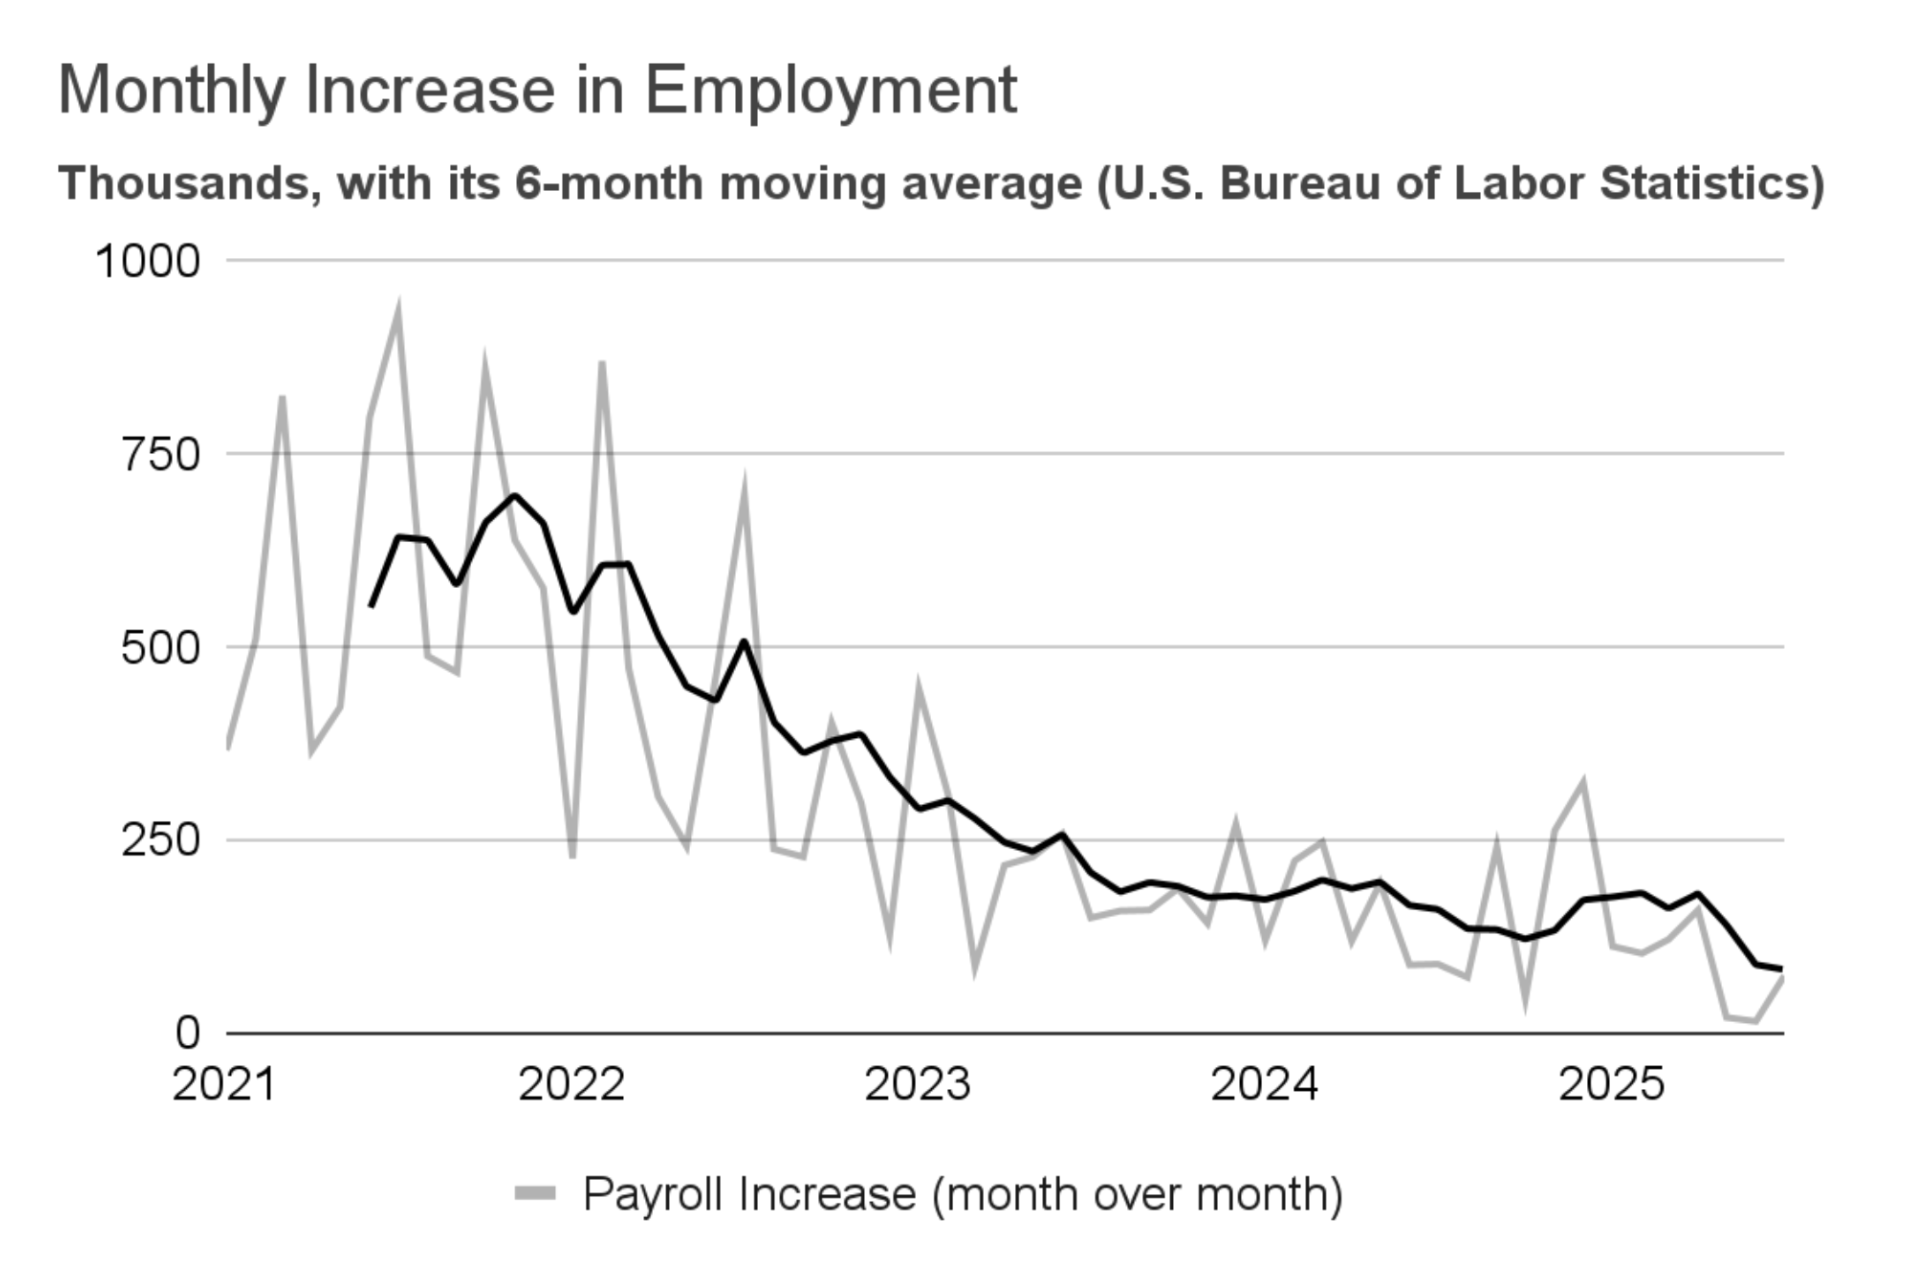
The job market softened significantly in the last 3 months.
Significant revisions from the U.S. Bureau of Labor Statistics (BLS) have painted a weaker picture of the labor market. The initial reports for May and June, which suggested a steady increase of 291,000 jobs, were revised sharply downward. The new data shows a much smaller gain, with only 19,000 jobs added in May and 14,000 in June. These figures represent the lowest job growth since 2020. July's data, while an improvement, still showed a modest increase of 73,000 jobs.
Furthermore, the unemployment rate edged up from 4.1% to 4.2% in July, another sign of a cooling labor market. Data from the June Job Openings and Labor Turnover Survey (JOLTS) reinforces this trend, showing a 4.8% drop in new hires and a 3.6% decrease in job openings.
Labor market
Short-term outlook
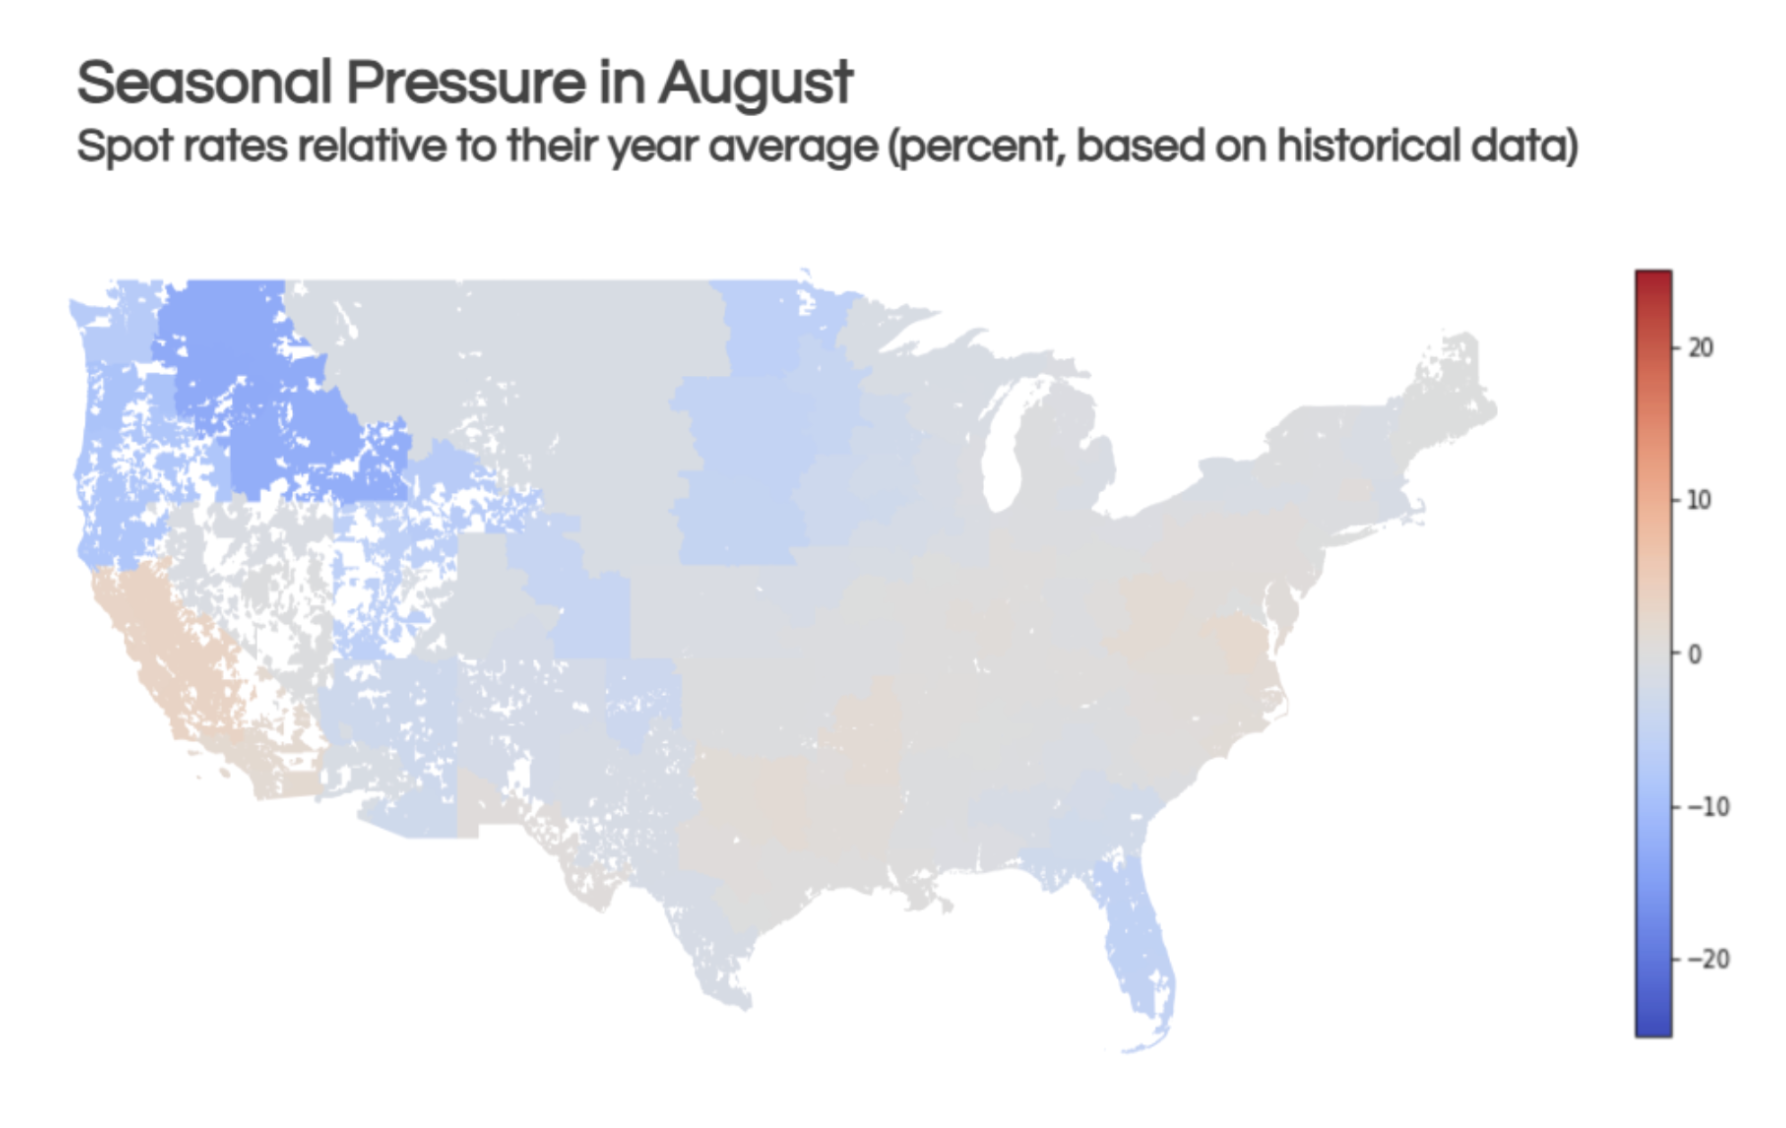
August is typically a slow month for freight, falling between the summer produce season and the end-of-year peak. The market is especially soft in the Pacific Northwest and the Southeast. However, California and some Eastern markets may tighten as shippers begin planning for peak season.
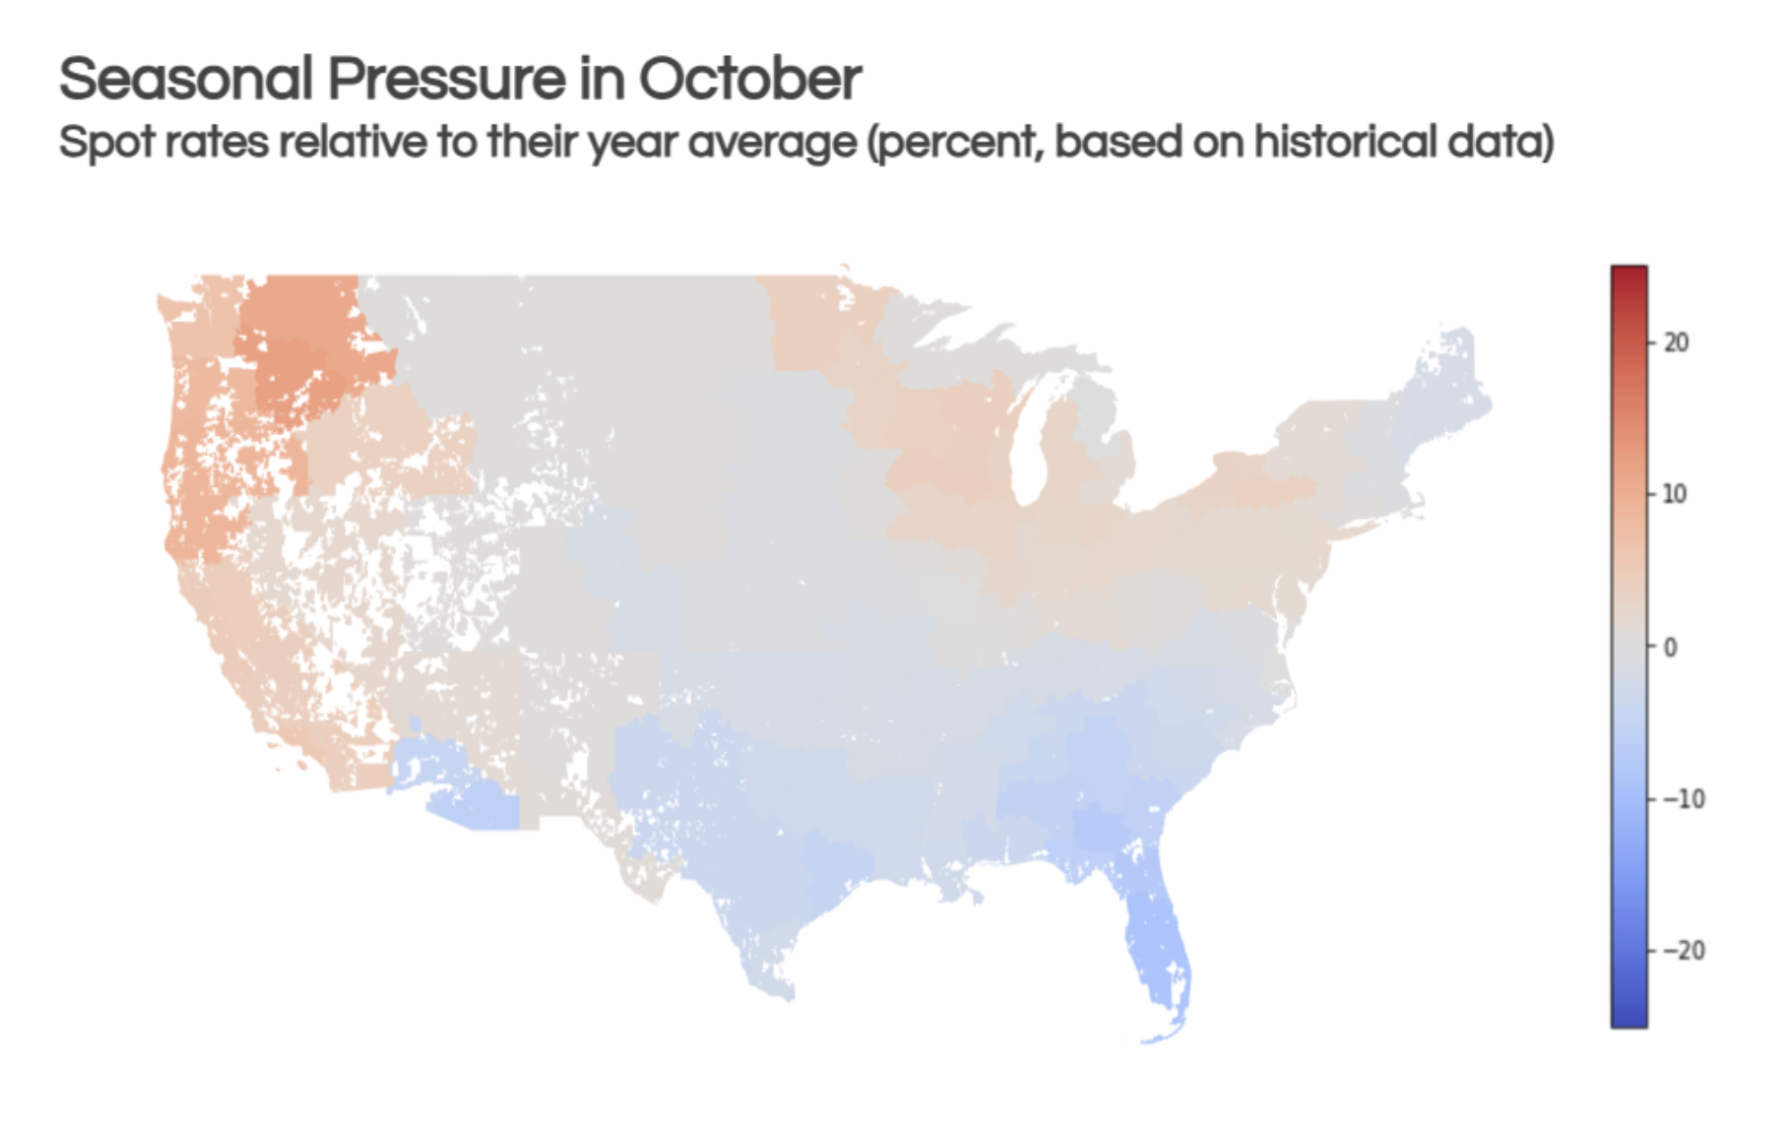
By October, the Pacific Northwest market tightens, partially due to rising demand for Christmas trees. Additionally, northern markets experience some tightness because of weather conditions and the approaching peak season. Meanwhile, southern markets soften further as produce volumes decline.
However, a different set of indicators suggests that capacity is tightening in the spot market, a trend that may be building beneath the surface. For instance, the DAT load-to-truck ratio, which has historically correlated with spot rates, has been signaling a tightening market since 2024 despite stagnant rates. The index, which measures the ratio of available spot loads to available trucks, has shown that while the number of spot loads has mostly stagnated, the number of truck posts has decreased over the last two years. This indicates that excess capacity is steadily exiting the market.
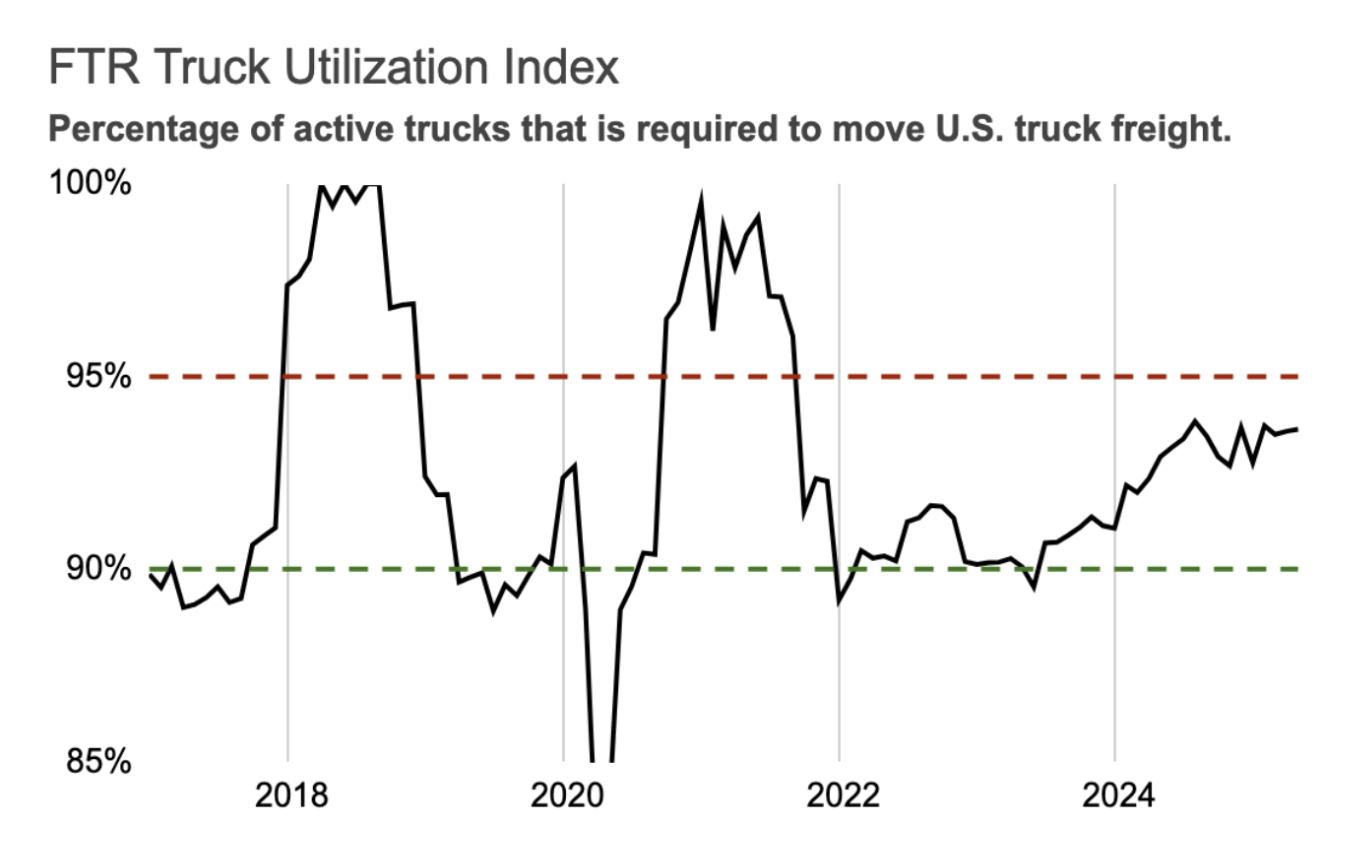
Additionally, the FTR Truck Utilization Index has risen from 90% in 2023 to 94% in 2025. This index measures the percentage of the active truck fleet needed to haul U.S. freight. A reading above 95% generally indicates a tight market, while one below 90% suggests a weak market with many idle trucks. Although not yet at the threshold for a tight market, the index has improved significantly since its 2022 levels.
Uber Freight's data also points to increased spot activity. Spot volumes on the platform surged by 19.5% year-over-year in 2024. This growth continued into the first half of 2025, with spot volumes seeing an additional 3.5% increase over the 2024 average.
Despite indicators suggesting a tighter market, spot rates have remained flat for nearly two years. Most forecasts for both spot and contract rates continue to project a flat market, with little change expected through the first half of 2026. However, the above indicators suggest that the current market softness may be fragile. This underlying tightness makes the market vulnerable to any sudden supply or demand shocks, which could cause a rapid increase in rates.
Shipper Recommendations: Prepare for the best, expect the worst
• Prepare for Multiple Scenarios: Budget and plan for various market conditions in 2026, especially flat and inflationary scenarios. While an inflationary turn may not be imminent, shippers should understand its potential impact on costs and service.
• Strengthen Carrier Relationships: Partner with financially stable carriers who are likely to maintain a high level of service if the market tightens. Building established relationships with reliable partners is crucial during periods of volatility.
• Adopt Flexible Contract Terms: Whenever possible, incorporate flexible pricing models, such as index-based and cost-plus contracts. These terms are gaining traction in both the spot market and contracted freight, offering protection against market fluctuations.
• Leverage Current Rates While Staying Agile: Take advantage of the current low rates to secure favorable pricing. However, be prepared to re-evaluate and reprice contracts if the market shifts.