The Freight Economist
February 2025
Executive summary
Monthly economic and market update
Long-distance
truckload carriers have shed 30.8K jobs since October 2022.
U.S. economy
U.S. GDP
Tariffs
Consumer
strength


Freight demand
Imports
Truck
tonnage
Manufacturing
Retail
sales


U.S. imports set a new record in January.
U.S. container imports set a new record in January, according to Descartes. Imports approached 2.5 million TEUs, a 9.4% year-over-year increase. This surpasses the previous record set in January 2022 by 21,455 TEUs. Continuing the post-pandemic seasonal trend, January imports rose 5.1% from December. Imports from China increased 10.6% over December to 997,909 TEUs. These were only 2.4% below the July 2024 peak, but 10.2% above year-ago levels.
Imports

What does it mean for truck tonnage?
Retail sales
Key data points and commentary
Trucking
volume

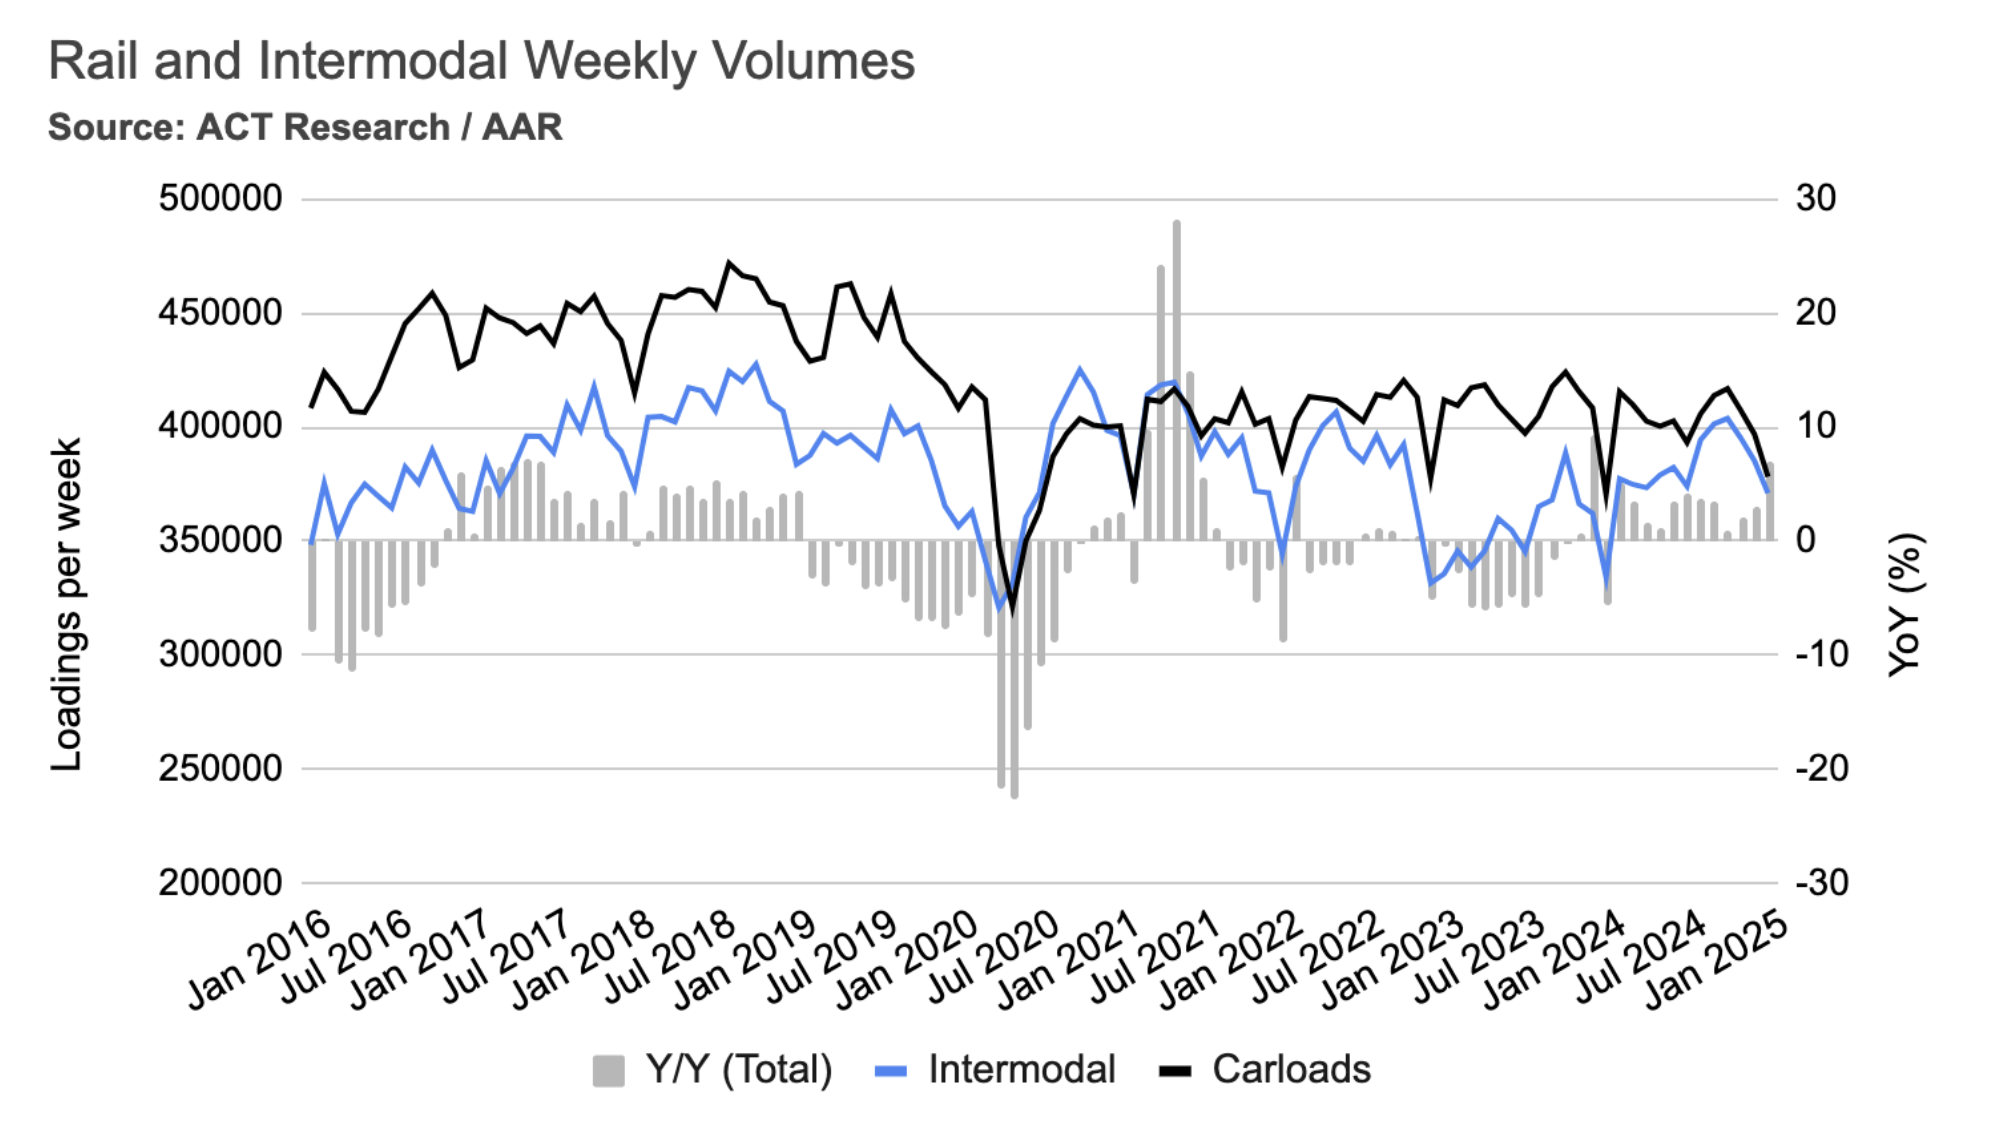
Rail volume
and rates

Geographic
trends

Routing guide trends

Routing guide trends
Geographic trends
Average m/m and y/y van spot rate index by origin regions – January
Source: DAT

Trucking volume
The Cass Freight Shipments Index dropped 5.3% in January, with about half of that decline attributed to seasonal factors. The seasonally adjusted index fell approximately 2.7%, likely due to weather disruptions, and was 8.2% lower than the same time last year. Similarly, the American Trucking Associations (ATA) Truck Tonnage Index decreased 1.2% in December and was 3.2% below December 2023 levels.
Rail volume and rates
In January, average weekly intermodal loads decreased by 3.7%, and weekly carloads dropped by 4.7%. However, compared to the same time last year, intermodal volumes were significantly higher, up 11%, and carloads increased by 2.1%. It's worth noting that this January's declines were less severe than those of the previous year, which saw 7.7% and 9.3% reductions in intermodal and carload loadings, respectively.
Mazen’s work focuses on analyzing the freight transportation landscape, and producing short- and long-term forecasts based on supply and demand dynamics. He is also a research affiliate with the Intelligent Transportation Systems (ITS) Lab at MIT, where he completed his PhD in 2019. His work falls at the intersection of ITS, economic modeling, and analytics.
mdanaf@uberfreight.com
By Mazen Danaf, Senior Economist and Applied Scientist, Uber Freight
Featuring insights and contributions from Uber Freight leadership,
technologists and market specialists.


The first tender acceptance rate fell in January from 89% to 88%, and routing guide compliance fell from 92% to 91%. These were the lowest levels since mid-2022. Cost over the primary carrier rose from 3% to 4.2%, indicating that market tightening is starting to impact shippers’ financials.
GDP growth was slower than the previous two quarters, yet still a healthy rate. Growth was driven by consumer spending, with goods spending contributing 1.37% and services spending adding 1.45%, indicating continued consumer strength. However, a reduction in private inventories, due to slower factory output and inventory management in response to softer demand, subtracted 0.93% from GDP.


Executive
summary
U.S.
economy
Freight
demand
Freight
supply
U.S. GDP
Average m/m and y/y van spot rate index by destination regions – August
Source: DAT

Dry van spot rates rose in most regions during January, with the exception of the West, which saw a 5.8% decline following a busy peak season. However, even with the January dip, West rates remained 12.8% higher than last year. Other regions saw increases between 3.1% and 7.7%, led by the Midwest and Northeast and driven by severe weather disruptions. These regions also saw slight year-over-year increases, mirroring last January's tight market conditions due to winter storms.
Key data
points
Shipper and carrier insights
Current procurement headlines
January retail sales dropped 0.9% from December.
The drop was led by declines in motor vehicle and parts dealership sales and nonstore (e-commerce) retailers. Potential contributing factors include weather disruptions (from California wildfires to nationwide winter freezes) and shifting post-pandemic seasonal patterns, echoing last year's 0.7% January decline. Despite the decrease, sales remain 4.2% above last year's level, slightly below December's 4.4% increase.
Inflation

Retail and food service sales climbed 1% in July, primarily boosted by a 3.6% surge in motor vehicle and parts dealers. Excluding this sector, sales edged up 0.4% from the previous month and were 3.1% higher compared to the same time last year. Importantly, this sales growth outpaced the rate of inflation for goods, which actually decreased over the past 12 months.

2/2
Freight demand rose across all three main sectors in December.
In December, consumer-driven truckload demand rose 0.7%, wholesale demand 1.7%, and manufacturing demand rose 0.4%. While consumer demand was up 2.7% year-over-year, wholesale demand was flat, and manufacturing demand declined slightly. January's positive ISM PMI data suggest a potential manufacturing recovery, which could boost freight growth in 2025.


1/2
2/2
The looming threat of tariffs has been causing various supply chain disruptions. Tariffs on Mexico and Canada were postponed by 30 days, allowing time for negotiations to potentially avert negative consequences. We are likely to see a surge in cross-border volumes during the coming weeks, as shippers prepare safety stock in case an agreement is not reached in time. Unlike Canada and Mexico, the 10% percent tariffs on Chinese products went into effect on February 4, and are likely to stay. These were already anticipated by shippers, which pulled imports forward in 2024.
1/3


Producer Price Index data shows intermodal rates increased 0.5% in January, while carload rates jumped 1.6%. Year over year, intermodal rates are down 4.8%, but carload rates are up 3.1%. Intermodal rates may have bottomed out, as they typically follow contract rates, which have recently begun to rise.


1/2
2/2
Shipper and carrier insights
The U.S. consumer appears healthy, with the unemployment rate falling to 4.0% in January. Real personal consumption expenditures increased 0.4% in December and 3.1% year-over-year. Within this, spending on goods rose 0.7% in December and 3.5% year-over-year. Durable goods spending, a key indicator of consumer confidence, showed particular strength, with a 1.1% increase in December and a 6.1% rise compared to December 2023. This sustained spending on durables suggests resilience and is generally inconsistent with recessionary periods.
Despite this robust spending, income growth remains a concern. December saw only a modest 0.1% increase, and the year-over-year gain was just 2.4%. As a result, the consumer savings rate has fallen to 3.8% in December, down from 4.1% in November and significantly below the 7% to 8% pre-pandemic range.

Consumer strength
In January, the Consumer Price Index (CPI) increased by 0.5%, surpassing expectations and bringing the annual inflation rate back to 3%. Core inflation, which excludes volatile food and energy prices, rose by 0.4% for the month and was 3.3% higher than the previous year.
Price increases were widespread, with significant contributions from shelter, food, used cars, and transportation services. Although shelter inflation has decreased from its peak of approximately 8.2% to 4.4% in January, it continues to drive overall inflation upward. The shelter index rose by 0.4% in January, representing almost 30% of the total monthly increase, according to data from the Bureau of Labor Statistics. Even when excluding shelter costs, service prices have grown beyond the Federal Reserve's 2% target, reaching 3.9% in January.

Inflation
In the long run, tariffs might boost domestic freight by giving local manufacturers an edge. However, the magnitude and sudden implementation of tariffs means we probably won't see benefits for a while, and the immediate damage will be greater.
Unlike Canada and Mexico, the 10% percent tariffs on Chinese products went into effect on February 4, and are likely to stay. Tariffs on China were already anticipated by shippers, some of which pulled imports forward in 2024.
A survey of Uber Freight shippers found that the majority do not foresee immediate changes to their networks. However, a significant minority (42%) are actively assessing various options. Some shippers reported that they anticipate absorbing cost increases and subsequently passing those increases on to their customers. Seventeen percent of shippers indicated they are pre-stocking cross-border inventories. In contrast, very few are exploring domestic alternatives or alternative vendors in countries not impacted by tariffs. Some expressed concerns that it will take several months to adapt their networks.
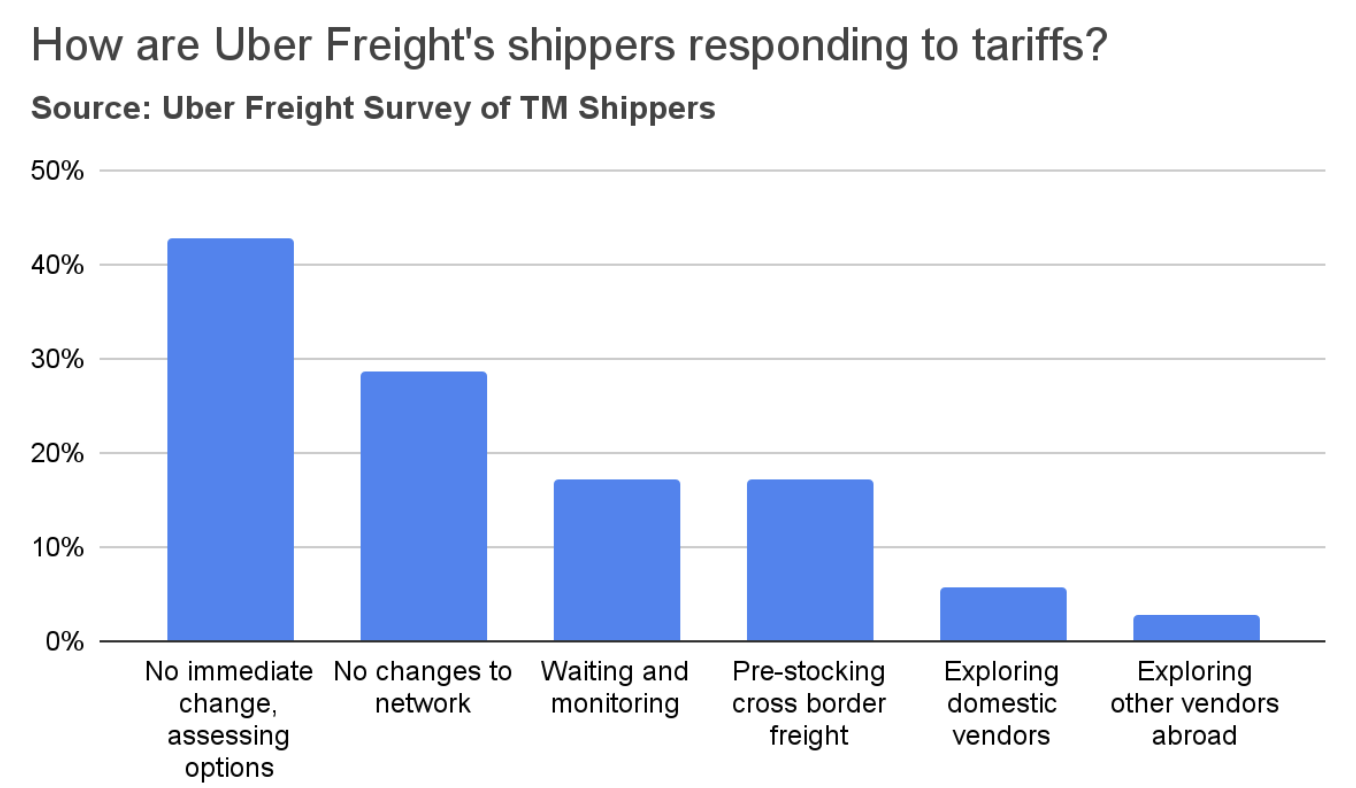
Tariffs


The U.S. manufacturing sector expanded after 26 months of contraction.
The ISM Purchasing Managers Index (PMI) edged up to 50.9 in December, surpassing the expansion threshold (50.0) for the first time in 26 months. New orders and production increased, while employment stabilized. The prices index remained above 50, indicating moderate growth in the prices of commodities and raw materials.
In January, eight manufacturing industries experienced growth according to ISM, led by Textile Mills and followed by Primary Metals, Petroleum & Coal Products, Chemical Products, Machinery, Transportation Equipment, Plastics & Rubber Products, and Electrical Equipment, Appliances & Components. Conversely, eight other industries contracted. These declining sectors, in order, were Nonmetallic Mineral Products, Miscellaneous Manufacturing, Wood Products, Fabricated Metal Products, Furniture & Related Products, Computer & Electronic Products, Paper Products, and Food, Beverage & Tobacco Products.
Unlike the ISM, Federal Reserve data show a slight 0.1% dip in manufacturing output in January, possibly due to weather. However, output was 1.0% higher than January 2024—the largest year-over-year increase since December 2023.
Manufacturing

The ISM report also highlighted widespread concerns among manufacturers about declining demand and order levels. Respondents across various sectors expressed pessimism about the near-term outlook.
Manufacturing

2/2
Freight supply
Spot rates

Carrier
population

Supply and demand indices

Driver
employment

Revised BLS data show trucking employment declining faster than previously estimated. Consequently, our truckload supply index was revised downward, tightening the gap between supply and demand. We estimate December truckload demand was up 1.2% year-over-year, while supply was down 0.2%. In December, supply and demand indices rose 0.3% and 0.8%, respectively.

Truckload supply and demand indices
Capacity has been exiting the market faster than initially thought.
February saw significant revisions to trucking employment data, a key predictor of truckload rates. The revised figures reveal a sharper decline than previously estimated in long-distance truckload employment, which has now fallen below 2019 levels. Despite growth in the final two months of 2024, employment in this sector remains 1.7% lower year-over-year and 5.6% below the 2022 peak.

Driver employment
Dry van spot rates are mirroring last year’s trends. While January's average spot rate of $1.90/mile was the highest since December 2022 and $0.05/mile higher than December, the following weeks saw a sharp drop. Rates fell by approximately 18% between the last week of December and the first week of February. Despite this decline, current rates remain slightly above last year’s levels, by single-digit percentage points.

Spot rates
Market conditions
Market
conditions
Dry van spot rates are mirroring last year’s trends. While January's average spot rate of $1.90/mile was the highest since December 2022, the following weeks saw a sharp decline. Rates fell by approximately 18% between the last week of December and the first week of February. Despite this, current rates remain slightly above last year’s levels, by single- digit percentage points.
3/3
Both carrier entrants and exits have been slowing down.
Similar to trucking employment data, data on new freight carrier authorities and revocations from FMCSA also shows that capacity correction has mostly taken its course. FMCSA authorized 3,759 new carriers in January and revoked the authority of 4,645. This resulted in a net loss of 886 carriers, much lower than the average monthly decrease of 1,755 carriers experienced in 2023.

Carrier population
Bid activity
- Annual full-network RFP events continue to be the trend, with supplemental mini-RFPs utilized to support the route guide as needed between bid cycles.
- After record activity in 2023, RFP events have been mostly flat, with a light uptick in Q4 as a few shippers chose to pull bids forward, projecting a market increase.
Strategic trends
- Shippers are beginning to insulate themselves ahead of a predicted upturn in the contract market.
- Shippers are willing to bid on the entire network vs. only select lanes but are looking at all options.
- Most shippers are trying to keep their incumbents in place, if possible, through the RFP cycle.
- Volume cutoffs remain a key strategic discussion while preparing to release an RFP event: a low-volume strategy for coverage and backup carriers.
Carrier behavior
- TL carriers continue to cast a wide net in bids but are starting to narrow focus to preferred volume vs. any volume.
- Brokers continue to be aggressive in an attempt to capture market share.
- Incumbent carriers trying to stay whole in RFPs. Some are trying to push notable price increases with little success.
Click to jump to section
Various indicators point to recovery in freight demand. The ISM Purchasing Managers Index (PMI) edged up to 50.9 in December, surpassing the expansion threshold (50.0) for the first time in 26 months. U.S. container imports set a new record in January, according to Descartes. Imports approached 2.5 million TEUs, a 9.4% year-over-year increase. Meanwhile, a sharp revision to the BLS data on trucking employment indicates that capacity has been exiting the market faster than initially estimated.
2/3
Consumer spending remained robust in December.
Industrial production of machinery, primary metals, and fabricated metals has remained relatively flat or slightly declined over the past year. A recovery in these sectors seems unlikely in the near future, as orders and shipments of core capital goods—a key indicator of manufacturing activity—have also stagnated.
Orders for core capital goods, which are nondefense capital goods excluding aircraft, are considered an early indicator of manufacturing activity. Weak orders and shipments in this sector suggest that a broader economic recovery may be delayed.


Short-term outlook
February typically marks a decline in spot market demand as the holiday rush subsides and drivers return to work. This usually results in spot rates falling below annual averages, with the exception of a few Midwest regions.

The looming threat of tariffs has been causing various supply chain disruptions. Tariffs on Mexico and Canada were postponed by 30 days, allowing time for negotiations to potentially avert negative consequences. We are likely to see a surge in cross border volumes during the coming weeks, as shippers prepare safety stock in case an agreement is not reached in time. Unlike Canada and Mexico, the 10 percent tariffs on Chinese products went into effect on February 4, and are likely to stay. These were already anticipated by shippers, which pulled imports forward in 2024.
1/3
Industrial equipment and supplies
Automotive
Auto manufacturing has been one of the bright spots in the economy over the past year, driven by pent-up demand and a shortage of vehicles at dealerships. While production rose to meet demand, the market is starting to show signs of saturation, with inventories gradually normalizing and potential glut looming on the wholesale side.


Paper and plastics
Paper and plastics are highly used in the packaging industry, which has been affected by the recent slowdown in food spending after the economy re-opened. In addition, the demand for paper products was already on a downward trajectory due to factors such as digitalization, adoption of alternatives (plastics), and growth of e-commerce. The pandemic further accelerated this decline. Moreover, a surge in downstream inventories led to a slowdown in manufacturers’ demand.


Nondurable consumer goods
Demand for food consumed at home fell from its pandemic highs as the economy re-opened, normalizing back to its pre-pandemic levels. Demand for other consumer goods (such as apparel) continues to be pressured by external competition, slowing consumer demand, and high downstream inventories.


Durable consumer goods
Durable consumer goods such as appliances, furniture, and wood products are affected by the ongoing housing recession. New home sales remain below the 2019 levels, and about 30% below the pandemic peak. Similarly, housing starts are at their lowest level since the beginning of the housing recession, 32% below the 2022 peak.


Inflation remains stubbornly around 3%, and tariffs could worsen the situation.
The U.S. economy grew at a 2.3% annual rate in Q4.


Carrier Management
- Establish strategic relationships with key providers in your network.
- Create symbiotic, long-term goals with key partners.
- Partner with carriers on company initiatives around technology, best practices, and ease of doing business.
- Develop formal processes to address service and performance improvement plans.
Navigating volatility
- Understand where your rates are relative to the market.
- Work with your carrier base to understand their network and cost pressures.
- Work with strategic carriers for cost and price transparency within your network and create an action plan for out-of-process lanes.
- Stay close to your incumbents on critical lanes to understand price trends and capacity changes.
- Understand your carriers’ tracking and technology capabilities and set clear expectations.
- Routing Guide setup becomes more critical in a tightening market, such as backup carriers, low volume, etc.


2/2
The looming threat of tariffs has been causing various supply chain disruptions.
Tariffs on Mexico and Canada were postponed by 30 days, allowing time for negotiations to potentially avert negative consequences. We are likely to see a surge in cross-border volumes during the coming weeks, as shippers prepare safety stock in case an agreement is not reached in time.
The severity of the consequences on Canada & Mexico makes an agreement more likely. First, tariffs are likely to cause higher inflation in the U.S., leading to fewer rate cuts, and directly impacting freight demand. As the prices of imported goods increase, this will lead to lower cross-border volumes, resulting in abundant capacity. Intra-Canada and Mexico volumes are particularly vulnerable: Approximately 78% of Mexico's exports go to the U.S., as do roughly 77% of Canada's. Exports are nearly one-third of both counties’ GDP.
Tariffs
1/2
Spot rates usually bottom in April as freight demand hits a year-low. Last year saw a 21 cent/mi drop between January and April. A less pronounced drop this year could signal a tightening market (on a seasonally adjusted basis).

Long-term outlook

Long-term outlook
Long-term outlook