The Freight Economist
July 2025
Executive summary
Monthly economic and market update
Van spot rates
turned negative
year-over-year after a
year of modest positive comparisons.
U.S. economy
Tariffs
Housing market
Labor market


Freight demand
Imports
Truck
tonnage
Manufacturing
Spending
on goods


Following May’s sharp decline, U.S. container imports rose in June.
In June, U.S. container import volumes experienced a modest recovery, showing a 1.8% increase from May, according to Descartes. This followed a sharp 9.7% month-over-month drop in May, primarily attributed to tariff volatility. Despite this rebound, volumes remained 3.5% lower year-over-year. Given that volumes typically decline from May to June, Uber Freight's analysis indicates that June's 1.8% month-over-month gain actually represents a 4.2% increase on a seasonally adjusted basis. This likely reflects pre-stocking ahead of the tariff pause deadline, but could also indicate a stabilization in the market after the U.S.–China tariff reduction agreement.
Breaking down the country-specific data, U.S. imports from China in June saw only a slight 0.4% increase from May, but remained 28.3% lower year-over-year. In contrast, Southeast Asian nations posted more robust gains. Imports from Vietnam, Indonesia, and Thailand increased by 7.7%, 17.3%, and 8.6% respectively year-over-year. These figures suggest a continued momentum for China-alternative sourcing strategies among importers.
Imports

What does it mean for truck tonnage?
Spending on goods
Key data points and commentary
Trucking
volume

Intermodal
rates

Geographic
trends

Routing guide trends

Routing guide trends
Geographic trends

Trucking volume
Falling 0.2%, the Cass Freight Shipments Index was 2.4% lower than last year and a remarkable 18.8% below its 2021 peak. Yet, this index likely overstates the true decline in freight volumes. It is more heavily weighted by smaller Less-Than-Truckload (LTL) shipments, which saw a steeper drop than truckload shipments during the last freight recession. In comparison, the ATA Truck Tonnage Index, which measures tonnage instead of shipment counts, was 1.3% lower year-over-year and only 4.3% below its 2022 all-time high.
Intermodal rates
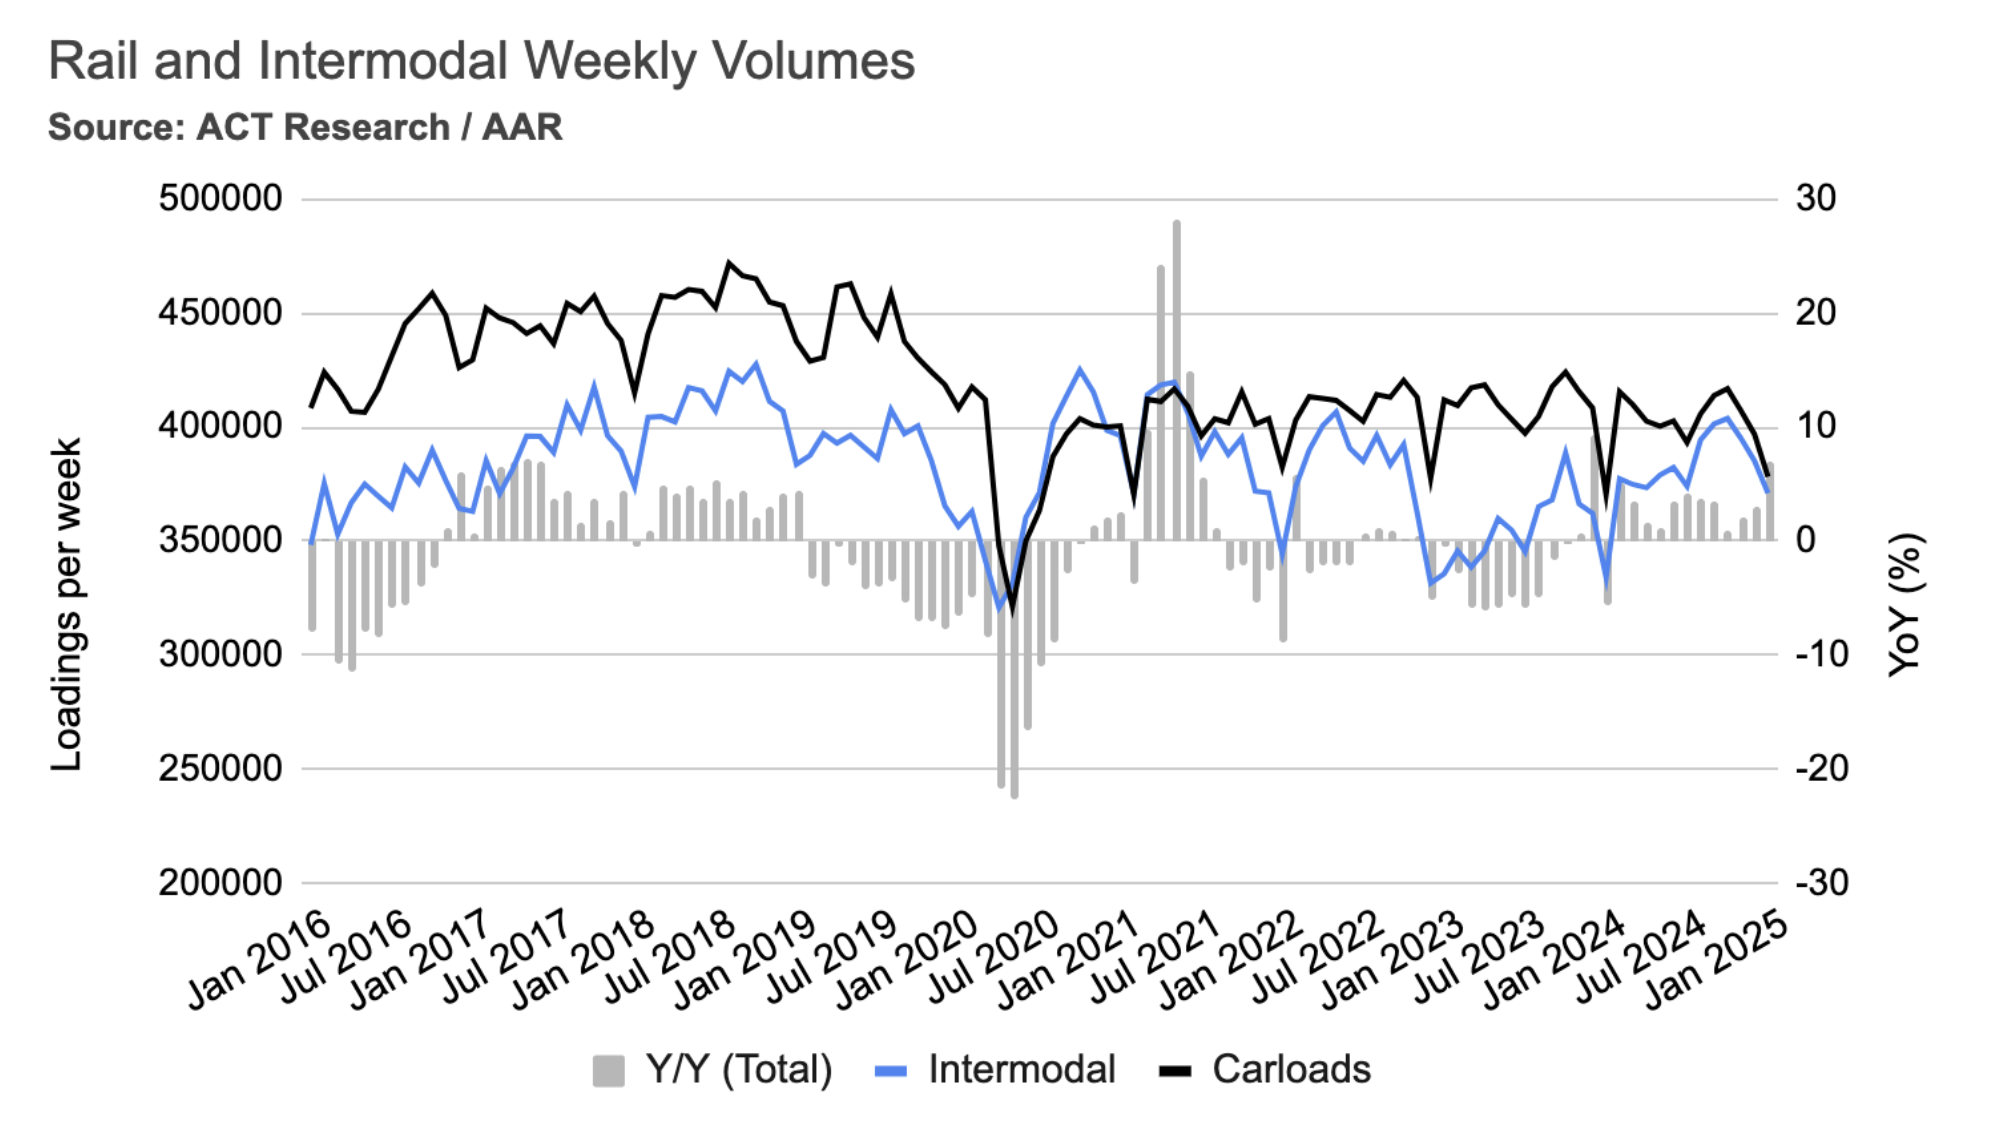
In January, average weekly intermodal loads decreased by 3.7%, and weekly carloads dropped by 4.7%. However, compared to the same time last year, intermodal volumes were significantly higher, up 11%, and carloads increased by 2.1%. It's worth noting that this January's declines were less severe than those of the previous year, which saw 7.7% and 9.3% reductions in intermodal and carload loadings, respectively.
Mazen’s work focuses on analyzing the freight transportation landscape, and producing short- and long-term forecasts based on supply and demand dynamics. He is also a research affiliate with the Intelligent Transportation Systems (ITS) Lab at MIT, where he completed his PhD in 2019. His work falls at the intersection of ITS, economic modeling, and analytics.
mdanaf@uberfreight.com
By Mazen Danaf, Senior Economist and Applied Scientist, Uber Freight
Featuring insights and contributions from Uber Freight leadership,
technologists and market specialists.


Route guide performance remained robust in June, defying seasonal expectations. First Tender Acceptance rates remained unchanged at 93%, while Route Guide Compliance rose slightly to 94%. This occurred despite expectations of tightening due to the summer produce season, which was apparently underwhelming this year. Even when tender rejections occurred, the shippers’ expected costs over the primary carrier was only 1.2% in June, indicating that routing guide failures are not impacting shippers' financials.
Over the past 30 days, new tariff announcements and deals have increased the estimated average U.S. tariff rate from 14.5% in June to 19.7% in July, according to the Yale Budget Lab. Recent developments include the US-Vietnam framework, imposing a 20% broad tariff and a 40% tariff on goods transshipped from China, a 50% tariff on copper imports, and 30% tariffs on the EU and Mexico (effective August 1, up from prior rates of 10% and 25%, respectively). Tariffs are expected to increase prices by 1.8%, a $2,300 loss per household.


Executive
summary
U.S.
economy
Freight
demand
Freight
supply
Tariffs
Average m/m and y/y van spot rate index by destination regions – August
Source: DAT

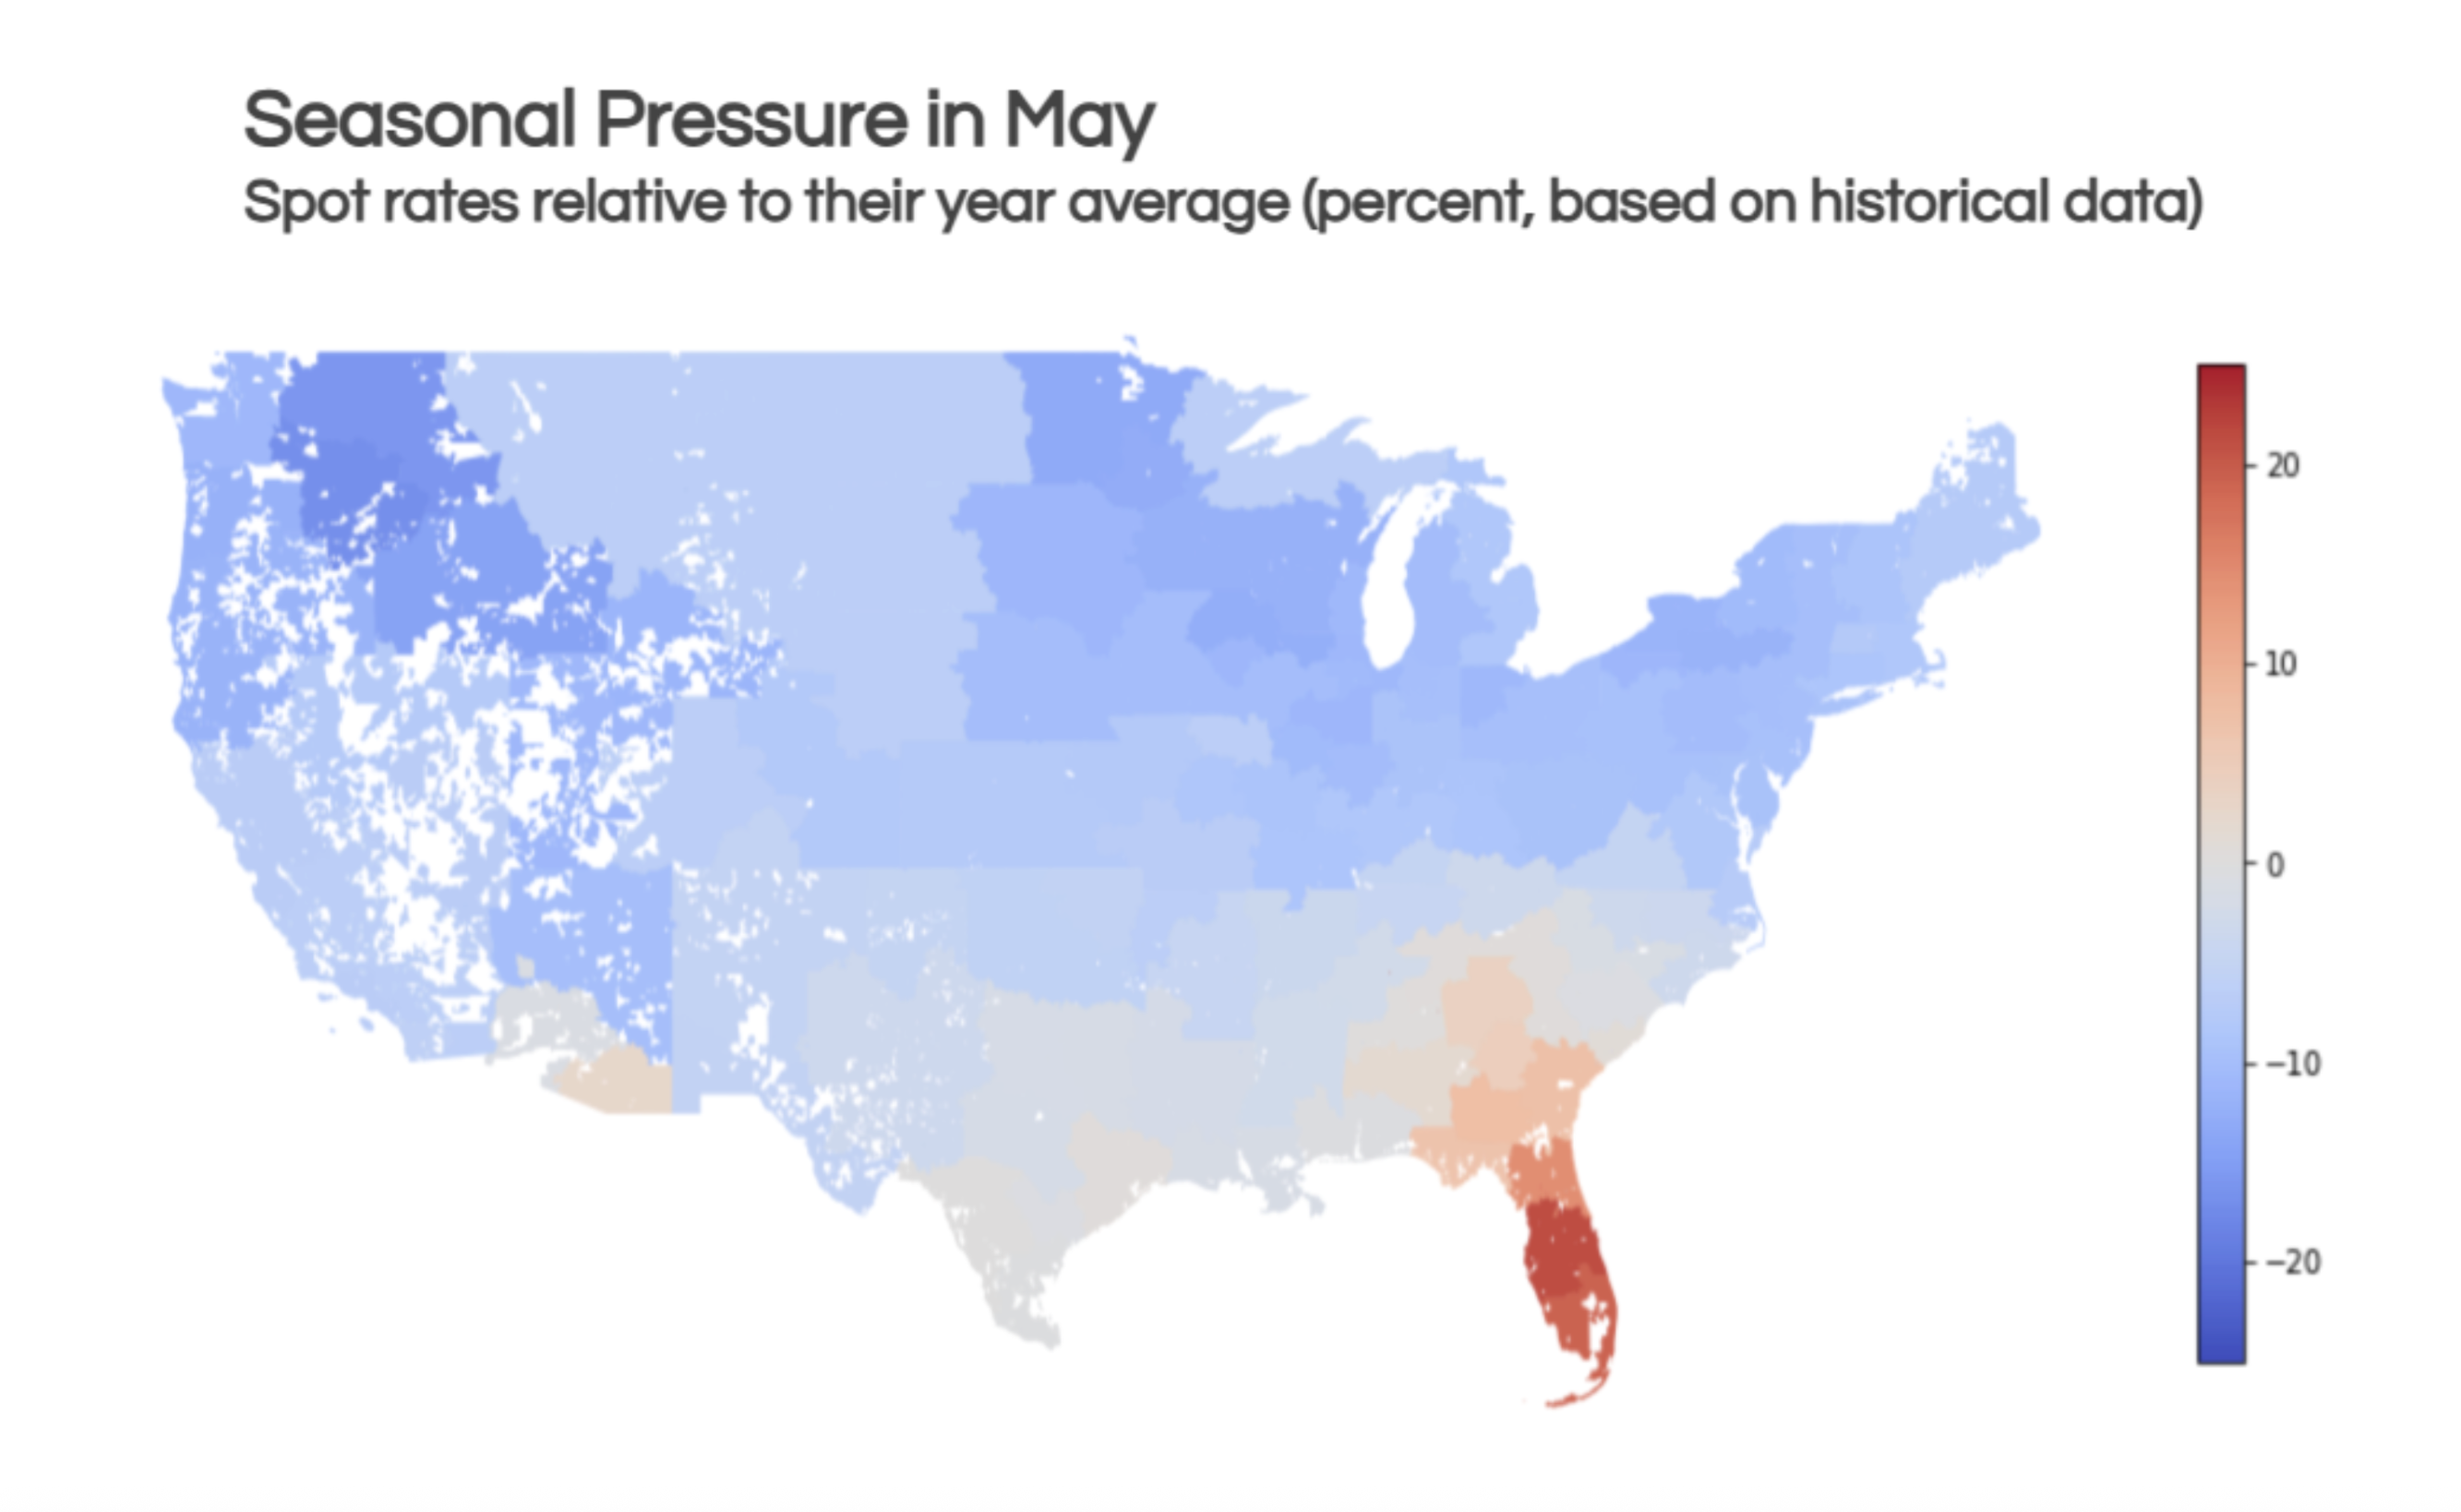
While May brought a 10.9% surge in Southeast spot rates, a typical occurrence for produce season, this seasonal strength did not carry through to June. Rates remained largely flat across all regions. The Southeast, for instance, saw only a modest 0.9% increase in spot rates, putting them 0.2% lower year-over-year. Similarly, rates in the West rose by just 1.9%, significantly trailing last year's levels with a 6% year-over-year decline. Other regions experienced only minor month-over-month and year-over-year changes, which seems underwhelming when considering the usual seasonal surges we would expect during this time of the year.
Key data
points
Shipper and carrier insights
Carrier Operating Costs
Consumer spending is returning to stability after a worrying dip in May.
Retail sales increased by 0.6% in June, rebounding from a 0.9% dip in May. Despite this rise, sales remained slightly below March and April levels. The June increase was broad-based, with the exception of furniture, appliances, electronics, musical goods, and sporting goods, which saw flat spending month-over-month.
Compared to the previous year, sales were up 3.9% year-over-year. Core goods sales, excluding food and drinking services, motor vehicles and parts, and gasoline stations, also rose 0.6% in June and were 3.6% higher year-over-year.
Inflation

Pre-stocking boosts wholesale demand while retail and manufacturing-driven demand stagnate.
Our truckload demand indices, which run through May 2025, indicate that wholesale-driven truckload demand rose 0.2% in May, while retail and manufacturing-driven demand were flat. Compared to year-ago levels, consumer demand was 2.3% higher and wholesale demand was 3.4% higher, likely boosted by recent tariff pre-stocking. Manufacturing-driven demand, however, was 0.4% below its year-ago level.


1/3
2/3
Despite tariff uncertainty, stability has been the overarching theme across both the freight market and the broader U.S. economy. The Consumer Price Index (CPI) has consistently ranged between 2% and 3% over the past year, rising 0.3% in June to an annual rate of 2.7%. The unemployment rate slightly decreased to 4.1%, and the U.S. economy added 147,000 jobs, consistent with the ranges observed since early 2024.
1/4


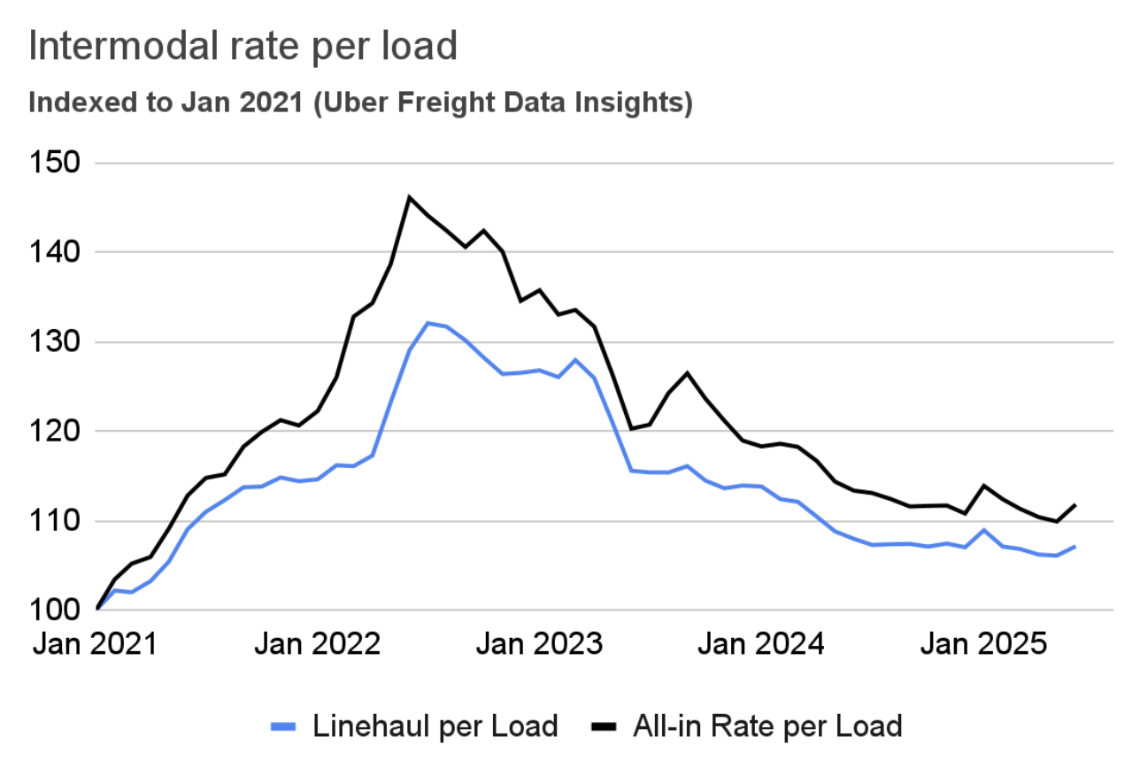
According to Uber Freight’s Intermodal Rate Index, linehaul intermodal rates saw a 1% increase in June. When accounting for a surge in fuel prices, all-in rates rose by a more substantial 1.7%. Despite these gains, both linehaul rates and overall fuel costs remained lower than in the same period last year; the linehaul rate was 0.8% lower year-over-year, and the all-in rate per mile was 1.4% lower. Notably, June's increase in intermodal rates occurred despite weaker volumes. Average weekly intermodal shipments fell 1.2% in June, marking a 0.7% decline year-over-year—the first negative comparison for weekly shipments since January 2024.
2/2
Shipper and carrier insights
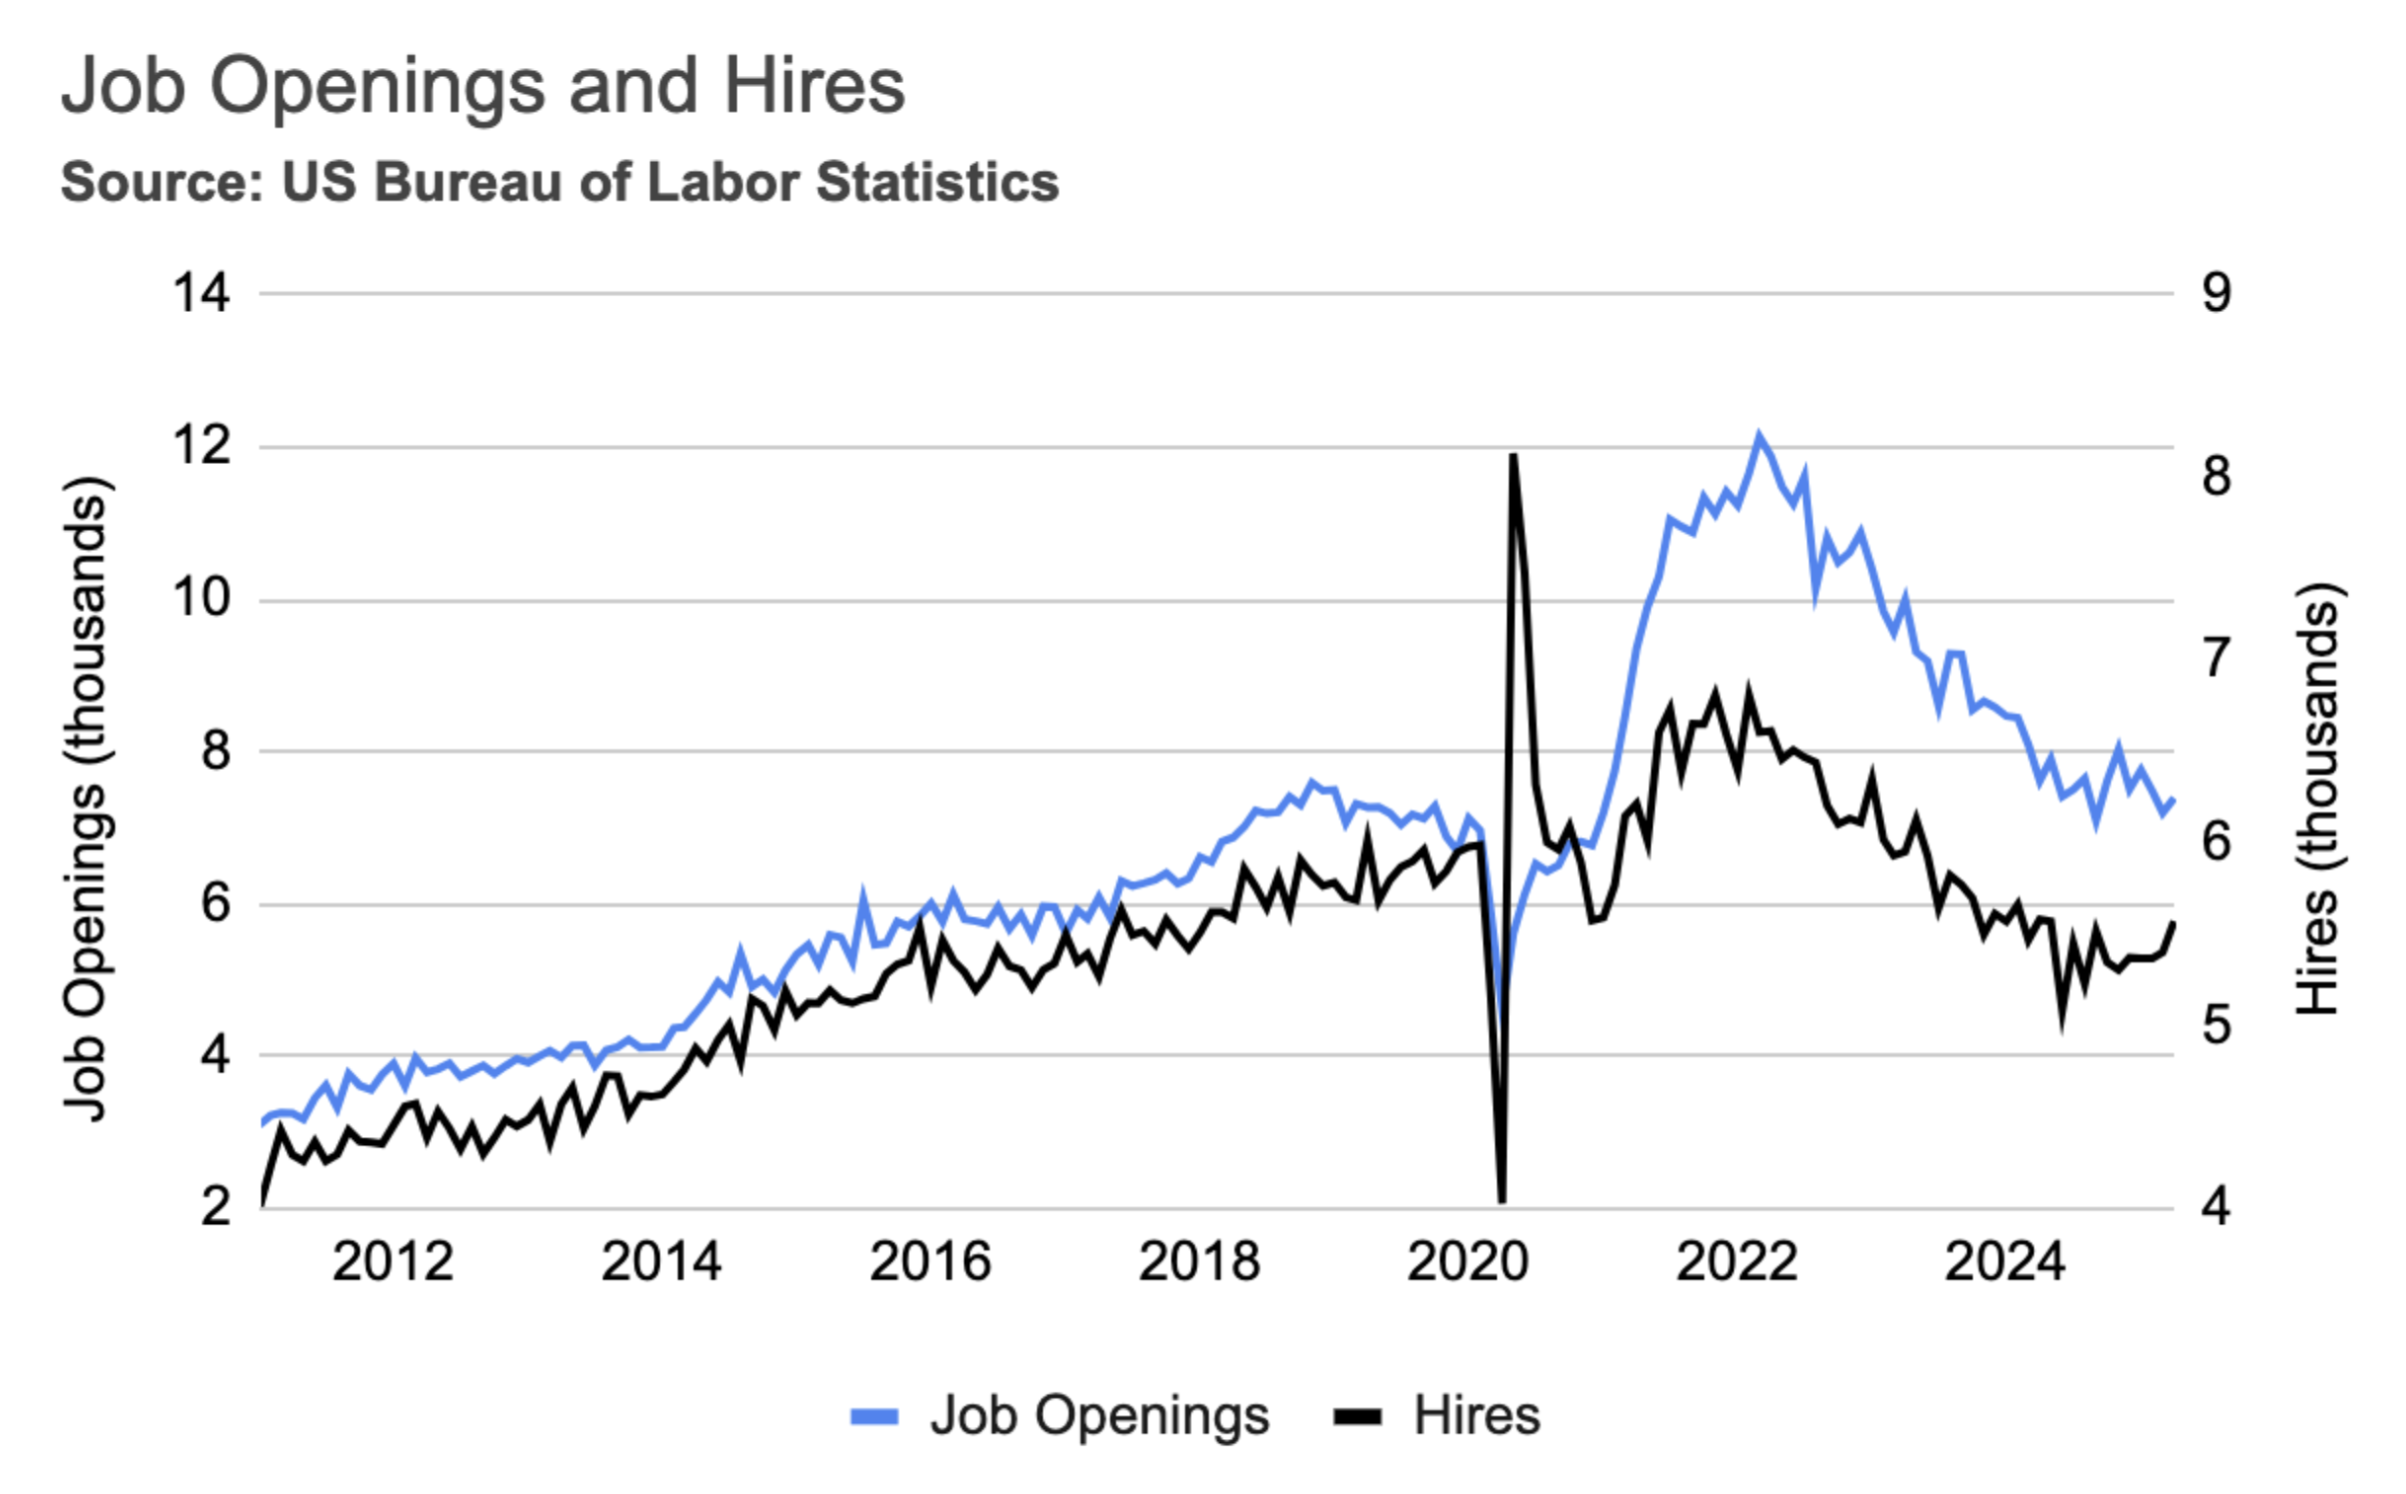
As of July, all indicators point to a consistent labor environment. In June, the unemployment rate slightly decreased to 4.1%, remaining within its range observed since mid-2024. The U.S. economy added 147,000 jobs, also consistent with the range seen since the beginning of 2024. Similar signs of stability emerged from the Job Openings and Labor Turnover (JOLTS) survey: job openings have stabilized around 7,500,000, and new hires have also held steady around 5,500,000 per month.
Labor market
Despite widespread concerns over the inflationary effects of tariffs, the Consumer Price Index (CPI) has ranged between 2% and 3% over the past year. In June, the CPI rose by 0.3%, bringing the annual rate to 2.7%. However, we cannot yet conclude that the risk of inflation is over; both June's monthly increase and the annual inflation rate were the highest since January and February, respectively.
Upstream wholesale prices have also remained stable. The Producer Price Index (PPI) saw no change in June and was 2.4% higher than a year ago. Excluding food and energy, the Core CPI increased by 2.9% year-over-year, while the Core PPI rose by 2.5% year-over-year.

Inflation
In the long run, tariffs might boost domestic freight by giving local manufacturers an edge. However, the magnitude and sudden implementation of tariffs means we probably won't see benefits for a while, and the immediate damage will be greater.
Unlike Canada and Mexico, the 10% percent tariffs on Chinese products went into effect on February 4, and are likely to stay. Tariffs on China were already anticipated by shippers, some of which pulled imports forward in 2024.
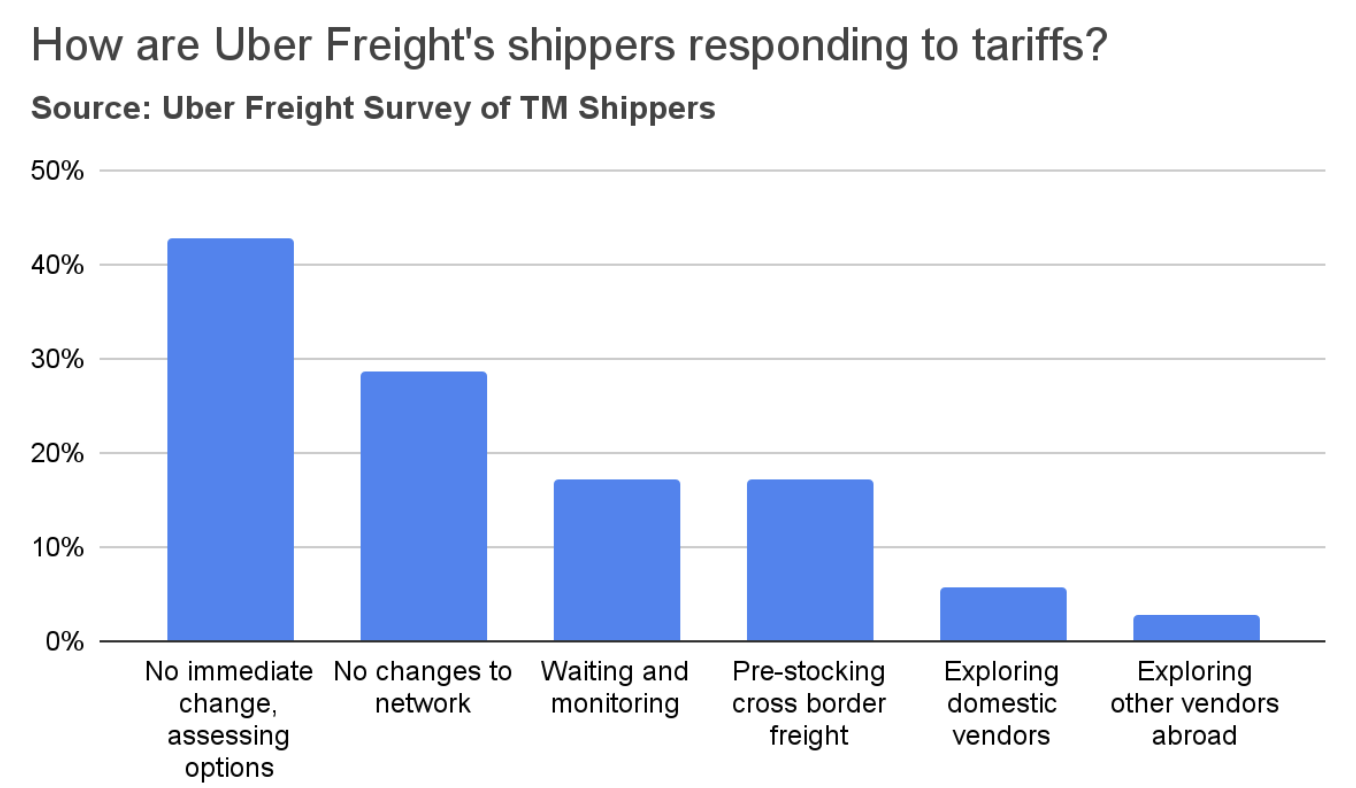
A survey of Uber Freight shippers found that the majority do not foresee immediate changes to their networks. However, a significant minority (42%) are actively assessing various options. Some shippers reported that they anticipate absorbing cost increases and subsequently passing those increases on to their customers. Seventeen percent of shippers indicated they are pre-stocking cross-border inventories. In contrast, very few are exploring domestic alternatives or alternative vendors in countries not impacted by tariffs. Some expressed concerns that it will take several months to adapt their networks.
Housing market


The U.S. manufacturing sector continued to contract in June.
The Institute for Supply Management (ISM) Purchasing Managers' Index (PMI) for June increased to 49.0, though it remained below the 50.0 expansion threshold. The Production Index notably rose above 50.0 for the first time since March, signaling an increase in output. However, both the New Orders and Backlogs indices contracted, pointing to a weakening in future demand. Further concerns emerged from the Prices Index, which remained near 70, indicating persistent inflation in commodity and raw material costs. Additionally, the Employment index dipped to 45.0, suggesting ongoing layoffs within the manufacturing sector.
Manufacturing

The ISM report also highlighted widespread concerns among manufacturers about declining demand and order levels. Respondents across various sectors expressed pessimism about the near-term outlook.
Manufacturing

2/2
Freight supply
Spot and
contract rates

Carrier
population

Supply and demand indices

Driver
employment

In May, truckload demand experienced a slight dip of 0.4%, primarily driven by a decrease in import volumes. Despite this monthly decline, demand notably remained 1.3% above its level from a year ago, largely supported by resilient consumer spending.
Concurrently, supply edged up by 0.4% in May, attributed to an increase in truckload employment. However, this growth was minimal, with supply being only 0.3% higher than in the same period last year.
While the current gap between truckload demand and supply has largely narrowed compared to the levels observed in 2022 and 2023, it's worth noting that the previous year saw little significant movement in either demand or supply.

Truckload supply and demand indices
Trucking jobs shed 2.7K jobs in June, reversing the gains observed in March and April.
June saw an anticipated dip in trucking employment, reflecting the fading post-Memorial Day optimism for a market recovery. However, a surprising counter-trend emerged in May: Long-distance truckload employment surged by 3,700 jobs. This increase was unexpected given the ongoing soft market and likely indicates carriers' early, though ultimately unrealized, optimism for tightening conditions. It remains to be seen if this headcount increase will last, especially as spot rates have recently turned negative year-over-year for the first time in months.
The soft spot market may have presented an opportunity for carriers to expand their workforce at lower wages. Supporting this, the same report indicates that wages in the long-distance truckload sector continued to decline, falling 2.3% year-over-year. This contrasts sharply with a 3.8% increase in wages across other industries over the past 12 months, resulting in a 6% wage growth gap for long-distance truckload drivers compared to other sectors in the economy.

Driver employment
In June, dry van spot rates remained unchanged from May’s level, significantly underperforming seasonal expectations. June’s slight increase of 0.6% was not only weaker than anticipated for the time of year, but it also paled in comparison to last year's gains. As a result, spot rates turned negative year-over-year after a year of modest positive comparisons; van rates saw a 1.8% decline, reefer rates dropped 1.7%, while flatbed rates rose 3.5%. Adding to the overall softness, contract rates for all trailer types also held steady in June, showing little change year-over-year.

Spot and contract rates
Market conditions
Market
conditions
Capacity correction in the truckload market appears to have concluded. Year-to-date, the carrier population has remained flat (growing by only 405 carriers), a significant shift after declines of 9,086 in 2024 and 21,194 in 2023. Similarly, trucking employment has stabilized around pre-pandemic levels, following the shedding of excess capacity in 2023 and 2024.
3/4
Consistent with the broader theme of stability, the carrier population has also stabilized.
Federal Motor Carrier Safety Administration (FMCSA) data for June indicates a slight net decrease of 494 in the carrier population, with 5,502 authority revocations compared to 5,008 authority grants. This follows two months of minor increases in the number of carriers. Year-to-date, the carrier population has grown by 405 carriers, a notable shift after declines of 9,086 in 2024 and 21,194 in 2023. Therefore, both FMCSA and BLS data on trucking employment suggest that capacity correction has likely concluded.

Carrier population
The American Transportation Research Institute (ATRI) released its annual report on truck operating costs. Aside from the notable reduction in fuel costs, which was the result of lower diesel prices, operating costs in 2024 did not see any significant changes from 2023. In 2024, the average operational costs decreased by 0.4%, from $2.270 to $2.260 per mile. Excluding fuel, however, the operational costs of trucking rose by 3.6% to $1.779 per mile—an increase of 6.2 cents per mile over 2023.
Click to jump to section
In the freight market, the gap between truckload demand and supply has largely narrowed compared to 2022 and 2023 levels. Notably, the previous year saw little significant movement in either supply or demand, with the exception of a tariff-driven decrease in imports.
2/4
The U.S. consumer remains supported by a stable labor market.
Industrial production of machinery, primary metals, and fabricated metals has remained relatively flat or slightly declined over the past year. A recovery in these sectors seems unlikely in the near future, as orders and shipments of core capital goods—a key indicator of manufacturing activity—have also stagnated.
Orders for core capital goods, which are nondefense capital goods excluding aircraft, are considered an early indicator of manufacturing activity. Weak orders and shipments in this sector suggest that a broader economic recovery may be delayed.


Despite tariff uncertainty, stability has been the overarching theme across both the freight market and the broader U.S. economy. The Consumer Price Index (CPI) has consistently ranged between 2% and 3% over the past year, rising 0.3% in June to an annual rate of 2.7%. The unemployment rate slightly decreased to 4.1%, and the U.S. economy added 147,000 jobs, consistent with the ranges observed since early 2024.
1/4
Industrial equipment and supplies
Automotive
Auto manufacturing has been one of the bright spots in the economy over the past year, driven by pent-up demand and a shortage of vehicles at dealerships. While production rose to meet demand, the market is starting to show signs of saturation, with inventories gradually normalizing and potential glut looming on the wholesale side.


Paper and plastics
Paper and plastics are highly used in the packaging industry, which has been affected by the recent slowdown in food spending after the economy re-opened. In addition, the demand for paper products was already on a downward trajectory due to factors such as digitalization, adoption of alternatives (plastics), and growth of e-commerce. The pandemic further accelerated this decline. Moreover, a surge in downstream inventories led to a slowdown in manufacturers’ demand.


Nondurable consumer goods
Demand for food consumed at home fell from its pandemic highs as the economy re-opened, normalizing back to its pre-pandemic levels. Demand for other consumer goods (such as apparel) continues to be pressured by external competition, slowing consumer demand, and high downstream inventories.


Durable consumer goods
Durable consumer goods such as appliances, furniture, and wood products are affected by the ongoing housing recession. New home sales remain below the 2019 levels, and about 30% below the pandemic peak. Similarly, housing starts are at their lowest level since the beginning of the housing recession, 32% below the 2022 peak.


Inflation has largely stabilized, hovering slightly above the Federal Reserve's target.
New tariff announcements and deals have increased the average tariff rate.


The U.S. housing market has also been moving sideways.
Indicators such as new housing starts, building permits, and new home sales have all exhibited stability since 2023, despite some month-over-month volatility. However, while stability is a positive sign for the labor market and inflation, it is less desirable in the housing sector, as it suggests a lack of recovery. This persistent stagnation in housing is largely attributed to stable mortgage rates, with the 30-year rate mostly hovering between 6% and 7% since the fourth quarter of 2022.

Housing market
Short-term outlook
July typically marks a transition in the spot market, with the winding down of summer harvests in the South while market tightness gradually extends northward. While most southern regions generally still experience tight market conditions due to lingering produce volumes, northern regions tend to remain relatively soft.
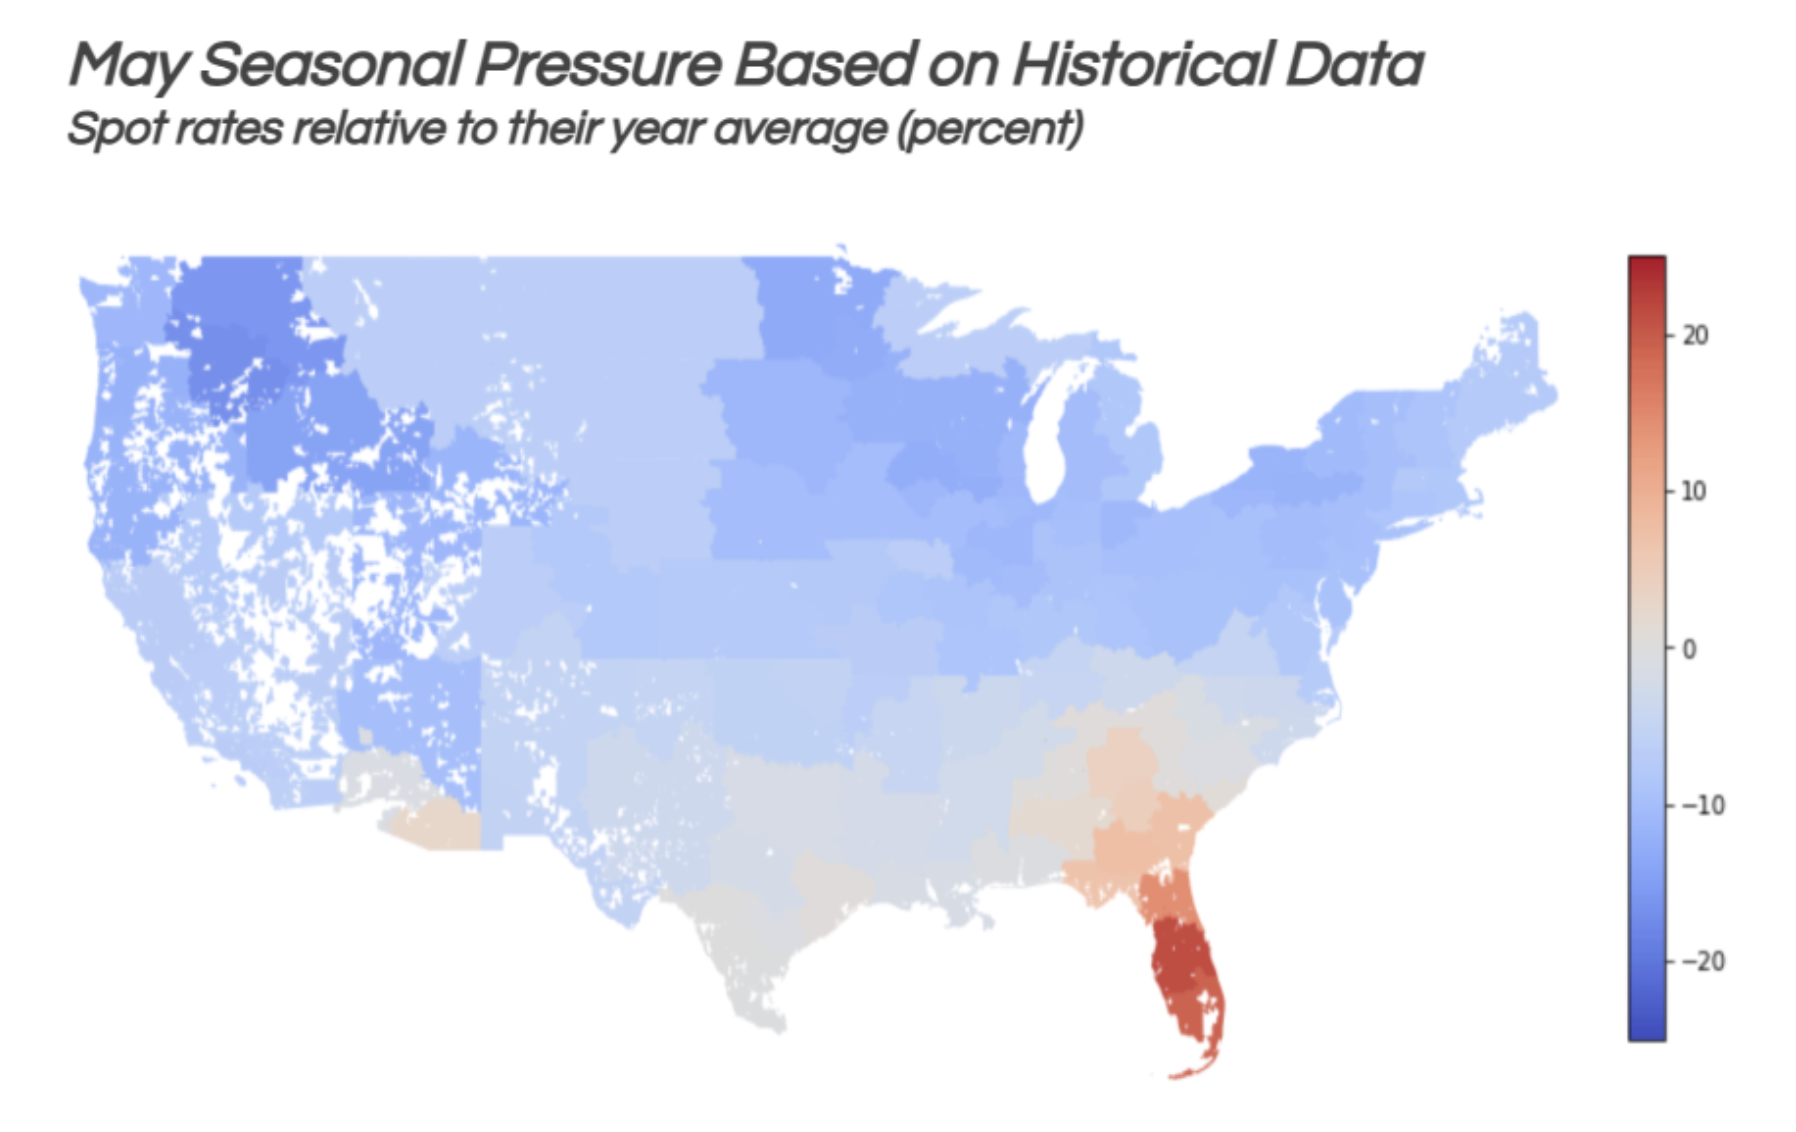

This northbound shift in market tightness usually continues through September. Southern markets are typically observed to cool down in August and September as their peak produce season concludes. Conversely, northern markets begin to tighten as shippers proactively stock inventories in preparation for the upcoming peak season.
However, this year stands apart from the usual pattern; the anticipated 5% to 8% rise in national spot rates, which is a common occurrence between April and July, has not fully materialized. This indicates a softer than expected market despite typical seasonal trends.

However, stability was not what carriers had hoped for. In June, dry van spot rates increased by a mere 0.6%, significantly underperforming seasonal expectations. This increase was not only weaker than anticipated for the time of year but also paled in comparison to last year's gains.
4


3/3
While tariffs have negatively impacted U.S. manufacturing so far, a positive long-term effect is anticipated, with the Yale Budget Lab expecting a 2.6% increase in manufacturing GDP. However, the long-term effect on total freight demand remains unclear. Tariffs are projected to reduce GDP in agriculture and construction by 0.8% and 4.1% respectively, and these sectors also contribute significantly to freight demand.

While capacity remained mostly unchanged from last year, the report offered significant insights into utilization. Average annual truck mileage increased for a second consecutive year, from 80,159 in 2023 to 82,677 in 2024, reversing a multi-year period of decline. Furthermore, trucks operated an average of 268 days per year, a substantial increase from 243 days in 2023. This indicates an effective increase in available capacity despite the stagnation in driver employment and available equipment, which explains the persistent soft market.
The report also indicated that the average truck age continued to fall in 2024, reaching 3.4 years from 3.8 years in 2023. Similarly, the average truck replacement cycle decreased slightly in 2024, from 7.5 years to 7.3 years. These reductions reflect the ongoing deliveries of trucks purchased aggressively in 2023, a response to the shortages and delays experienced during the COVID-19 pandemic. When carriers acquire new trucks, they often release older models into the second-hand market, which in turn indirectly also increases overall trucking capacity.
While carrier operating costs have remained largely flat over the past year, both spot and contract rates have fallen by 2% year-over-year, significantly eroding carrier profitability. Small carriers, who predominantly rely on the spot market, are struggling the most, with rates still approximately 20% below their operating costs. More recently, contract rates have also dipped below cost levels, indicating that even larger, typically more stable contracted carriers are now operating at zero or slightly negative margins.

However, stability was not what carriers had hoped for. In June, dry van spot rates increased by a mere 0.6%, significantly underperforming seasonal expectations. This increase was not only weaker than anticipated for the time of year but also paled in comparison to last year's gains.
4/4
3/3
While tariffs have negatively impacted U.S. manufacturing so far, a positive long-term effect is anticipated, with the Yale Budget Lab expecting a 2.6% increase in manufacturing GDP. However, the long-term effect on total freight demand remains unclear. Tariffs are projected to reduce GDP in agriculture and construction by 0.8% and 4.1% respectively, and these sectors also contribute significantly to freight demand.

While capacity remained mostly unchanged from last year, the report offered significant insights into utilization. Average annual truck mileage increased for a second consecutive year, from 80,159 in 2023 to 82,677 in 2024, reversing a multi-year period of decline. Furthermore, trucks operated an average of 268 days per year, a substantial increase from 243 days in 2023. This indicates an effective increase in available capacity despite the stagnation in driver employment and available equipment, which explains the persistent soft market.
The report also indicated that the average truck age continued to fall in 2024, reaching 3.4 years from 3.8 years in 2023. Similarly, the average truck replacement cycle decreased slightly in 2024, from 7.5 years to 7.3 years. These reductions reflect the ongoing deliveries of trucks purchased aggressively in 2023, a response to the shortages and delays experienced during the COVID-19 pandemic. When carriers acquire new trucks, they often release older models into the second-hand market, which in turn indirectly also increases overall trucking capacity.
While carrier operating costs have remained largely flat over the past year, both spot and contract rates have fallen by 2% year-over-year, significantly eroding carrier profitability. Small carriers, who predominantly rely on the spot market, are struggling the most, with rates still approximately 20% below their operating costs. More recently, contract rates have also dipped below cost levels, indicating that even larger, typically more stable contracted carriers are now operating at zero or slightly negative margins.
Van spot rates
turned negative
year-over-year after a
year of modest positive comparisons.