The Freight Economist
June 2025
Executive summary
Monthly economic and market update
Seasonally
adjusted container
imports fell 15%
in May.
U.S. economy
Tarrifs
Consumer spending
Labor market


Freight demand
Imports
Truck
tonnage
Manufacturing
Spending
on goods


U.S. container imports experienced a notable decline in May.
Imports fell 9.7% from April and 7.2% year-over-year. U.S. ports processed only 2,177,453 twenty-foot equivalent units (TEUs), marking the lowest monthly total since March 2024. On a seasonally adjusted basis, the month-over-month drop is even sharper, at approximately 15%. Imports from China were particularly affected, seeing a 20.8% decrease from April and a substantial 28.5% decline year-over-year. Despite recent tariff reductions and pauses, the majority of May's imports were booked at the higher tariff rates during April, according to Descartes.
Imports

What does it mean for truck tonnage?
Spending on goods
Key data points and commentary
Trucking
volume

Intermodal
rates

Geographic
trends

Routing guide trends

Routing guide trends
Geographic trends

Trucking volume
Freight volume indicators have been moving sideways. The Cass Freight Shipments Index rose 0.3% in April, but remained down 3.6% year-over-year. Pre-buying may have contributed to April's increase, despite negative sentiment preceding the trade deal. Conversely, the American Trucking Associations (ATA) For-Hire Truck Tonnage Index declined 0.3% in April after a 1.5% drop in March, but still showed a 0.1% increase from the previous year. ATA attributed these decreases to tariffs and softer economic indicators.
Intermodal rates
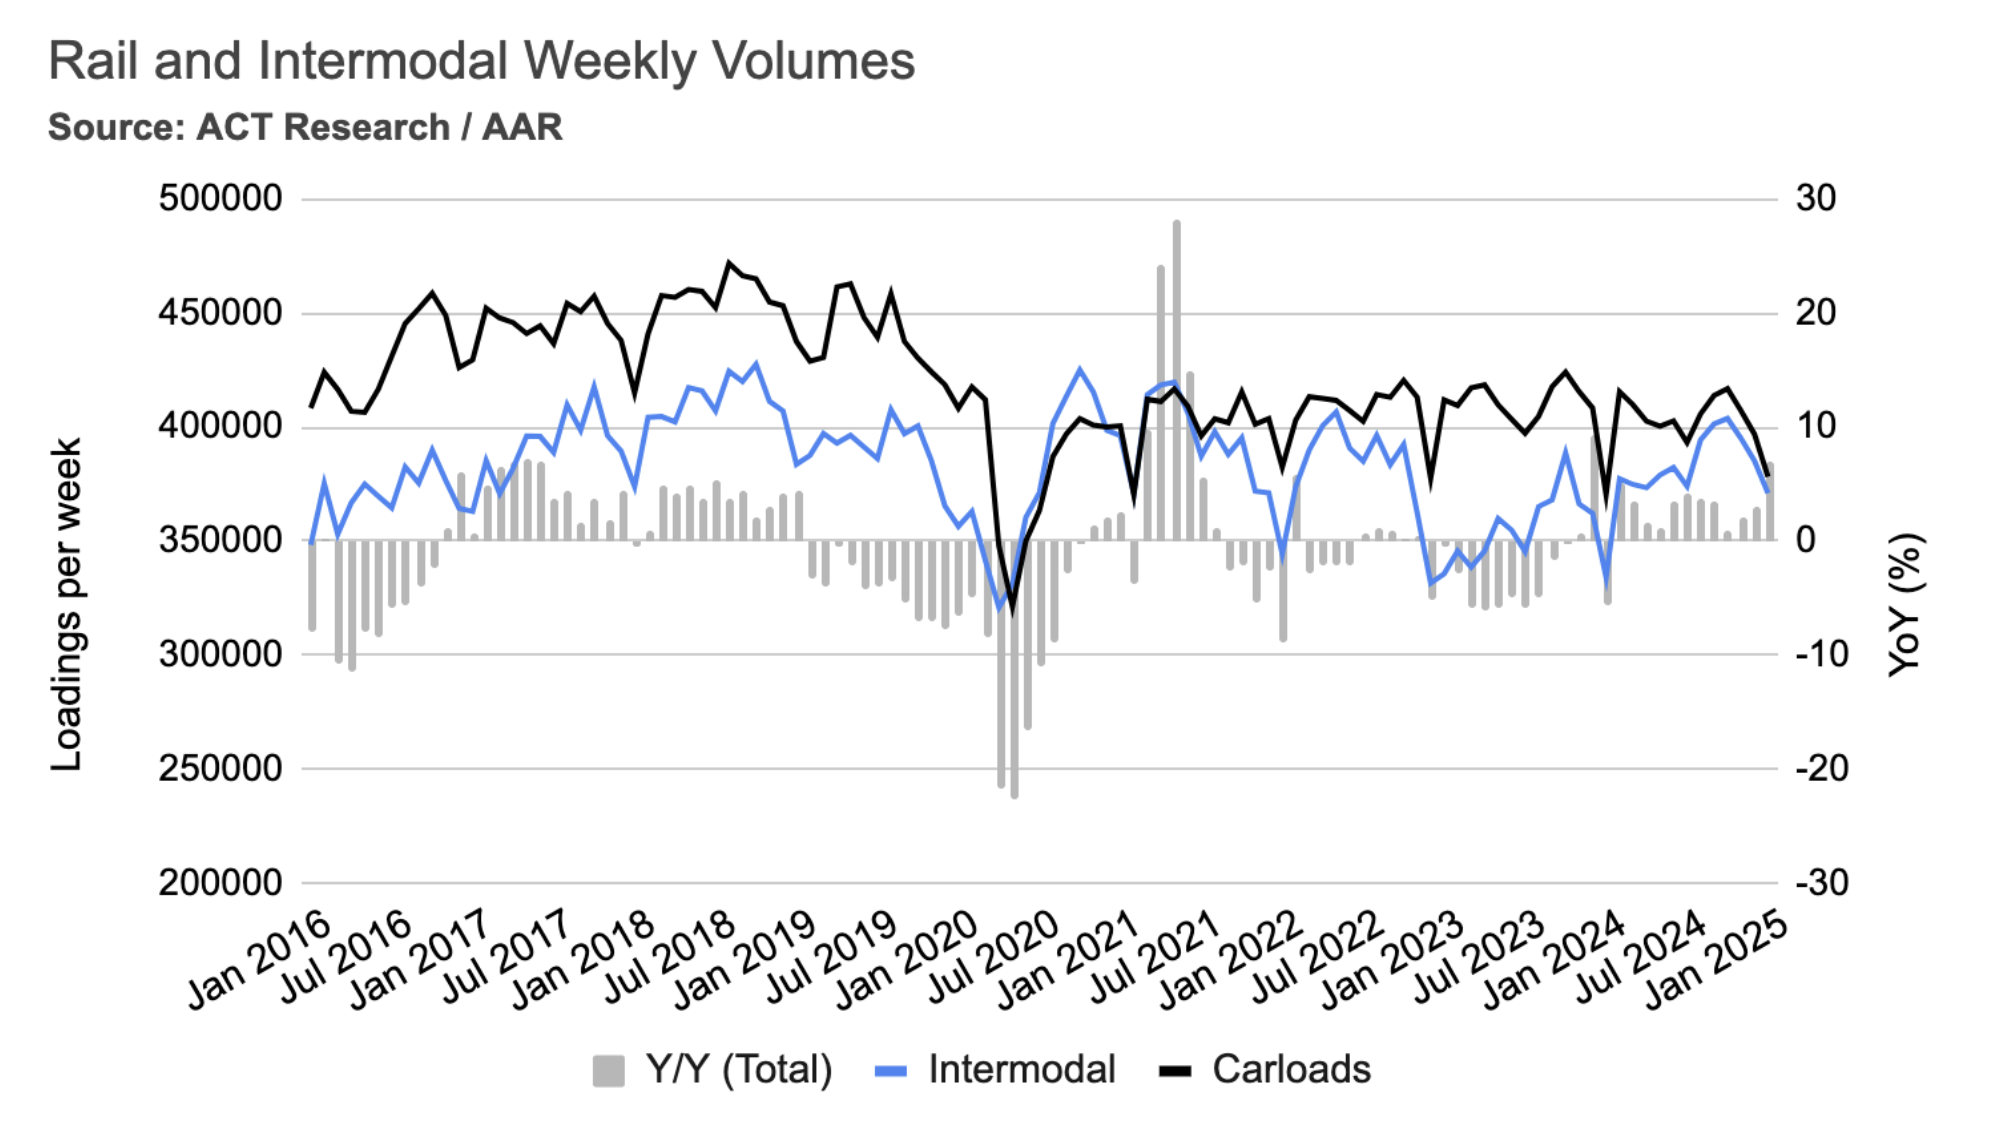
In January, average weekly intermodal loads decreased by 3.7%, and weekly carloads dropped by 4.7%. However, compared to the same time last year, intermodal volumes were significantly higher, up 11%, and carloads increased by 2.1%. It's worth noting that this January's declines were less severe than those of the previous year, which saw 7.7% and 9.3% reductions in intermodal and carload loadings, respectively.
Mazen’s work focuses on analyzing the freight transportation landscape, and producing short- and long-term forecasts based on supply and demand dynamics. He is also a research affiliate with the Intelligent Transportation Systems (ITS) Lab at MIT, where he completed his PhD in 2019. His work falls at the intersection of ITS, economic modeling, and analytics.
mdanaf@uberfreight.com
By Mazen Danaf, Senior Economist and Applied Scientist, Uber Freight
Featuring insights and contributions from Uber Freight leadership,
technologists and market specialists.


The first tender acceptance rate held steady at 93% last month. However, in the second half of May, tender acceptance rates dipped by 2% to 3% as the market tightened due to the produce season, DOT Week, and Memorial Day. Route Guide compliance also saw a slight decrease, falling from 95% to 94%. Shippers experienced limited financial impact, however. When tenders were rejected, the average cost over the primary carrier rose marginally from 1% to 1.3%. While these figures are slightly worse than last month's, they still point to a continued shipper-friendly market.
According to the Yale Budget Lab, the 2025 tariffs, after accounting for shifts in import sourcing (post-substitution), represent a 12.1% increase in the average effective U.S. tariff rate. This elevates the overall U.S. effective tariff rate to 14.5%, marking its highest point since 1938. Uber Freight's analysis suggests this could lead to a 2.5% reduction in truckload volumes over the next year.
These 2025 tariffs are projected to cause a 1.5% increase in consumer prices in the short term. This is equivalent to an average loss of $2,500 in household purchasing power (pre-substitution, in 2024 dollars). Post-substitution, the price increase is expected to settle at 1.3%, resulting in an average loss of $2,100 per household.


Executive
summary
U.S.
economy
Freight
demand
Freight
supply
Tariffs
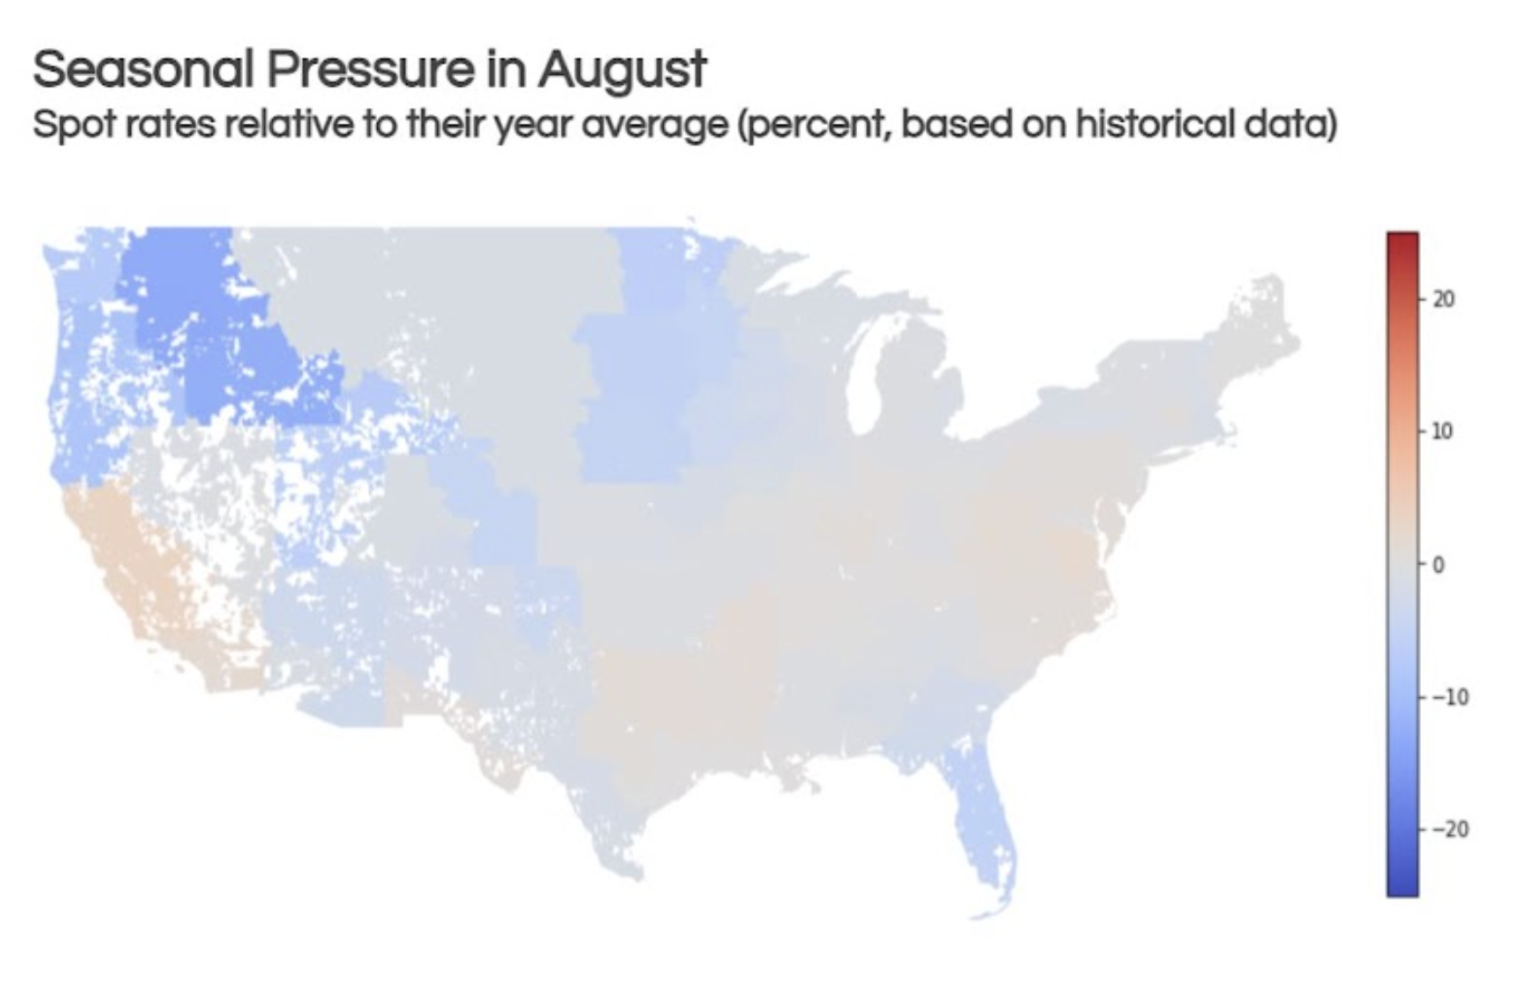
Average m/m and y/y van spot rate index by destination regions – August
Source: DAT

Consistent with seasonal expectations, outbound spot rates saw a significant surge in the South, increasing by 10.9% for shipments originating from the Southeast and 3.7% for those from the West. These are the two regions where summer produce volumes typically begin to emerge. Meanwhile, rates in the Northeast and the Midwest remained largely flat. Compared to year-ago levels, the Northeast experienced the most substantial increase at 7.9%, whereas rates from the West saw a slight year-over-year drop of 0.9%. This decline in Western rates could be attributed to negative sentiment and weaker volumes affecting California's ports following the recent announcements of tariffs.
Key data
points
Shipper and carrier insights: Chemical edition
The chemicals sector has been a bright spot in the economy.
Spending remained resilient despite a small dip in April.
Real personal spending on goods decreased by 0.2% in April, though it remained 4.4% higher year-over-year, suggesting ongoing consumer resilience. The April decline was primarily driven by durable goods, where spending fell by 0.8% as consumers reduced expenditures on automobiles, furniture, and appliances, potentially influenced by tariffs. This dip was relatively minor, however, as durable goods spending had increased by 3.8% in March and remains 6.8% higher year-over-year. Spending on non-durable goods saw a modest increase of 0.1% in April, and was 3.2% higher year-over-year.
Inflation

Retail and food service sales climbed 1% in July, primarily boosted by a 3.6% surge in motor vehicle and parts dealers. Excluding this sector, sales edged up 0.4% from the previous month and were 3.1% higher compared to the same time last year. Importantly, this sales growth outpaced the rate of inflation for goods, which actually decreased over the past 12 months.

2/2
Truckload demand was weak in April.
Retail-driven demand remained flat, showing no growth or decline. In contrast, manufacturing-driven demand experienced a slight dip, falling by 0.6%. Compared to the previous year, consumer demand was up by 2.5%. However, manufacturing demand lagged, down by 0.3%. A temporary boost came from wholesale demand, which saw a 0.3% increase due to pre-stocking activities. This surge is likely short-lived, as both upstream (manufacturing) and downstream (retail) sales were weak.


1/2
2/2
As of early June, the 2025 tariffs represent a 12.1% increase in the average effective U.S. tariff rate, pushing the overall rate to 14.5%—its highest since 1938. These tariffs are already causing the manufacturing sector to contract and are projected to lead to a 1.3% increase in consumer prices. While tariffs are expected to have negative impacts, consumer spending, inflation, and the labor market are all starting from a place of relative strength.
1/3


Intermodal rates declined by 0.1% in May, essentially remaining flat. Excluding fuel costs, the decrease was 0.5%, and rates were down 2.5% to 4% year-over-year. Historically, intermodal rates lag truckload rates by a quarter. With truckload contract rates remaining flat, intermodal rates are likely near the bottom. Significant increases in intermodal rates are also unlikely until truckload rates recover. Despite tariff uncertainty, intermodal volumes in the U.S. remained about 5% higher year-over-year in May.

2/2
Shipper and carrier insights
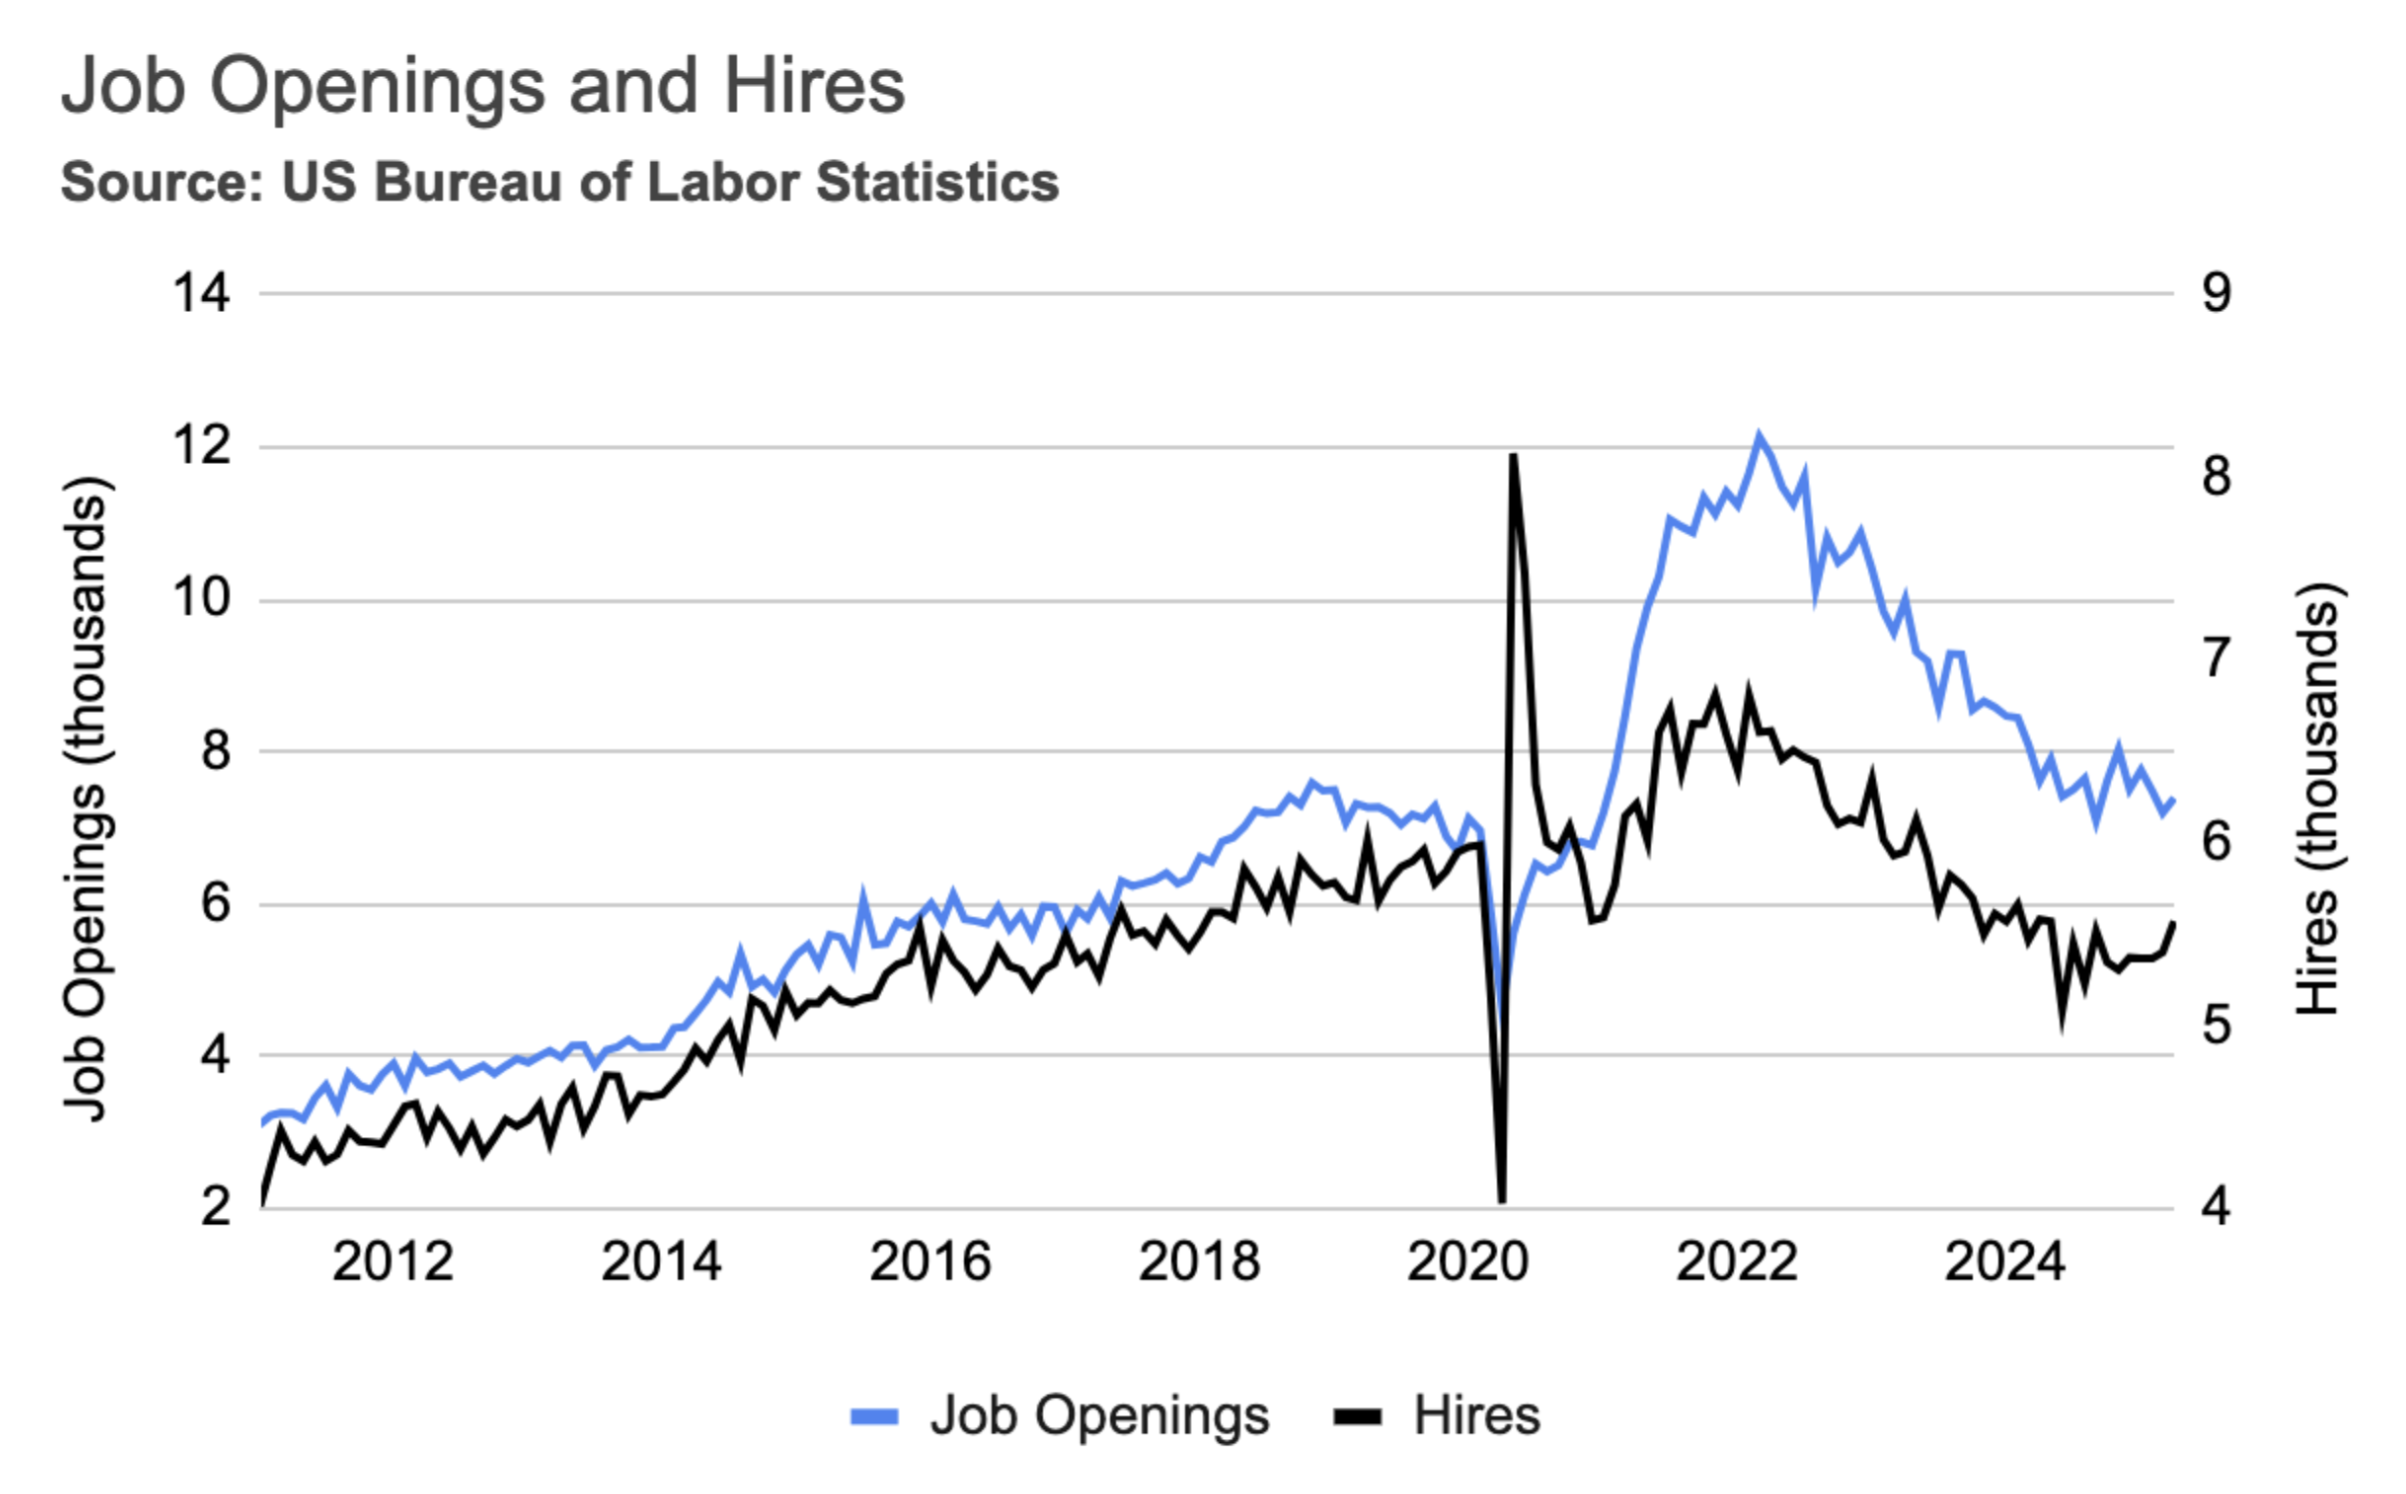
Despite the negative sentiment surrounding tariffs, both hires and job openings increased in April. Job openings rose by 2.7% but remained 3% below last year's level, while actual hires increased by 3.1%, staying flat year-over-year. Although the JOLTS survey indicated a rise in layoffs from 1.59% to 1.79%, this figure aligns with levels observed in previous months and does not signal a cause for concern. Similarly, the unemployment rate in June remained unchanged at 4.2%.
Labor market
While the Budget Lab anticipates an average price increase of 1.3% due to tariffs, the inflation landscape, much like the U.S. consumer, is starting from a position of relative strength. As of April, price inflation, as measured by the Federal Reserve's preferred PCE Price Index, has nearly subsided to its 2% target, registering only a 2.1% increase year-over-year. Excluding the more volatile food and energy sectors, prices rose 2.5% year-over-year, marking the lowest rate since March 2021. Furthermore, goods—the sector expected to see the most significant price increases from tariffs—are actually experiencing deflation as of April, with durable goods prices down 0.3% year-over-year and nondurable goods prices down 0.4% year-over-year.

Inflation
In the long run, tariffs might boost domestic freight by giving local manufacturers an edge. However, the magnitude and sudden implementation of tariffs means we probably won't see benefits for a while, and the immediate damage will be greater.
Unlike Canada and Mexico, the 10% percent tariffs on Chinese products went into effect on February 4, and are likely to stay. Tariffs on China were already anticipated by shippers, some of which pulled imports forward in 2024.
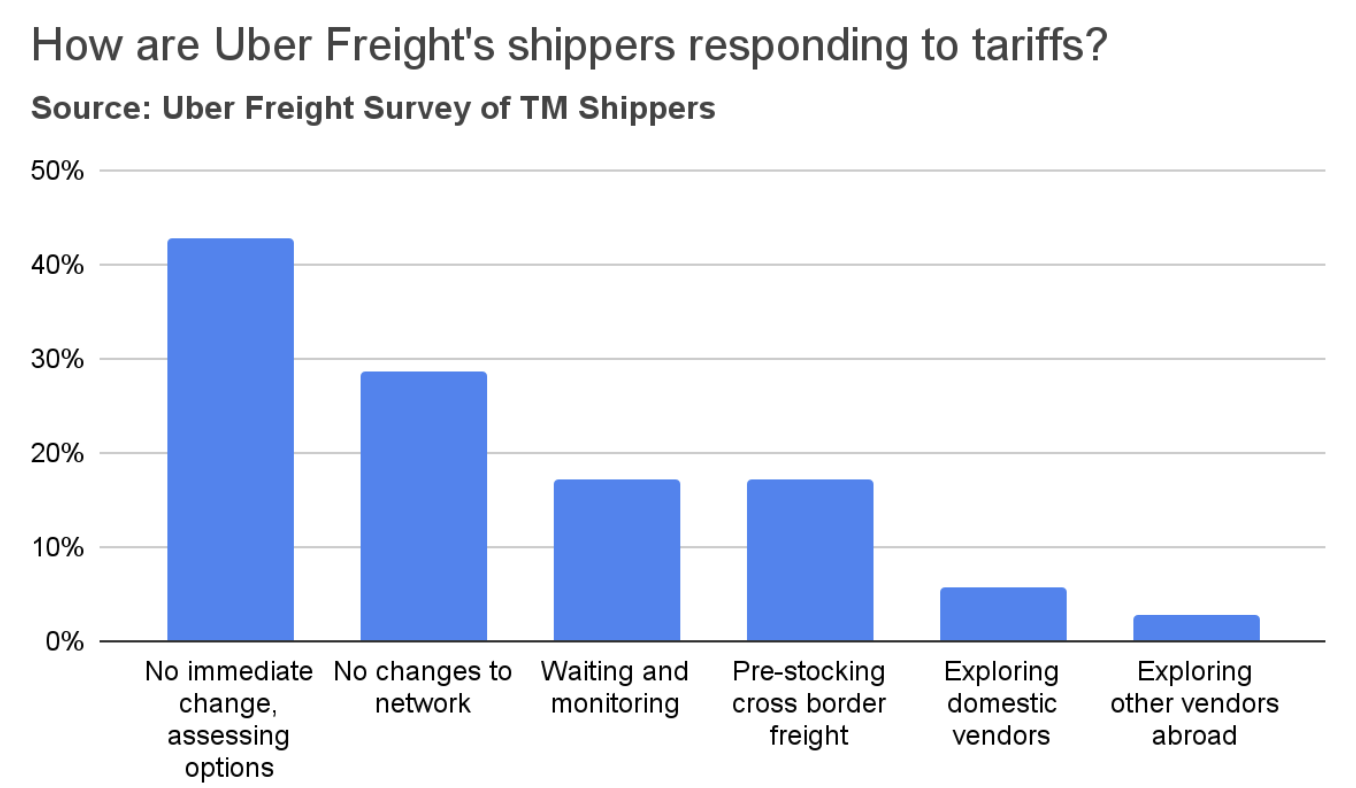
A survey of Uber Freight shippers found that the majority do not foresee immediate changes to their networks. However, a significant minority (42%) are actively assessing various options. Some shippers reported that they anticipate absorbing cost increases and subsequently passing those increases on to their customers. Seventeen percent of shippers indicated they are pre-stocking cross-border inventories. In contrast, very few are exploring domestic alternatives or alternative vendors in countries not impacted by tariffs. Some expressed concerns that it will take several months to adapt their networks.
Consumer spending


The U.S. manufacturing sector continued to contract.
The ISM PMI decreased to 48.5 in May, signaling a third consecutive month of contraction in the manufacturing sector. The Production index remained below the 50.0 expansion threshold, indicating ongoing contraction. Similarly, the New Orders and Backlogs indices were below 50, suggesting a weakening of future demand. Notably, the Imports iIndex experienced a sharp decline to its lowest level since June 2009 as manufacturers halted or paused imports in response to tariffs. Conversely, the Prices iIndex remained elevated, near its highest level since mid-2022, reflecting persistent inflationary pressures for manufacturers.
Manufacturing

The ISM report also highlighted widespread concerns among manufacturers about declining demand and order levels. Respondents across various sectors expressed pessimism about the near-term outlook.
Manufacturing

2/2
Freight supply
Spot and
contract rates

Tractor orders

Supply and demand indices

Driver
employment

After surging in March, truckload demand dipped 0.2% in April, primarily due to weaker manufacturing output, consumer spending, and imports. April marked the first month impacted by tariffs; however, this effect was largely offset by pre-stocking, which boosted wholesalers' sales. Consequently, the overall drop in demand was slight. Early May indicators suggest a significant decline in import demand, potentially leading to a sharper fall than seen in April. Meanwhile, supply rose 0.1% in April, but remained 0.2% below its level from a year ago.

Truckload supply and demand indices
Trucking jobs remain steady amid market uncertainty.
While carriers are holding back on placing equipment orders, they are maintaining a steady headcount. Trucking employment has been moving sideways, showing no significant upward or downward trend, apart from a 0.5% increase in March. In May, employment fell by 0.1%, precisely offsetting April's 0.1% rise. Notably, trucking employment turned positive year-over-year (up 0.2%) for the first time since March 2023, indicating that capacity correction may have already run its course. Within the long-distance truckload sector, employment rose 0.3% in April but remained 0.6% below its year-ago level.

Driver employment
The spot market hit its lowest point in April before experiencing the usual seasonal surge in the second half of May. During this period, van spot rates increased by roughly 10%, mirroring last year's trend. Consequently, spot rates ended up about 2% to 3% above their year-ago levels.
Meanwhile, van and reefer contract rates saw minimal change. Flatbed contract rates, however, continued their ascent following a surge in spot rates over the past few months. When compared to year-ago figures, reefer rates have lagged, remaining flat, while flatbed rates have performed well with a 6.5% increase.

Spot and contract rates
Market conditions
Market
conditions
The freight market has recently seen an uptick in rates propelled by seasonality. Nevertheless, when adjusted for seasonal factors, both rates and volumes continue to move sideways. The spot market hit its seasonal low in April, followed by a typical surge in the second half of May. During this period, van spot rates increased by roughly 10%, mirroring last year's trend, and consequently finished 2% to 3% above their year-ago levels. Meanwhile, van and reefer contract rates saw minimal change.
3/3
Carriers cannot plan their capital expenses amid tariff uncertainty.
Dry van trailer orders plummeted in May to just 3,780 units, marking a significant 47% year-over-year decrease and a dramatic 71% drop from April. Notably, April's net orders were the lowest since 2020. Sales and production also experienced substantial year-over-year declines of 30% and 32%, respectively. Similarly, sleeper tractor orders fell to 2,224 units in May, their lowest level since April 2020.
Sustained low order levels could signal future capacity tightening, but this typically unfolds over time. There's generally a six-month lag between the ordering and delivery of tractors and trailers, followed by another four months before those deliveries impact freight rates.

Tractor orders
Current Procurement Headlines
Bid Activity
• Annual full-network RFP events remain the standard, with supplemental mini-RFPs used to support the route guide between bid cycles as needed.
• We have observed a slightly extended RFP season. While event volume has been mostly flat, some shippers started RFPs earlier in Q4 and Q1.
Strategic Trends
• Most shippers are aiming to retain their incumbent carriers through the RFP cycle, but are prepared to make shifts if necessary.
• Two-round bidding events continue to be a best practice. The second round, which includes expressive feedback, is a key driver of additional rate compression, depending on how competitive a carrier was after the first round.
• When preparing to release RFPs, volume cutoffs remain a crucial strategic discussion. This involves deciding on a low-volume strategy for ensuring adequate coverage and securing backup carriers.
Carrier Behavior
• Truckload (TL) carriers are still broadly participating in bids but are beginning to prioritize preferred volumes over simply acquiring any available freight.
• Mixed carrier earnings and shifting RFP dynamics have prompted carriers to seek replacing lost freight in Q2 quickly.
• Brokers remain aggressive in their efforts to capture market share, though fewer shippers are accepting their rates.
• Incumbent carriers are attempting to maintain their positions in RFPs. Some are even pushing for price increases, albeit with limited success.
Carrier Pricing in Q2
• RFP pricing has been flat over the last 3 quarters.
Best Practices for 2025
Carrier Management
• Establish strategic relationships with key providers in your network.
• Create symbiotic, long-term goals with key partners.
• Partner with carriers on company initiatives around technology, best practices, and ease of doing business.
• Develop formal processes to address service and performance improvement plans.
Navigating Volatility
• Understand where your rates are relative to the market.
• Work with your carriers to understand their networks and cost pressures.
• Work with strategic carriers to achieve cost and price transparency within your network and develop an action plan for out-of-process lanes.
• Maintain close communication with your incumbent carriers on critical lanes to monitor price trends and capacity changes.
• Understand your carrier base's tracking and technology capabilities and establish clear expectations.
• Routing Guide setup becomes increasingly critical in a tightening market, emphasizing elements such as backup carriers and low-volume strategies.
Click to jump to section
However, amid uncertainty, carriers are maintaining their headcount but are reluctant to place orders for tractors and trailers. Orders are currently at their lowest levels since April/May 2020. While short-term capacity remains stable, if low tractor and trailer orders persist, it could result in market tightening several months down the line.
2/3
The labor market remains relatively stable despite tariff uncertainty.
Industrial production of machinery, primary metals, and fabricated metals has remained relatively flat or slightly declined over the past year. A recovery in these sectors seems unlikely in the near future, as orders and shipments of core capital goods—a key indicator of manufacturing activity—have also stagnated.
Orders for core capital goods, which are nondefense capital goods excluding aircraft, are considered an early indicator of manufacturing activity. Weak orders and shipments in this sector suggest that a broader economic recovery may be delayed.


As of early June, the 2025 tariffs represent a 12.1% increase in the average effective U.S. tariff rate, pushing the overall rate to 14.5%—its highest since 1938. These tariffs are already causing the manufacturing sector to contract and are projected to lead to a 1.3% increase in consumer prices. While tariffs are expected to have negative impacts, consumer spending, inflation, and the labor market are all starting from a place of relative strength.
1/3
Industrial equipment and supplies
Automotive
Auto manufacturing has been one of the bright spots in the economy over the past year, driven by pent-up demand and a shortage of vehicles at dealerships. While production rose to meet demand, the market is starting to show signs of saturation, with inventories gradually normalizing and potential glut looming on the wholesale side.


Paper and plastics
Paper and plastics are highly used in the packaging industry, which has been affected by the recent slowdown in food spending after the economy re-opened. In addition, the demand for paper products was already on a downward trajectory due to factors such as digitalization, adoption of alternatives (plastics), and growth of e-commerce. The pandemic further accelerated this decline. Moreover, a surge in downstream inventories led to a slowdown in manufacturers’ demand.


Nondurable consumer goods
Demand for food consumed at home fell from its pandemic highs as the economy re-opened, normalizing back to its pre-pandemic levels. Demand for other consumer goods (such as apparel) continues to be pressured by external competition, slowing consumer demand, and high downstream inventories.


Durable consumer goods
Durable consumer goods such as appliances, furniture, and wood products are affected by the ongoing housing recession. New home sales remain below the 2019 levels, and about 30% below the pandemic peak. Similarly, housing starts are at their lowest level since the beginning of the housing recession, 32% below the 2022 peak.


Inflation is nearing the Fed's target.
The U.S. consumer has not felt the impact of tariffs yet.


On the positive side, the U.S. consumer remained in a solid financial position as of April.
Consumers continue to demonstrate healthy income and spending growth. In April, real consumer spending, adjusted for inflation, rose 0.1% and was 3.2% higher year-over-year, consistent with annual growth levels observed over the past year. Consumers also saved 4.9% of their income in April, an increase from 4.3% in March, though slightly down from the 5.1% recorded in April 2024.
Overall consumer spending remains supported by income growth, with real income rising by 0.7% in April and showing a 2.9% increase year-over-year. This April increase followed another 0.7% rise in March, marking these as the largest increases since January 2024.

Consumer spending
Short-term outlook
Spot rates typically experience a rapid increase from late May into early June, particularly in Southern markets like Florida, California, Texas, and Arizona. In contrast, Northern markets tend to remain relatively soft during this period.
Short-term outlook
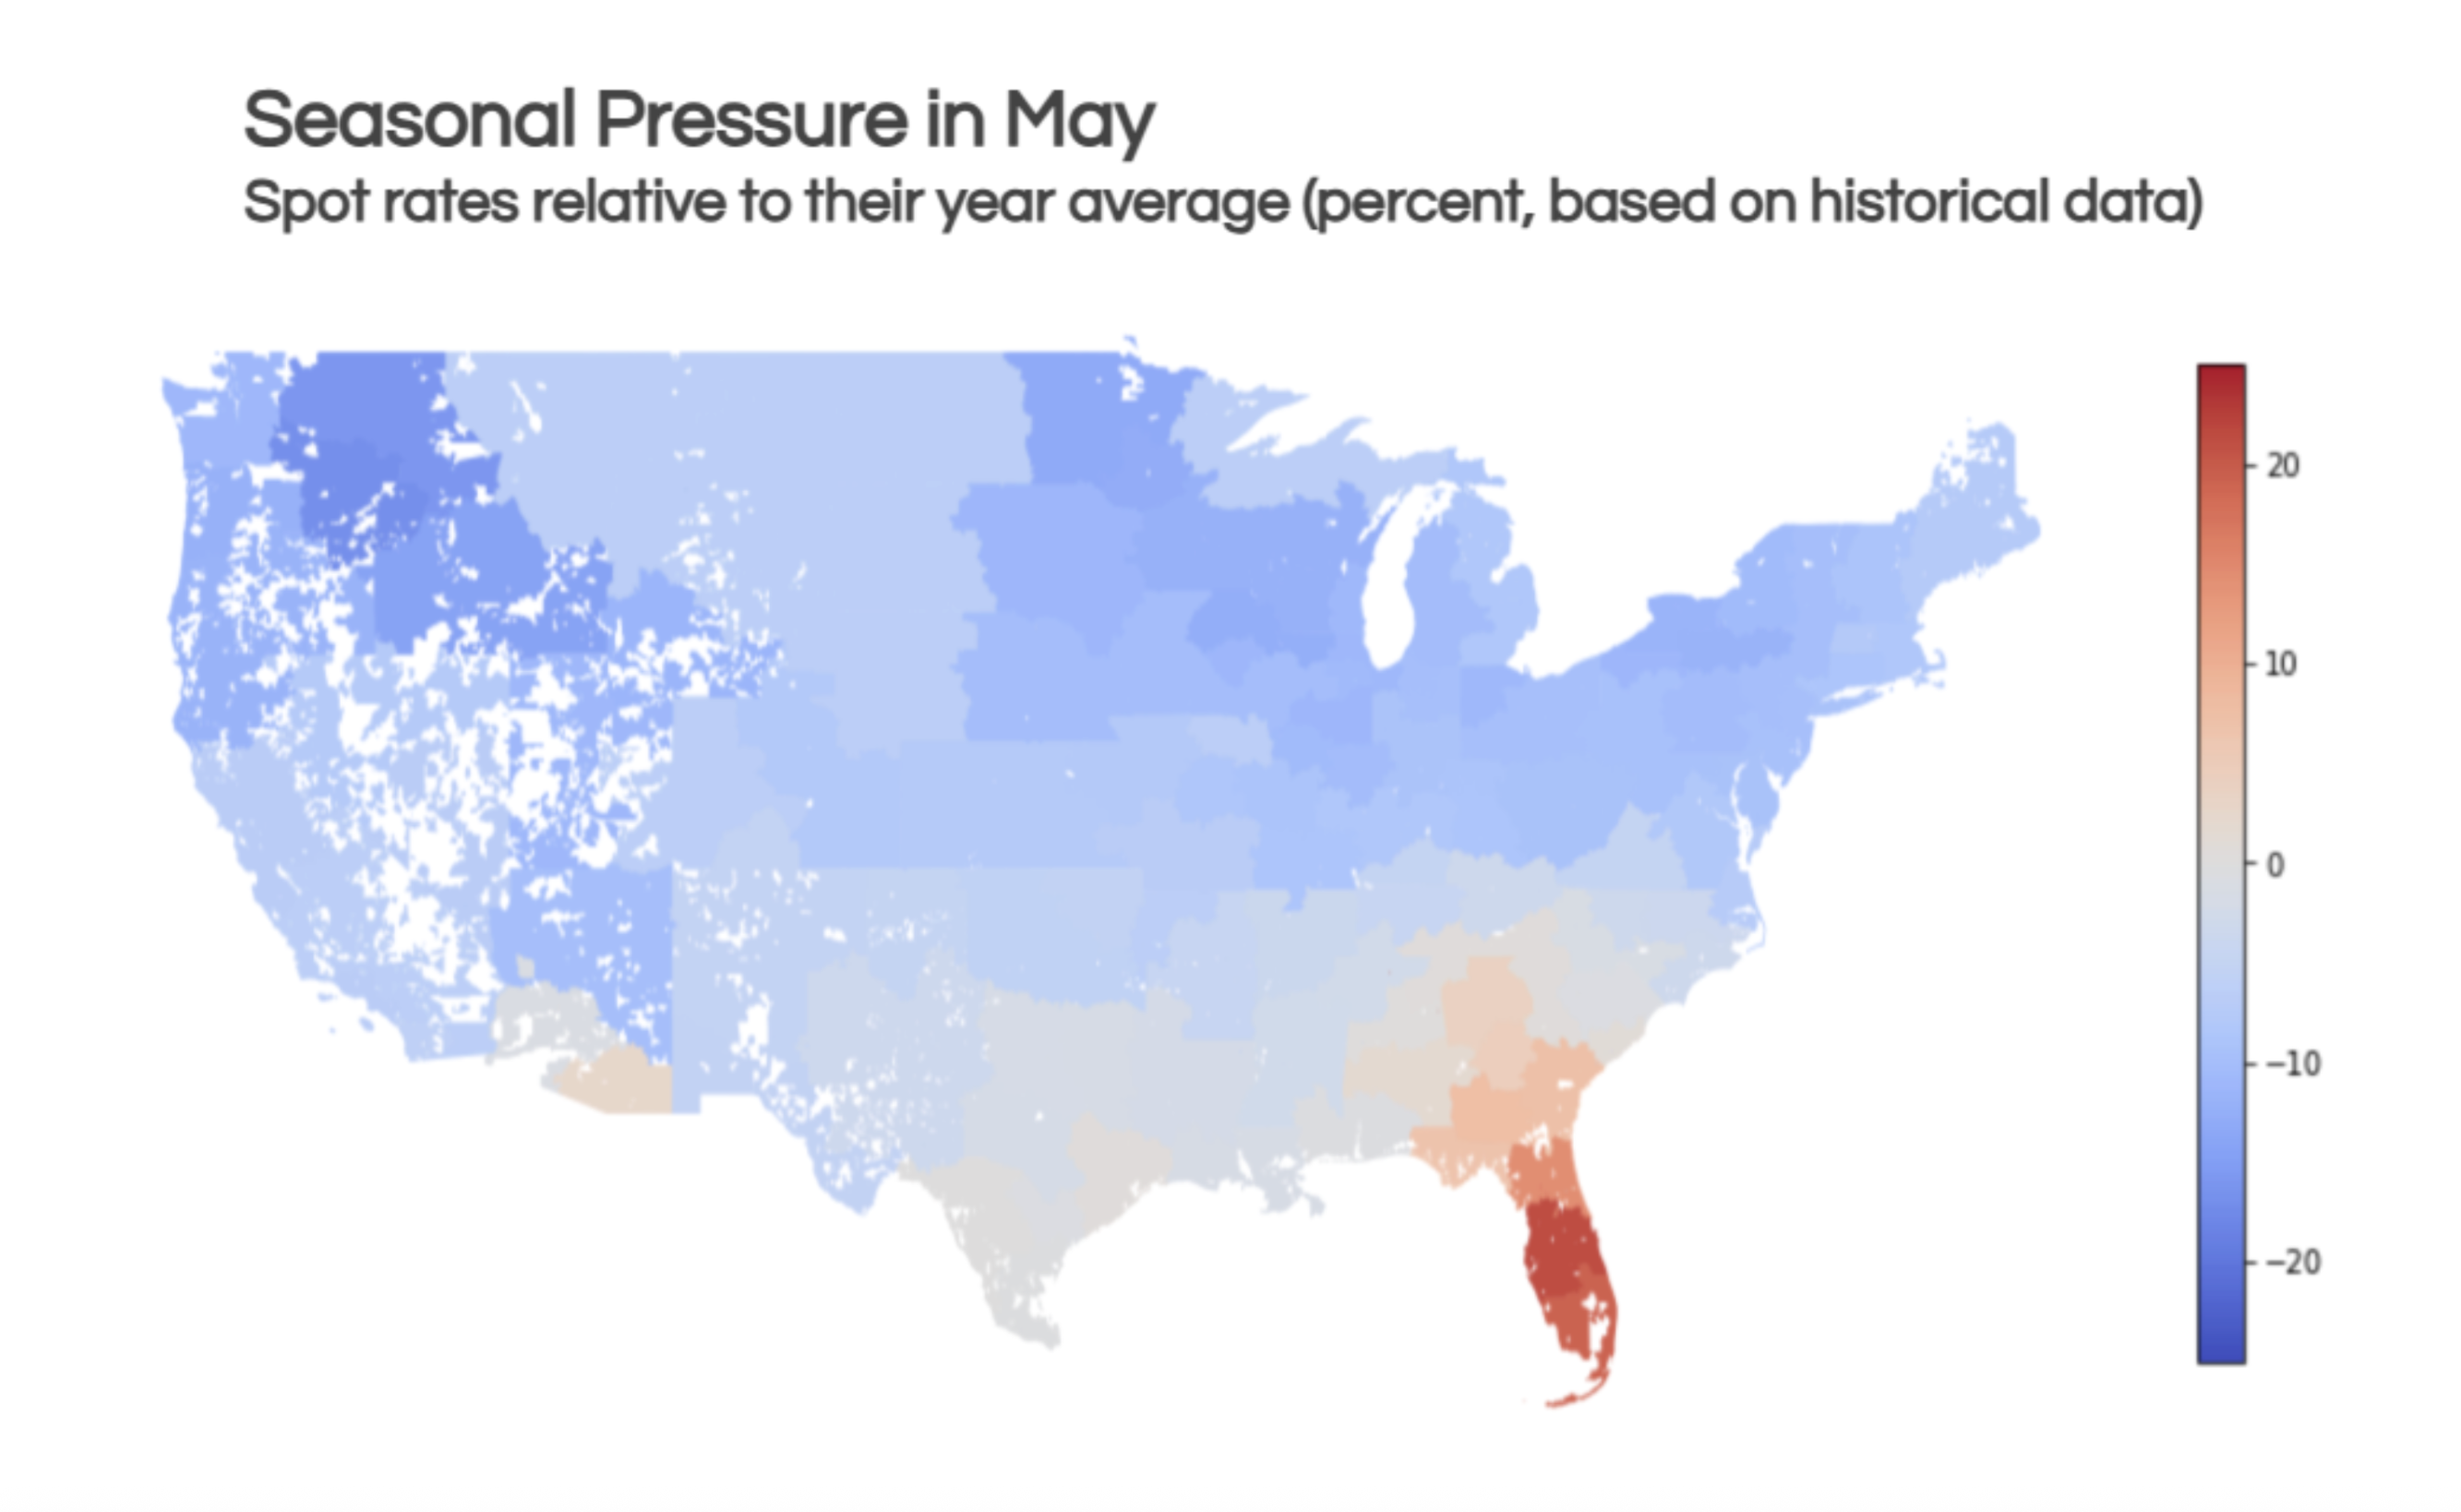
Spot rates typically experience a rapid increase from late May into early June, particularly in Southern markets like Florida, California, Texas, and Arizona. In contrast, Northern markets tend to remain relatively soft during this period.
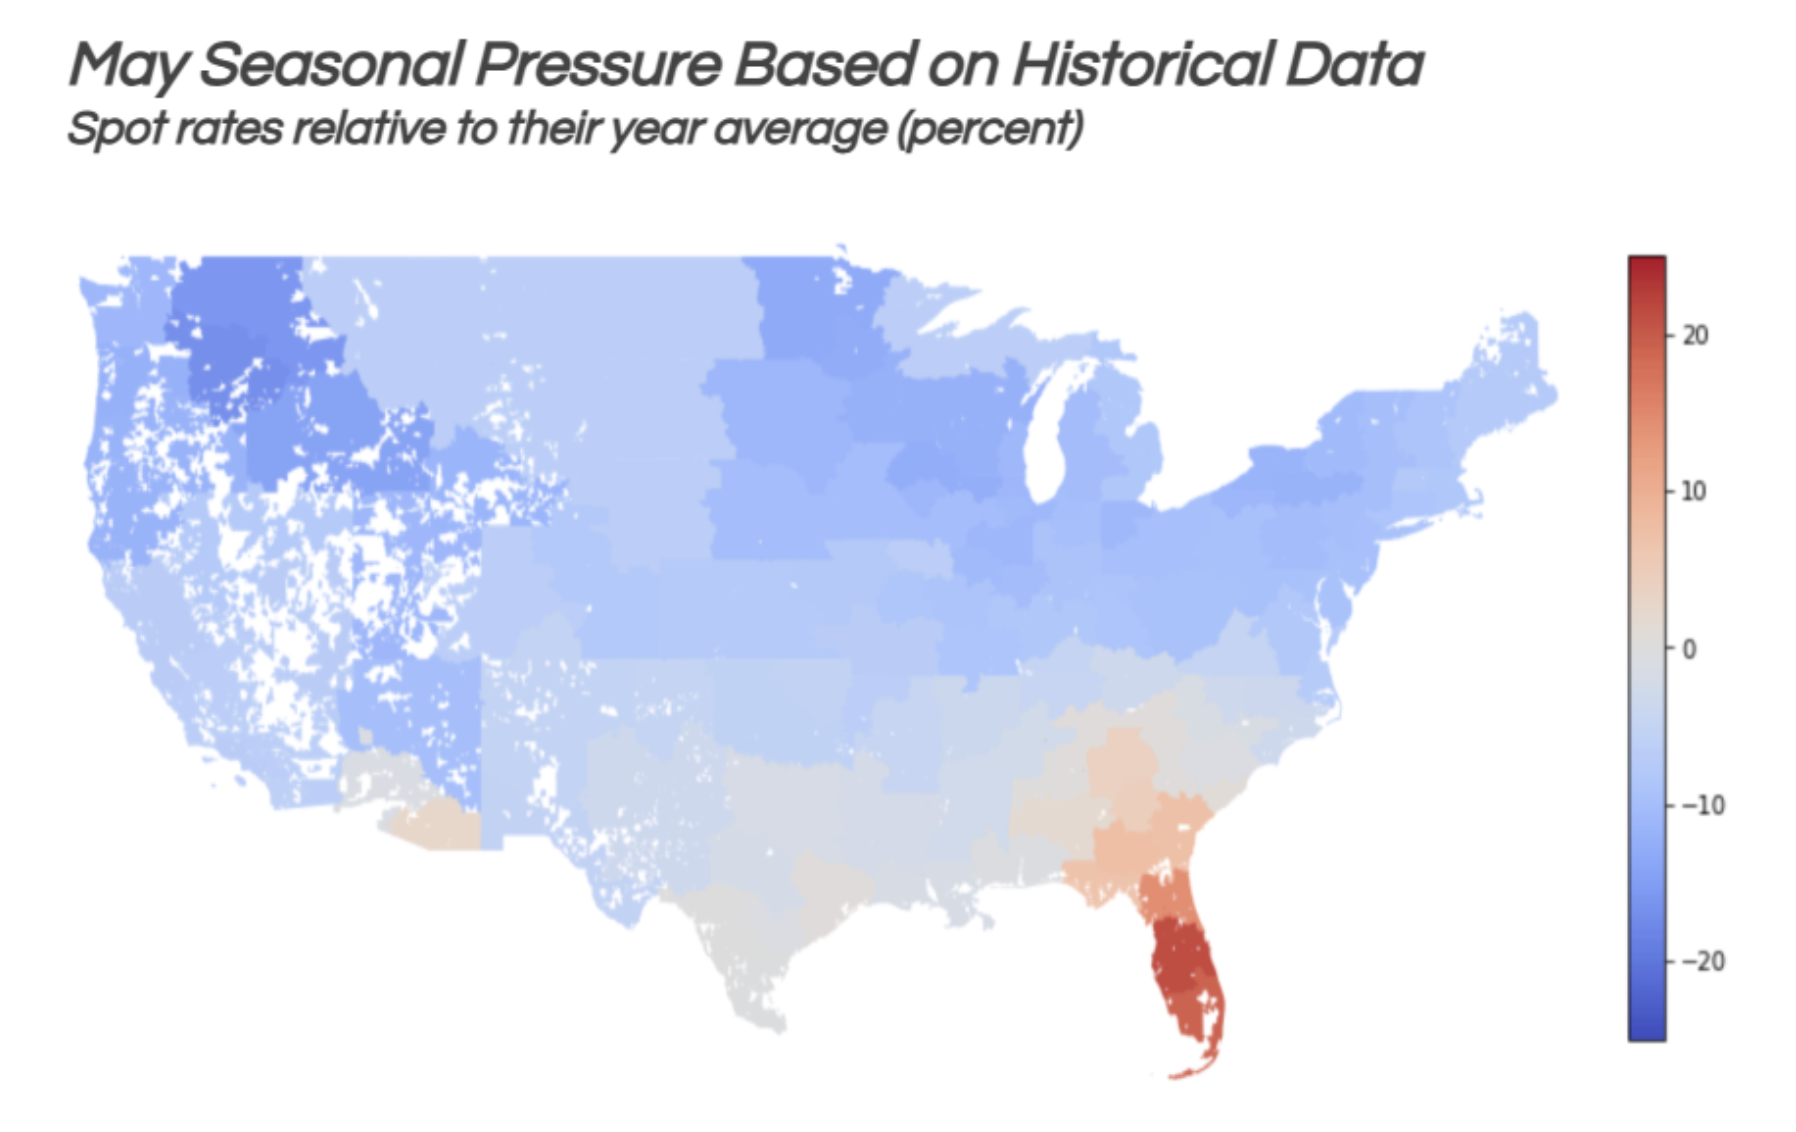

After the 4th of July, the market typically softens as produce volumes decrease. Tightness might persist in California, where shippers usually begin preparations for peak season. However, tariffs might suppress import volumes this year.
After the 4th of July, the market typically softens as produce volumes decrease. Tightness might persist in California, where shippers usually begin preparations for peak season. However, tariffs might suppress import volumes this year.