The Freight Economist
March 2025
Executive summary
Monthly economic and market update
Refrigerated
spot rates fell 9% in
February.
U.S. economy
Inflation
Labor market
Consumer
strength


Freight demand
Imports
Truck
tonnage
Manufacturing
Retail
sales


U.S. imports set a new record in January.
February imports decreased by 10% from January, a decline slightly exceeding our seasonal expectations, which predicted an 8.2% drop. Despite this monthly decrease, imports rose 4.7% year-over-year, reaching the second-highest February level on record, surpassed only by 2022. Notably, imports from China fell 12.5% from January to February, impacting volume at major West Coast ports. However, on a year-over-year basis, Chinese imports increased by 7.9%. Looking forward, ocean freight is anticipated to experience heightened volatility due to U.S. tariffs and the renewed threat of attacks in the Red Sea.
Imports

What does it mean for truck tonnage?
Retail sales
Key data points and commentary
Trucking
volume

Carload and
intermodal rates

Geographic
trends

Routing guide trends

Routing guide trends
Geographic trends
Average m/m and y/y van spot rate index by origin regions – February
Source: DAT

Trucking volume
The Cass Freight Shipments Index dropped 5.3% in January, with about half of that decline attributed to seasonal factors. The seasonally adjusted index fell approximately 2.7%, likely due to weather disruptions, and was 8.2% lower than the same time last year. Meanwhile, the American Trucking Associations' (ATA) Truck Tonnage Index held steady at 111.9 on a seasonally adjusted basis, representing a 0.3% increase from January 2024, marking the first year-over-year growth since August.
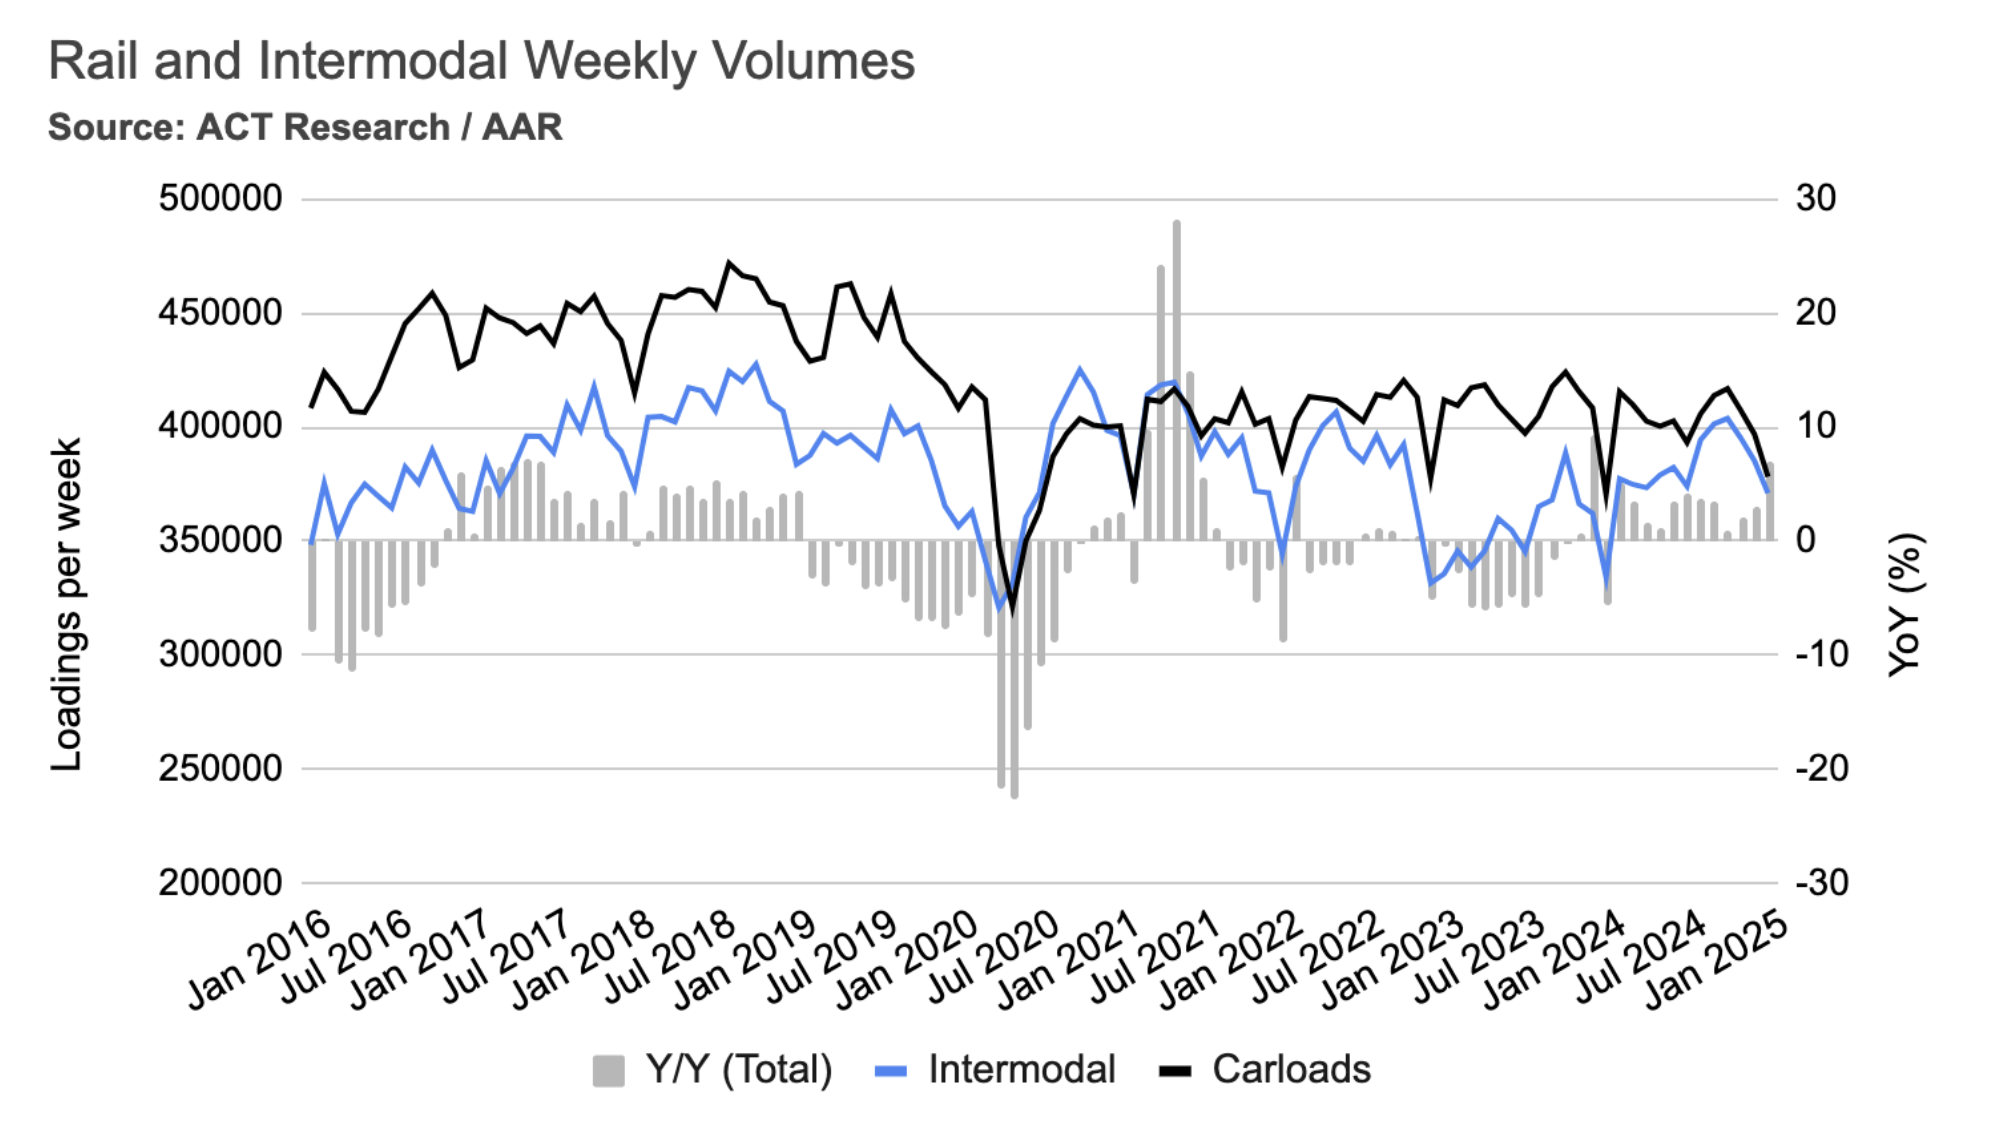
Carload and intermodal rates
In January, average weekly intermodal loads decreased by 3.7%, and weekly carloads dropped by 4.7%. However, compared to the same time last year, intermodal volumes were significantly higher, up 11%, and carloads increased by 2.1%. It's worth noting that this January's declines were less severe than those of the previous year, which saw 7.7% and 9.3% reductions in intermodal and carload loadings, respectively.
Mazen’s work focuses on analyzing the freight transportation landscape, and producing short- and long-term forecasts based on supply and demand dynamics. He is also a research affiliate with the Intelligent Transportation Systems (ITS) Lab at MIT, where he completed his PhD in 2019. His work falls at the intersection of ITS, economic modeling, and analytics.
mdanaf@uberfreight.com
By Mazen Danaf, Senior Economist and Applied Scientist, Uber Freight
Featuring insights and contributions from Uber Freight leadership,
technologists and market specialists.


Softening in February was evident in Uber Freight’s TM data. The first tender acceptance rate rose from 88% to 91% in February, and routing guide compliance rose from 91% to 94%. The average cost over the primary carrier fell from 4.2% to 1.8%, indicating some financial relief to shippers following peak season tightness.
Flatbed tender acceptance rates experienced a more moderate rise. While van and reefer experience seasonal weakness in Q1, this period marks the beginning of the flatbed peak season.
Following January's 0.5% increase, the Consumer Price Index (CPI) showed a more moderate 0.2% rise in February. This translates to an annualized inflation rate of 2.8%, or 3.1% when excluding volatile food and energy sectors. Further positive signals came from the Producer Price Index (PPI), which remained flat in February after a 0.6% increase in January. However, the PPI revealed a 0.3% increase in goods prices, offset by a 0.2% decrease in services prices, with tariffs impacting wholesale goods prices.
Despite these encouraging CPI and PPI figures, the ISM Prices Index, a leading indicator, has raised concerns. The index surged to 62.4, its highest point since June 2022, signaling that supply chain leaders are observing price increases in commodities and raw materials, potentially due to tariffs. According to ISM, five of the six largest manufacturing industries—Chemical Products, Transportation Equipment, Food, Beverage & Tobacco Products, Machinery, and Computer & Electronic Products—reported price increases in February. These sectors are heavily reliant on imports, particularly from Mexico, China, and Canada.


Executive
summary
U.S.
economy
Freight
demand
Freight
supply
Inflation
Average m/m and y/y van spot rate index by destination regions – August
Source: DAT

Dry van spot rates declined across all regions in February. The Midwest experienced the largest month-over-month decrease at 9.5%, while the Southwest saw the smallest, at 3.7%. Year-over-year, Midwest and Northeast outbound rates were relatively flat, and Southeast rates decreased slightly by 2.8%. Conversely, Southwest and West region outbound rates showed significant year-over-year increases of 7.6% and 10.4%, respectively.
Key data
points
Shipper and carrier insights
LTL and Intermodal: A tale of two markets
February retail sales rose after January’s dip but remained below December.
February retail sales increased by 0.5% following January's 1.4% decline. Year-over-year, sales were up 3.4%. Excluding automotive and gasoline, sales also rose 0.5% month-over-month and 3.5% year-over-year. E-commerce and healthcare products drove February's growth, while most other sectors experienced marginal changes. Food services and drinking places saw a 1.5% decrease.
Consumer
sentiment

Retail and food service sales climbed 1% in July, primarily boosted by a 3.6% surge in motor vehicle and parts dealers. Excluding this sector, sales edged up 0.4% from the previous month and were 3.1% higher compared to the same time last year. Importantly, this sales growth outpaced the rate of inflation for goods, which actually decreased over the past 12 months.

2/2
January's winter storms chilled the freight market.
January saw a decline in truckload demand across retail, wholesale, and manufacturing. Wholesale-driven demand experienced the largest drop, down 1.1% month-over-month, followed by retail (-0.9%) and manufacturing (-0.3%) demand. Despite these monthly decreases, year-over-year demand remained positive for all three sectors.


1/2
2/2
January’s winter storms chilled the freight market and the broader economy. While the stock market experienced volatility due to tariff anxieties and consumer spending weakness, other key indicators, including labor market strength, healthy disposable income, and moderate inflation, remained relatively healthy.
1/3


Intermodal rates saw a slight 0.1% increase in February, placing them just 0.3% above February 2024 levels. Carload rates remained unchanged but were 3.6% higher year-over-year. Intermodal rates are expected to remain near last year's levels, aligning with the flat year-over-year truckload contract rates they typically follow.

2/2
Shipper and carrier insights
January's 0.5% seasonally adjusted decline in consumer spending, the largest since February 2021, is likely attributable to adverse weather conditions, not underlying consumer weakness. This mirrors past instances where similar drops coincided with winter freezes, including a 0.3% decrease last year and a significant 1.0% drop in February 2021.
Despite this spending decrease, real disposable income rose by 0.6% in January and was 1.8% higher year-over-year, indicating continued consumer financial health.
The sharp 7.5% decline in motor vehicle spending, particularly the 8.5% drop in new auto purchases, strongly supports the weather-related explanation for the overall spending decrease. After all, who enjoys a test drive in the midst of a storm? Furthermore, the 0.1% increase in service spending during January, which remains about 3% higher year-over-year, reinforces the notion that weather, rather than consumer weakness, was the primary driver of the spending decline.

Consumer strength
In addition to winter storms, economic unease and stock market downturns contributed to a significant drop in consumer sentiment. The University of Michigan's March 2025 index fell to 57.9, revealing heightened concerns about inflation and the economy's future. The two components of the index, Current and Expected Sentiment, both decreased in March. The most striking decline was in Expected Sentiment, which plunged almost 10 points from the previous month.

Consumer sentiment
In the long run, tariffs might boost domestic freight by giving local manufacturers an edge. However, the magnitude and sudden implementation of tariffs means we probably won't see benefits for a while, and the immediate damage will be greater.
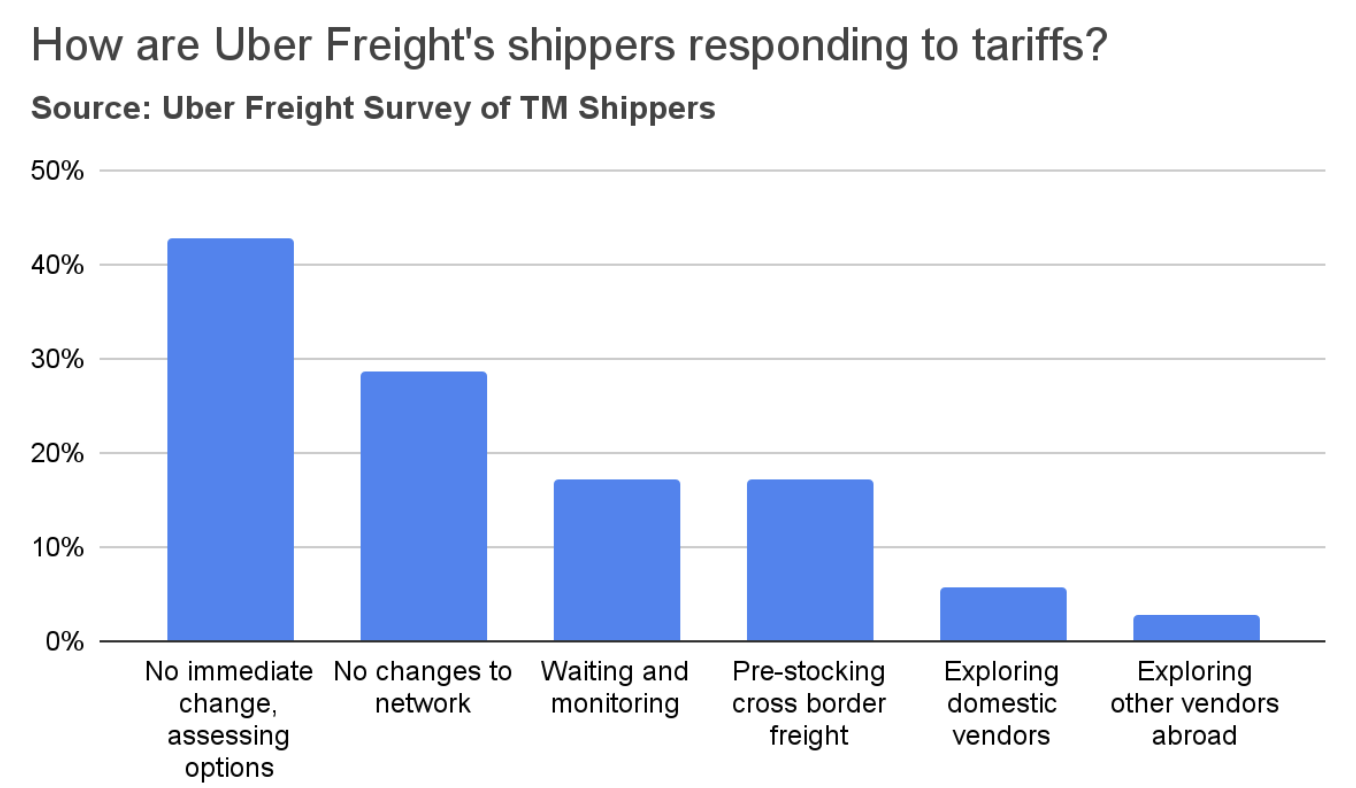
Unlike Canada and Mexico, the 10% percent tariffs on Chinese products went into effect on February 4, and are likely to stay. Tariffs on China were already anticipated by shippers, some of which pulled imports forward in 2024.
A survey of Uber Freight shippers found that the majority do not foresee immediate changes to their networks. However, a significant minority (42%) are actively assessing various options. Some shippers reported that they anticipate absorbing cost increases and subsequently passing those increases on to their customers. Seventeen percent of shippers indicated they are pre-stocking cross-border inventories. In contrast, very few are exploring domestic alternatives or alternative vendors in countries not impacted by tariffs. Some expressed concerns that it will take several months to adapt their networks.
Labor market


The U.S. manufacturing sector shows signs of stabilization.
The Institute for Supply Management Purchasing Managers’ Index (ISM PMI) fell to 50.3 in February, marking the second consecutive month slightly above the expansion threshold of 50.0. However, despite this positive trend, early indicators of demand suggest weakness. The New Orders index declined to 48.6, falling back into contraction, and the backlogs index remained in contraction at 46.8. Furthermore, the prices index surged to 62.4, the highest level since June 2022, signaling a sharp increase in commodity and raw material prices, which the ISM attributes to tariffs.
Manufacturing

The ISM report also highlighted widespread concerns among manufacturers about declining demand and order levels. Respondents across various sectors expressed pessimism about the near-term outlook.
Manufacturing

2/2
Freight supply
Spot rates

Operating
costs

Supply and demand indices

Driver
employment

The recent BLS data revisions, which revealed a substantial decline in long-distance truckload employment, prompted a major update to our supply-demand model. Our analysis now indicates a return to perfect market balance, similar to mid-2019.
In the latest observation, January saw a 1% decrease in demand, primarily due to weather, but it still exceeded January 2023 levels by 1.4%. Supply also declined, falling 0.5% and ending 1% below the January 2023 figure.

Truckload supply and demand indices
Truckload employment has stabilized, returning to January 2020 levels.
Trucking employment saw a 1.9K decrease in February but has remained relatively stable since August. Meanwhile, long-distance truckload employment fell by 2.6K in February, reversing recent gains due to fading post-peak season optimism. Notably, following employment declines, weekly work hours in the long-distance TL sector surged, indicating potential capacity tightening.

Driver employment
Dry van spot rates continued their seasonal decline through February and early March, yet remained slightly above prior-year levels across most trucking modes. Reefer rates were the exception, which remained year-over-year. February saw the largest month-over-month drop in refrigerated freight rates, which fell 9%, followed by a 6.8% decrease in dry van rates. Flatbed spot rates were largely unchanged, signaling the onset of the spring peak season. Contract rates were mostly unchanged for van and reefer, but flatbed rates fell slightly.

Spot rates
Market conditions
Market
conditions
Within the freight market, spot rates continued their expected seasonal decline throughout February and early March, yet remained marginally above prior-year levels for most trucking modes. This current dip is primarily seasonal. Other indicators, such as trucking employment, contract rates, and demand metrics, have all held steady over the past few months, indicating a generally stable market outside of the seasonal spot rate fluctuation.
3/3
Despite recent gains, the spot market remains unprofitable for carriers.
The peak season spot rate surge offered only temporary relief for small carriers. Despite the increase, spot rates remained approximately 13% below operating costs per loaded mile. With operating costs aligning with contract rates, carriers' margins remained suppressed, suggesting further capacity correction may be necessary.

Carriers' operating costs
Historically, U.S. less-than-truckload (LTL) and intermodal rates have lagged dry van truckload rates. This correlation stems from the dry van market's dominant size, positioning LTL and intermodal as “price takers”. Furthermore, these modes often serve as alternatives to dry van, depending on shipment characteristics like weight and volume. While freight rates generally reflect supply and demand dynamics, this year has diverged. LTL rates have risen despite softening demand, while intermodal rates have declined amidst increasing demand.
Less-than-truckload
The LTL sector experienced a significant employment decline in 2023, primarily due to the Yellow bankruptcy, resulting in a 25.7K reduction, or approximately 9.6% of total employment. This drop pushed employment below 2019 and 2020 levels. While some recovery occurred as competitors absorbed Yellow's assets and drivers, the downward trend resumed in 2024. Current LTL employment is 12.3% below the 2022 pandemic peak and 4.8% below pre-COVID levels.
However, this employment reduction did not fully align with softening demand. A decline in weekly working hours, from 43-44 pre-pandemic to roughly 39 currently, suggests substantial idle capacity within the sector.
Click to jump to section
Although recent economic indicators appear more positive than the previous month, caution remains warranted. Supply chain managers are observing rising inflationary pressures, particularly in commodities and raw materials, as evidenced by the ISM Prices Index, which reached its highest point since June 2022. This suggests potential challenges ahead despite the current positive trends.
2/3
Is the consumer pullback in January concerning?
Industrial production of machinery, primary metals, and fabricated metals has remained relatively flat or slightly declined over the past year. A recovery in these sectors seems unlikely in the near future, as orders and shipments of core capital goods—a key indicator of manufacturing activity—have also stagnated.
Orders for core capital goods, which are nondefense capital goods excluding aircraft, are considered an early indicator of manufacturing activity. Weak orders and shipments in this sector suggest that a broader economic recovery may be delayed.


January’s winter storms chilled the freight market and the broader economy. While the stock market experienced volatility due to tariff anxieties and consumer spending weakness, other key indicators, including labor market strength, healthy disposable income, and moderate inflation, remained relatively healthy.
1/3
Industrial equipment and supplies
Automotive
Auto manufacturing has been one of the bright spots in the economy over the past year, driven by pent-up demand and a shortage of vehicles at dealerships. While production rose to meet demand, the market is starting to show signs of saturation, with inventories gradually normalizing and potential glut looming on the wholesale side.


Paper and plastics
Paper and plastics are highly used in the packaging industry, which has been affected by the recent slowdown in food spending after the economy re-opened. In addition, the demand for paper products was already on a downward trajectory due to factors such as digitalization, adoption of alternatives (plastics), and growth of e-commerce. The pandemic further accelerated this decline. Moreover, a surge in downstream inventories led to a slowdown in manufacturers’ demand.


Nondurable consumer goods
Demand for food consumed at home fell from its pandemic highs as the economy re-opened, normalizing back to its pre-pandemic levels. Demand for other consumer goods (such as apparel) continues to be pressured by external competition, slowing consumer demand, and high downstream inventories.


Durable consumer goods
Durable consumer goods such as appliances, furniture, and wood products are affected by the ongoing housing recession. New home sales remain below the 2019 levels, and about 30% below the pandemic peak. Similarly, housing starts are at their lowest level since the beginning of the housing recession, 32% below the 2022 peak.


Concerns over tariffs and the broader economy have shaken consumer sentiment.
The CPI and PPI prints were encouraging, but supply chain leaders think otherwise.


The labor market is stabilizing.
After two years of decline, job openings and new hires have recently stabilized, with job openings beginning to exhibit an upward trend. This stabilization occurs as the Federal Reserve has initiated interest rate reductions, alongside a gradual, albeit slow, deceleration of inflation. Barring unforeseen geopolitical or tariff-induced supply chain disruptions, the economy appears to be progressing toward a soft landing.
Furthermore, the unemployment rate has maintained stability between 4.0% and 4.2% since June of the previous year, with February's rate showing a marginal increase from 4.0% to 4.1%. Consequently, despite February’s perceived negative sentiment, the labor market has yet to demonstrate signs of weakness, whether in the form of a recession or tightness that could trigger inflationary pressures.

Labor market
Despite significant idle capacity, LTL rates continue to rise. The Producer Price Index (PPI) indicated a record high for LTL rates in February, surpassing the previous peak of June 2022. Rates are now 6.1% above year-earlier levels, exceeding the historical pre-pandemic average growth of approximately 5%. This upward trend is attributed to the greater pricing power of LTL carriers compared to the more fragmented truckload market, enabling them to resist rate reductions that fall below their profitability thresholds.

Intermodal
Intermodal demand experienced substantial growth over the past year, fueled by increased import volumes. In 2024, container imports exceeded 28 million TEUs, a 13% increase from 2023. The shift from East Coast to West Coast ports, driven in part by East Coast port labor disruptions, further stimulated intermodal demand. Consequently, intermodal loads rose 7% in 2024 compared to 2023 and 2025 began strongly with an 11% year-over-year increase in January.

Despite rising truckload and record-high LTL rates, intermodal rates remain depressed due to ample capacity. Linehaul and all-in rates are down 6.3% and 7.3% year-over-year, respectively. However, given the typical one-quarter lag between intermodal and truckload rates, further declines are improbable.

Shipper Recommendations
Container import volumes and truckload contract rates will serve as key indicators for the intermodal market in the coming months. Sustained strong import volumes and a continued gradual rise in truckload contract rates suggest a similar upward trend for intermodal rates. However, without a significant truckload rate recovery, which appears unlikely given current market conditions, intermodal rate surges are improbable. Conversely, a sharp decline in imports due to tariff pressures could further suppress intermodal demand and rates.
The LTL market presents a different scenario. Despite carriers' pricing power due to market consolidation, allowing for substantial year-over-year rate increases, muted demand empowers shippers to push back or explore alternatives. These alternatives include consolidating smaller shipments into full truckloads to leverage stagnant truckload rates against rising LTL costs.
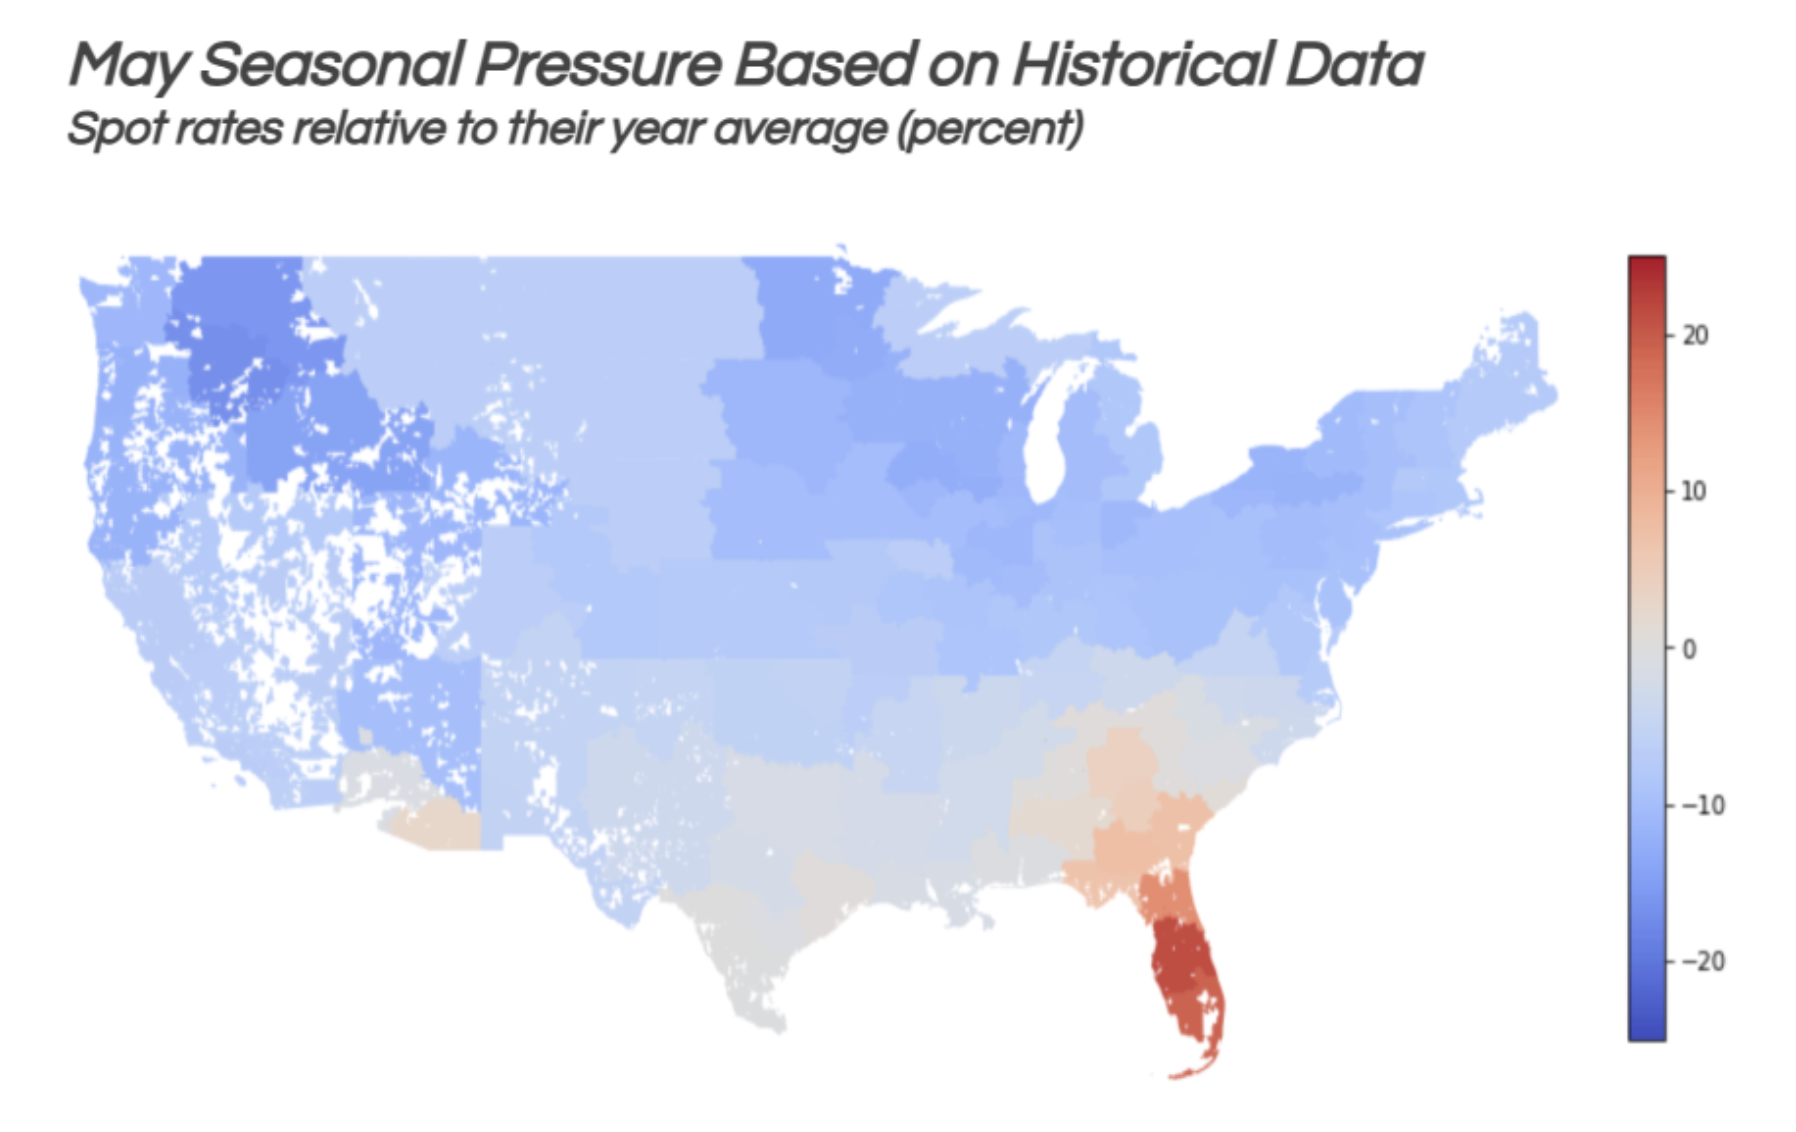
Short-term outlook
While spring produce volumes and weather disruptions may cause localized tightness in March, particularly in the Northeast, Midwest, and South regions, most markets usually remain soft, especially in the West and Southeast regions.

Spot rates typically decline through early May, with summer produce volumes then driving increases, particularly in Southern Florida. However, markets in the Northeast, Midwest, and West are expected to remain soft through May.