The Freight Economist
April 2025
Executive summary
Monthly economic and market update
The U.S. imported
206 million tons
of containerized goods in 2024, 63 million of which came
from China.
U.S. economy
U.S. Trade by the numbers
U.S. / China
trade war
Inflation


Freight demand
Imports
Truck
tonnage
Manufacturing
Retail
sales


Shippers also rushed to secure inventories ahead of tariffs.
U.S. container imports remained strong in March at 2.38M TEUs, a 6.3% increase from February and an 11% increase from March 2024. This growth exceeded the expected seasonal rise of 4.1%. Notably, imports from China declined by 12.6% in February, but remained 9.4% higher than the year-earlier levels.
April is expected to see a sharp drop in imports, particularly from China, due to tariff disruptions. Some shippers have already paused imports, and U.S. production plants are halting operations while awaiting tariff clarity.
The National Retail Federation anticipates May imports will end a 19-month streak of year-over-year growth, forecasting a sharp 20.5% decline compared to last May. They also project substantial year-over-year drops in imports for June (26.6%), July (27%), and August (26.8%).
Imports

What does it mean for truck tonnage?
Retail sales
Key data points and commentary
Trucking
volume

Carload and
intermodal rates

Geographic
trends

Routing guide trends

Routing guide trends
Geographic trends
Average m/m and y/y van spot rate index by origin regions – March
Source: DAT

Trucking volume
The Cass Freight Shipments Index jumped 10.4% in February but remained flat in March. Adjusting for seasonality, February's increase was 4.9%. The index was still 5.3% lower YoY. Similarly, the ATA Truck Tonnage Index surged 3% in February, its largest rise in years, and was 0.6% higher YoY. The ATA suggested inventory pre-stocking may have contributed to this surge.
Carload and intermodal rates
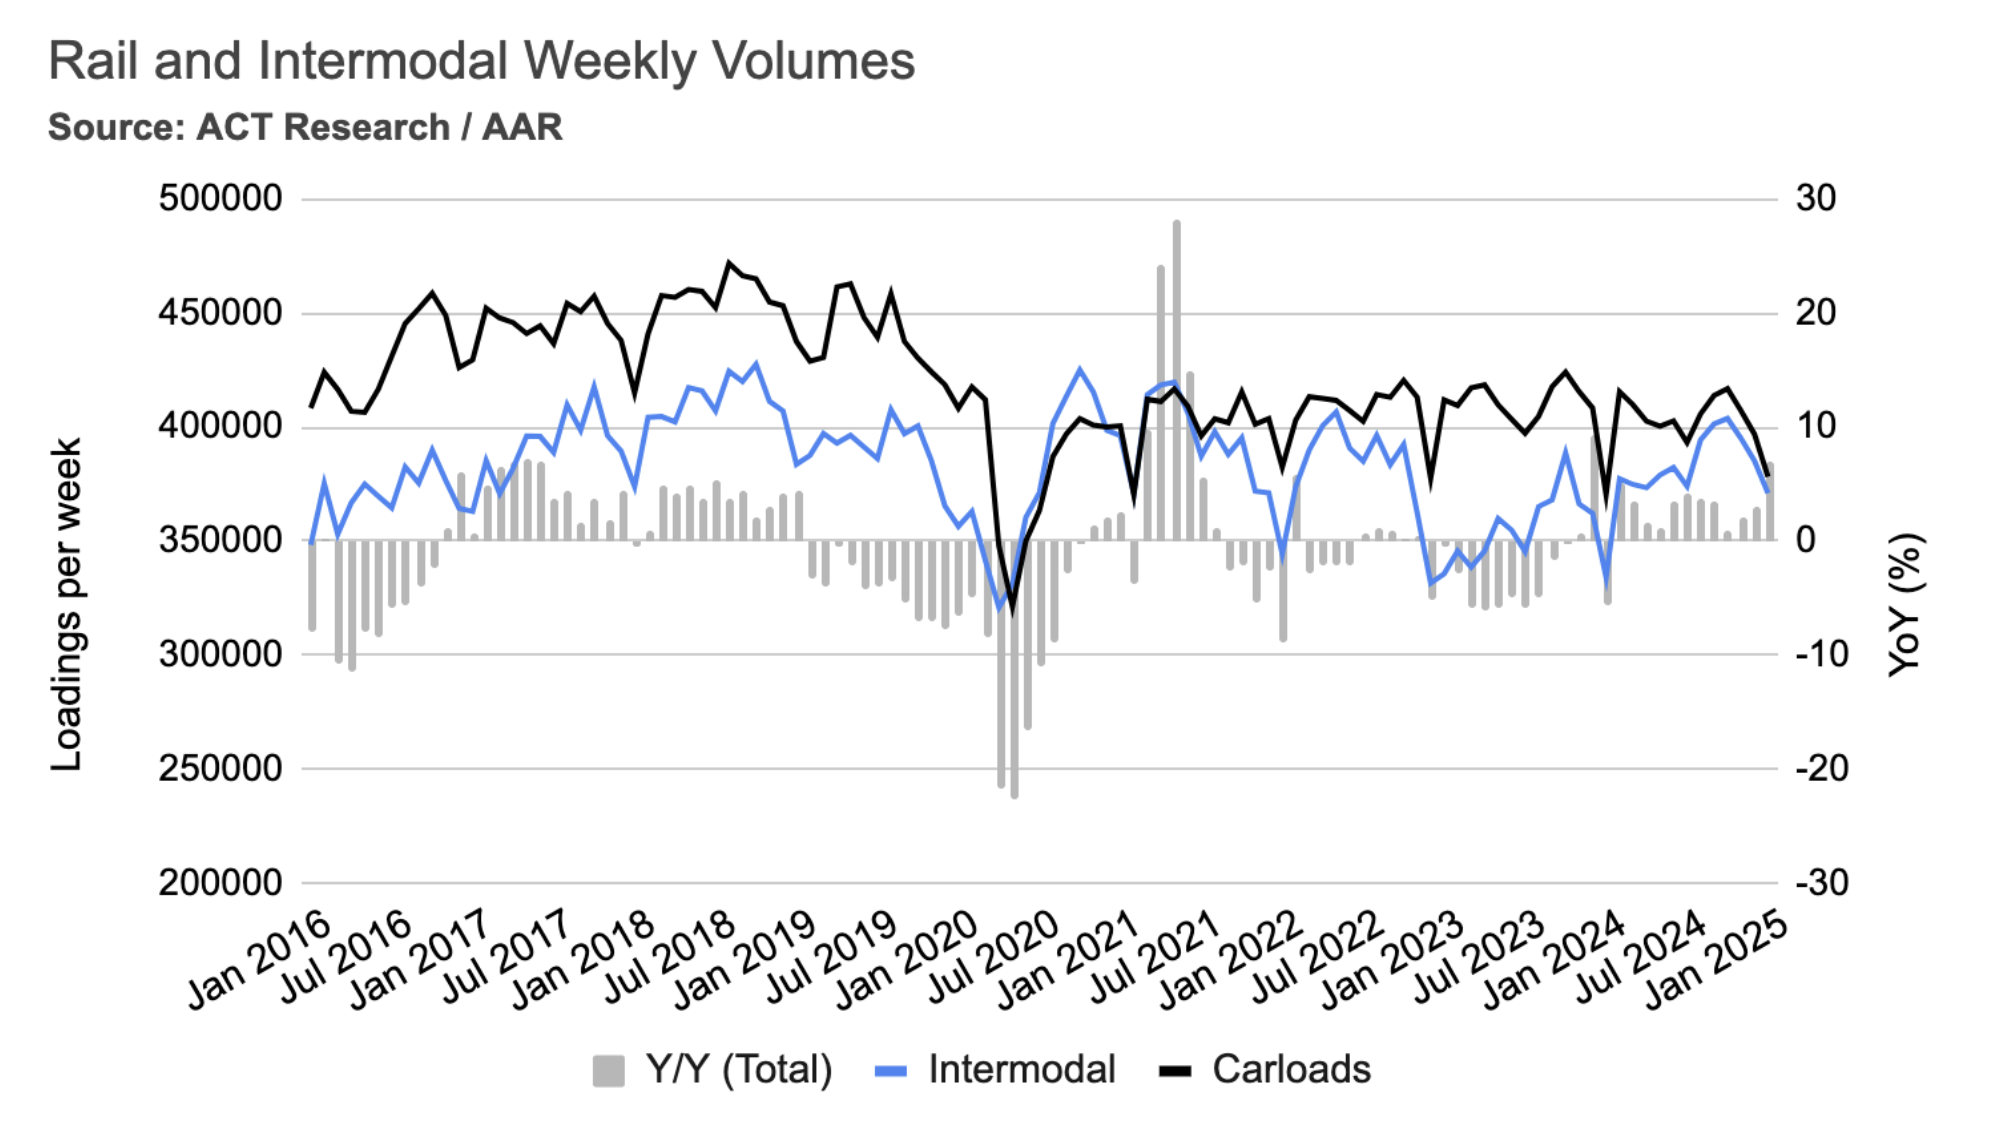
In January, average weekly intermodal loads decreased by 3.7%, and weekly carloads dropped by 4.7%. However, compared to the same time last year, intermodal volumes were significantly higher, up 11%, and carloads increased by 2.1%. It's worth noting that this January's declines were less severe than those of the previous year, which saw 7.7% and 9.3% reductions in intermodal and carload loadings, respectively.
Mazen’s work focuses on analyzing the freight transportation landscape, and producing short- and long-term forecasts based on supply and demand dynamics. He is also a research affiliate with the Intelligent Transportation Systems (ITS) Lab at MIT, where he completed his PhD in 2019. His work falls at the intersection of ITS, economic modeling, and analytics.
mdanaf@uberfreight.com
By Mazen Danaf, Senior Economist and Applied Scientist, Uber Freight
Featuring insights and contributions from Uber Freight leadership,
technologists and market specialists.


First tender acceptance rate rose from 88% in January to 92% in March, and routing guide compliance rose from 91% to 95%. Meanwhile, cost over the primary carrier fell from 4.2% to 1.1%, indicating financial relief for shippers following peak season tightness.
Flatbed tender acceptance rates fell in March. While van and reefer typically see seasonal softness in Q1, this period marks the start of flatbed peak season.
Despite the 90-day tariff pause, significant freight market disruptions are anticipated, particularly related to imports from China. China is the dominant source of containerized imports to the U.S., representing nearly a third of the volume in 2024—a figure almost equal to the combined imports from the next seven leading countries. These imports from China span crucial freight-driving sectors, including manufacturing supplies, machinery, furniture, electrical equipment, appliances, apparel, plastics, and metals, many of which are high-volume, low-cost commodities.
China's dominance is particularly evident in key categories such as electrical equipment and appliances (57% of U.S. imports), plastics and rubber (46%), apparel (45%), furniture (43%), metals (36%), transportation equipment (35%), and miscellaneous manufactured goods (78%).


Executive
summary
U.S.
economy
Freight
demand
Freight
supply
U.S. trade by the numbers
Average m/m and y/y van spot rate index by destination regions – August
Source: DAT

March dry van spot rates declined in the West (-6.5%), Midwest (-5.6%), and Northeast (-3.3%), while slightly increasing in the Southwest (+1.4%) and Southeast (+0.9%). Year-over-year, rates were up across all regions, ranging from a modest +1.7% in the Southeast to a high of +6.5% in the Northeast.
Key data
points
Shipper and carrier insights
Tariffs are disrupting supply chains.
Consumers rushed to buy cars before tariffs.
Retail sales increased by 1.4% in February, almost entirely due to a surge in motor vehicle and parts purchases as consumers anticipated tariffs. Sales of motor vehicles and parts rose by 5.3% in March, reaching 8.8% above the previous year. Overall, retail sales were up 4.6% year-over-year, suggesting U.S. consumer resilience until recently.
Who’s the
winner?

Retail and food service sales climbed 1% in July, primarily boosted by a 3.6% surge in motor vehicle and parts dealers. Excluding this sector, sales edged up 0.4% from the previous month and were 3.1% higher compared to the same time last year. Importantly, this sales growth outpaced the rate of inflation for goods, which actually decreased over the past 12 months.

2/2
Truckload demand rose in February.
Seasonally adjusted truckload demand increased in February across all three sectors. Wholesale demand saw the largest gain, rising 0.9% month-over-month, followed by retail (0.5%) and manufacturing (0.4%) demand. Year-over-year, retail and wholesale demand were up 2.7% and 0.6%, respectively, while manufacturing demand decreased by 0.4%.


1/2
2/2
Analyzing the freight market this month is challenging due to tariff uncertainty. Most economic indicators, available only through March (pre-tariffs), are largely irrelevant. However, declining import and intermodal volumes suggest a decrease in overall volume.
1/3


Average weekly intermodal volumes increased by 1.4% in March, a 6.8% rise year-over-year. However, this volume growth didn't translate to higher rates. Intermodal rates remained flat from February to March, and were 4.5% below March 2024. All-in rates, including fuel, fell 0.8% in March due to lower fuel prices, ending 5.6% lower year-over-year.

2/2
Shipper and carrier insights
Tariffs are likely driving inflation higher, though not yet reflected by official statistics.
Official data from the U.S. Bureau of Labor Statistics has yet to indicate inflationary pressures. In March, the Consumer Price Index (CPI) declined by 0.1%, registering a 2.4% increase from the previous year, and moving closer to the Federal Reserve's 2% target. Similarly, the Producer Price Index (PPI), which tracks wholesale prices, saw a modest 0.1% increase in March, resulting in a 2.7% year-over-year rise.
Despite these figures, supply chain professionals are seeing inflation due to tariffs. Over the past two months, the Institute for Supply Management (ISM) Prices Index, reflecting manufacturers' input costs for commodities and raw materials, has sharply increased from the low 50s to nearly 70—its highest point since June 2022. Historically, this index has served as a leading indicator for both upward and downward trends in the CPI and PPI during previous inflation cycles.

Inflation
Despite being hit by significant tariffs, certain countries might emerge as winners.
Even before tariffs, Mexico surpassed China as the leading U.S. trading partner in 2022 and has maintained this position. And even with potential tariffs on Mexican goods, they are unlikely to be as severe as those on Chinese products, positioning Mexico as a relative winner.
Beyond Mexico, importers will seek alternative manufacturing hubs outside China. Several countries, including Vietnam, Thailand, Malaysia, Indonesia, Cambodia, Bangladesh, and Sri Lanka, exhibit heavily correlated export patterns with China across various industries. Combined imports from these Asian hubs were on track to exceed imports from China this year.

Who’s the winner?
In the long run, tariffs might boost domestic freight by giving local manufacturers an edge. However, the magnitude and sudden implementation of tariffs means we probably won't see benefits for a while, and the immediate damage will be greater.
Unlike Canada and Mexico, the 10% percent tariffs on Chinese products went into effect on February 4, and are likely to stay. Tariffs on China were already anticipated by shippers, some of which pulled imports forward in 2024.
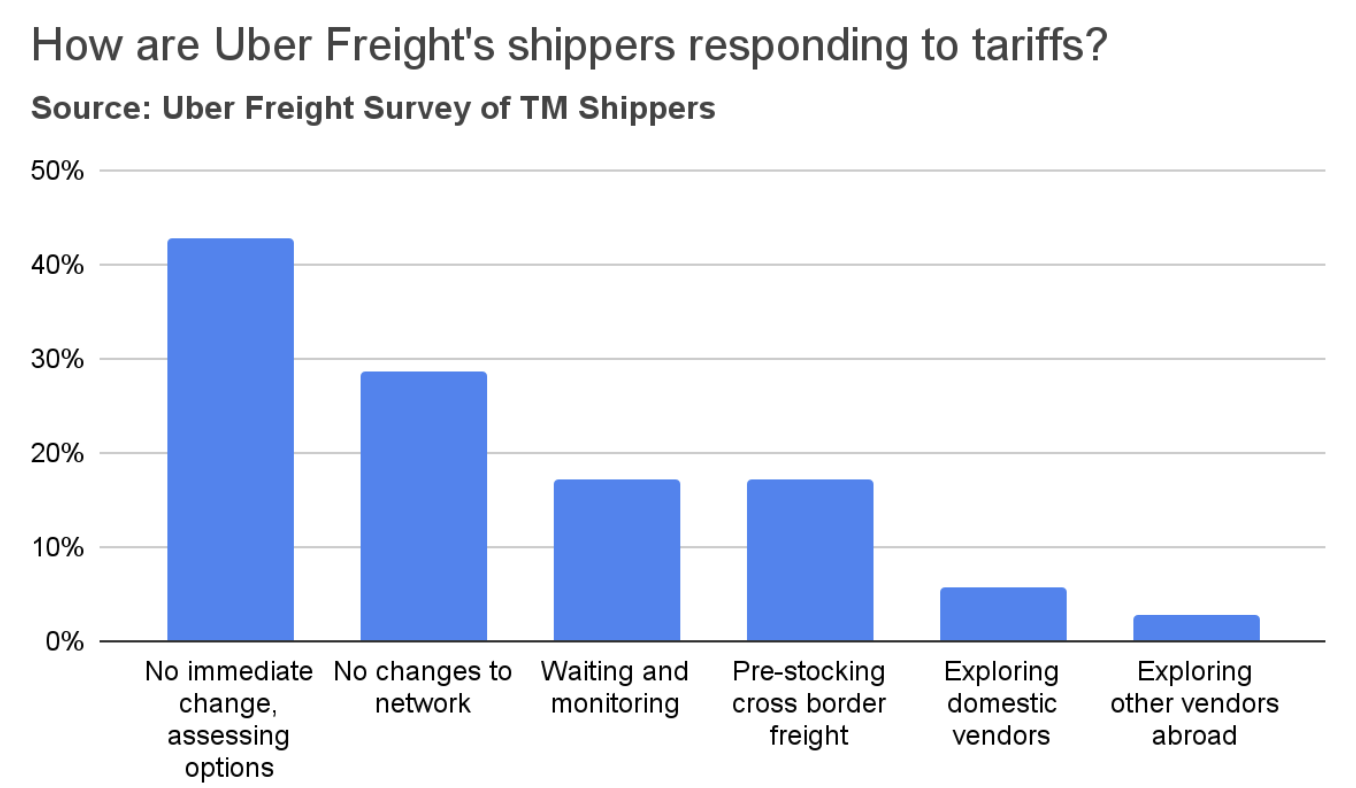
A survey of Uber Freight shippers found that the majority do not foresee immediate changes to their networks. However, a significant minority (42%) are actively assessing various options. Some shippers reported that they anticipate absorbing cost increases and subsequently passing those increases on to their customers. Seventeen percent of shippers indicated they are pre-stocking cross-border inventories. In contrast, very few are exploring domestic alternatives or alternative vendors in countries not impacted by tariffs. Some expressed concerns that it will take several months to adapt their networks.
US / China trade war


The U.S. manufacturing sector fell back into contraction.
The Institute for Supply Management (ISM) Purchasing Managers Index (PMI) fell to 49 in March, back to contraction after a brief period of growth. Only three components of this index expanded: Inventories, Supplier Deliveries, and Imports. This reflects manufacturers proactively securing inventories ahead of tariffs, rather than indicating robust demand. The Prices Index surged to 69.4, the highest level since June 22, signaling a surge in commodity and raw material prices.
The manufacturing sector is likely to face increased near-term headwinds as manufacturers adjust to tariffs, urgently seeking domestic suppliers, especially those reliant on Chinese products and commodities.
Manufacturing

The ISM report also highlighted widespread concerns among manufacturers about declining demand and order levels. Respondents across various sectors expressed pessimism about the near-term outlook.
Manufacturing

2/2
Freight supply
Spot rates

Tractor
orders

Supply and demand indices

Driver
employment

Our national index shows February truckload demand up 0.6% YoY, while supply decreased by 0.6%, bringing supply and demand into balance after two years of oversupply. This equilibrium stems from a significant capacity reduction, as demand growth remains sluggish. However, potential lower demand due to tariffs could reopen the supply-demand gap.

Truckload supply and demand indices
Truckload employment rose unexpectedly in March.
Trucking Carriers added 9.6K jobs in March, representing a 0.6% m/m increase. March's increase was counter-seasonal and counter-cyclical. This uptick might represent a delayed hiring response following January's temporary spot market tightening due to weather disruptions, which preceded an anticipated collapse similar to the previous year. However, given the persistent signs of stagnant demand, this trend is not expected to persist.
Meanwhile, long-distance truckload employment, a more relevant indicator of OTR capacity, fell by 0.5K in February.

Driver employment
March saw a counter-seasonal decline in spot rates, bucking the usual spring produce season increase. Dry van spot rates continued their downward trend through mid-April, mirroring last year, but remained ~3% above prior-year levels. In contrast, reefer rates were flat YoY. Driven by seasonal tailwinds, flatbed rates surged 5.6% in March and were 5.1% higher year-over-year. Contract rates were nearly flat YoY across all trailer types.

Spot rates
Market conditions
Market
conditions
However, predicting freight spot rates remains premature. Although tariffs are expected to negatively affect demand, we are cautiously awaiting freight supply data before forecasting further rate decreases. The ongoing decline in tractor orders is a notable trend. A significant drop in trucking employment in next month's data could signal a tight market, similar to the initial phase of the COVID-19 pandemic, rather than a soft one. Our current outlook still projects a modest (low to mid single digits) increase in both spot and contract rates for 2025 compared to 2024.
3/3
The Class 8 tractor market is seeing further deceleration.
February saw U.S. tractor sales down 23.1% YoY and production decrease by 30.4%. Net Class 8 orders plummeted 36.5% m/m and were 42.6% below February 2024. With the prolonged soft market, shippers are considering replacing private fleet capacity with ample, cheaper for-hire capacity. Meanwhile, for-hire carriers remain hesitant to order trucks amid tariff uncertainty. ACT Research estimates that tariffs will increase the price of a new truck by about 4% to 7%.

Tractor orders
Before being paused on April 9, reciprocal tariffs were initially imposed on over 180 countries on April 2, increasing the weighted average tariff rate to 28%—the highest in over a century.
This created considerable uncertainty for both shippers and carriers. Most have adopted a "wait and see" approach, as they quantify potential cost increases and develop short-term and long-term strategies. However, some are already taking proactive steps. We observed a pull-forward of imports as shippers sought to secure inventory before the tariffs were implemented. As a result, short-term inventories appear sufficient to meet immediate demand.
However, this inventory accumulation is now slowing. Import and intermodal volumes have begun to decrease, and en-route freight volume appears reduced. In the short term, some shippers are even temporarily halting imports and domestic production at certain facilities.
We estimate a 1% rise in average tariffs to decrease truckload demand by 0.15% to 0.25%.
• A 10% base rate is estimated to reduce freight demand by about 2%.
• The initial rate of 29% is estimated to reduce demand by about 6%.
As tariffs on steel, aluminum, and finished autos remain in place, experts estimate the current (mid-April) average tariff rate at 18%, putting about 4% of U.S. freight volume at risk.
Click to jump to section
We estimate that a 1% increase in average tariffs could reduce truckload demand by 0.15% to 0.25%. Given the current average tariff rate of approximately 22.5% (mid-April estimate), about 4% of U.S. freight volume is at risk. While the freight market was headed towards a slow recovery before the tariffs, the recent disruptions are expected to prolong the current recession.
2/3
Tariffs are likely driving inflation higher, though not yet reflected by official statistics.
Industrial production of machinery, primary metals, and fabricated metals has remained relatively flat or slightly declined over the past year. A recovery in these sectors seems unlikely in the near future, as orders and shipments of core capital goods—a key indicator of manufacturing activity—have also stagnated.
Orders for core capital goods, which are nondefense capital goods excluding aircraft, are considered an early indicator of manufacturing activity. Weak orders and shipments in this sector suggest that a broader economic recovery may be delayed.


Analyzing the freight market this month is challenging due to tariff uncertainty. Most economic indicators, available only through March (pre-tariffs), are largely irrelevant. However, declining import and intermodal volumes suggest a decrease in overall volume.
1/3
Industrial equipment and supplies
Automotive
Auto manufacturing has been one of the bright spots in the economy over the past year, driven by pent-up demand and a shortage of vehicles at dealerships. While production rose to meet demand, the market is starting to show signs of saturation, with inventories gradually normalizing and potential glut looming on the wholesale side.


Paper and plastics
Paper and plastics are highly used in the packaging industry, which has been affected by the recent slowdown in food spending after the economy re-opened. In addition, the demand for paper products was already on a downward trajectory due to factors such as digitalization, adoption of alternatives (plastics), and growth of e-commerce. The pandemic further accelerated this decline. Moreover, a surge in downstream inventories led to a slowdown in manufacturers’ demand.


Nondurable consumer goods
Demand for food consumed at home fell from its pandemic highs as the economy re-opened, normalizing back to its pre-pandemic levels. Demand for other consumer goods (such as apparel) continues to be pressured by external competition, slowing consumer demand, and high downstream inventories.


Durable consumer goods
Durable consumer goods such as appliances, furniture, and wood products are affected by the ongoing housing recession. New home sales remain below the 2019 levels, and about 30% below the pandemic peak. Similarly, housing starts are at their lowest level since the beginning of the housing recession, 32% below the 2022 peak.


Despite being hit by significant tariffs, certain countries might emerge as winners.
The U.S. imported 206 million tons of containerized goods in 2024, 63 million of which came from China.


Reduced tariffs on electronics are unlikely to have an effect on freight demand.
The U.S. and China have implemented retaliatory tariffs on each other's imports, with rates exceeding 100%. This level is akin to an import embargo, given the typically elastic nature of import demand, where a 1% price increase leads to a greater than 1% decrease in import volume. Furthermore, actual embargoes have been imposed on specific goods, such as China's restrictions on rare earth metal exports and the cessation of Boeing orders.
While the U.S. administration noted that electronics and semiconductors were excluded from the tariff hikes and thus remained subject to a 20% rate, this offers limited benefit to the freight market. Despite their high dollar value, computers and electronics possess low tonnage. In 2024, these goods represented 28% of the value of imports from China but only 2.2% of the weight.
US / China trade war
Implications for freight
This month, forecasting is challenged by tariff uncertainty. Most models primarily rely on economic indicators, which are only available until March. Therefore, they may not reflect the impact of recent tariff news, and are mostly irrelevant. However, based on the recent market trends, we expect the following:
• Short-term: Anticipate reduced non-essential imports from China and manufacturing disruptions. Potential pre-stocking before the 90-day deadline may partially offset volume declines. Expect pre-stocking to decelerate as we approach the deadline, leading to declines in imports, intermodal, and truck volumes, particularly from Southern California.
• Long-term: Assuming no broader recession, freight demand should gradually recover as shippers adapt and shift to domestic suppliers. This adjustment may take several quarters, extending the current freight recession.
However, it's premature to predict freight spot rates. While tariffs should negatively impact demand, we are cautiously awaiting freight supply data before forecasting further rate decreases. The decreasing trend in tractor orders is already evident. A sharp decline in trucking employment in next month's data could indicate a tight market, similar to the onset of COVID-19, rather than a soft one. Currently, our outlook still projects a modest increase (low to mid single digits) in both spot and contract rates for 2025 compared to 2024.
Cost-saving strategies to navigate tariffs
At Uber Freight, our priority is to support shippers in navigating these evolving trade policies with cost-efficient solutions, customs expertise, and strategic supply chain planning. We can help shippers adjust to these changes by:
1. Identifying cost-saving opportunities: We are working closely with shippers to optimize transportation costs, explore alternative routes, and maximize efficiencies to help offset tariff impacts.
2. Streamlining cross-border logistics: With our in-house customs compliance team and strong relationships at the border, we are helping customers minimize delays and avoid unnecessary penalties. With flexible multimodal solutions—whether it’s OTR, intermodal, or ocean, our network offers multiple transport options to optimize costs and ensure supply chain continuity.
3. Proactive guidance & compliance support: Our experts are closely monitoring policy updates and working with businesses to adjust supply chain strategies in real-time.
Short-term outlook
April is typically a soft month across most of the U.S., with the exception of Southern Texas and Southern Florida, where increasing produce volumes can lead to some moderate tightness.
As produce volumes increase in May and June, market tightness extends northward. This increase in spot rates between April and June, typically 5% to 8%, often indicates the freight market's trend for the rest of the year. A rate increase exceeding 8% could signal significant market tightening, while an increase below 5% would suggest softening on a seasonally adjusted basis.
Despite rising truckload and record-high LTL rates, intermodal rates remain depressed due to ample capacity. Linehaul and all-in rates are down 6.3% and 7.3% year-over-year, respectively. However, given the typical one-quarter lag between intermodal and truckload rates, further declines are improbable.


As produce volumes increase in May and June, market tightness extends northward. This increase in spot rates between April and June, typically 5% to 8%, often indicates the freight market's trend for the rest of the year. A rate increase exceeding 8% could signal significant market tightening, while an increase below 5% would suggest softening on a seasonally adjusted basis.
