The Freight Economist
November 2025
Executive summary
Monthly economic and market update
Class 8 tractor
production is down
38% year-over-year.
U.S. economy
SNAP Benefits
Tariff Dividends
Tariffs


Freight demand
Imports
Manufacturing
Spending
on goods


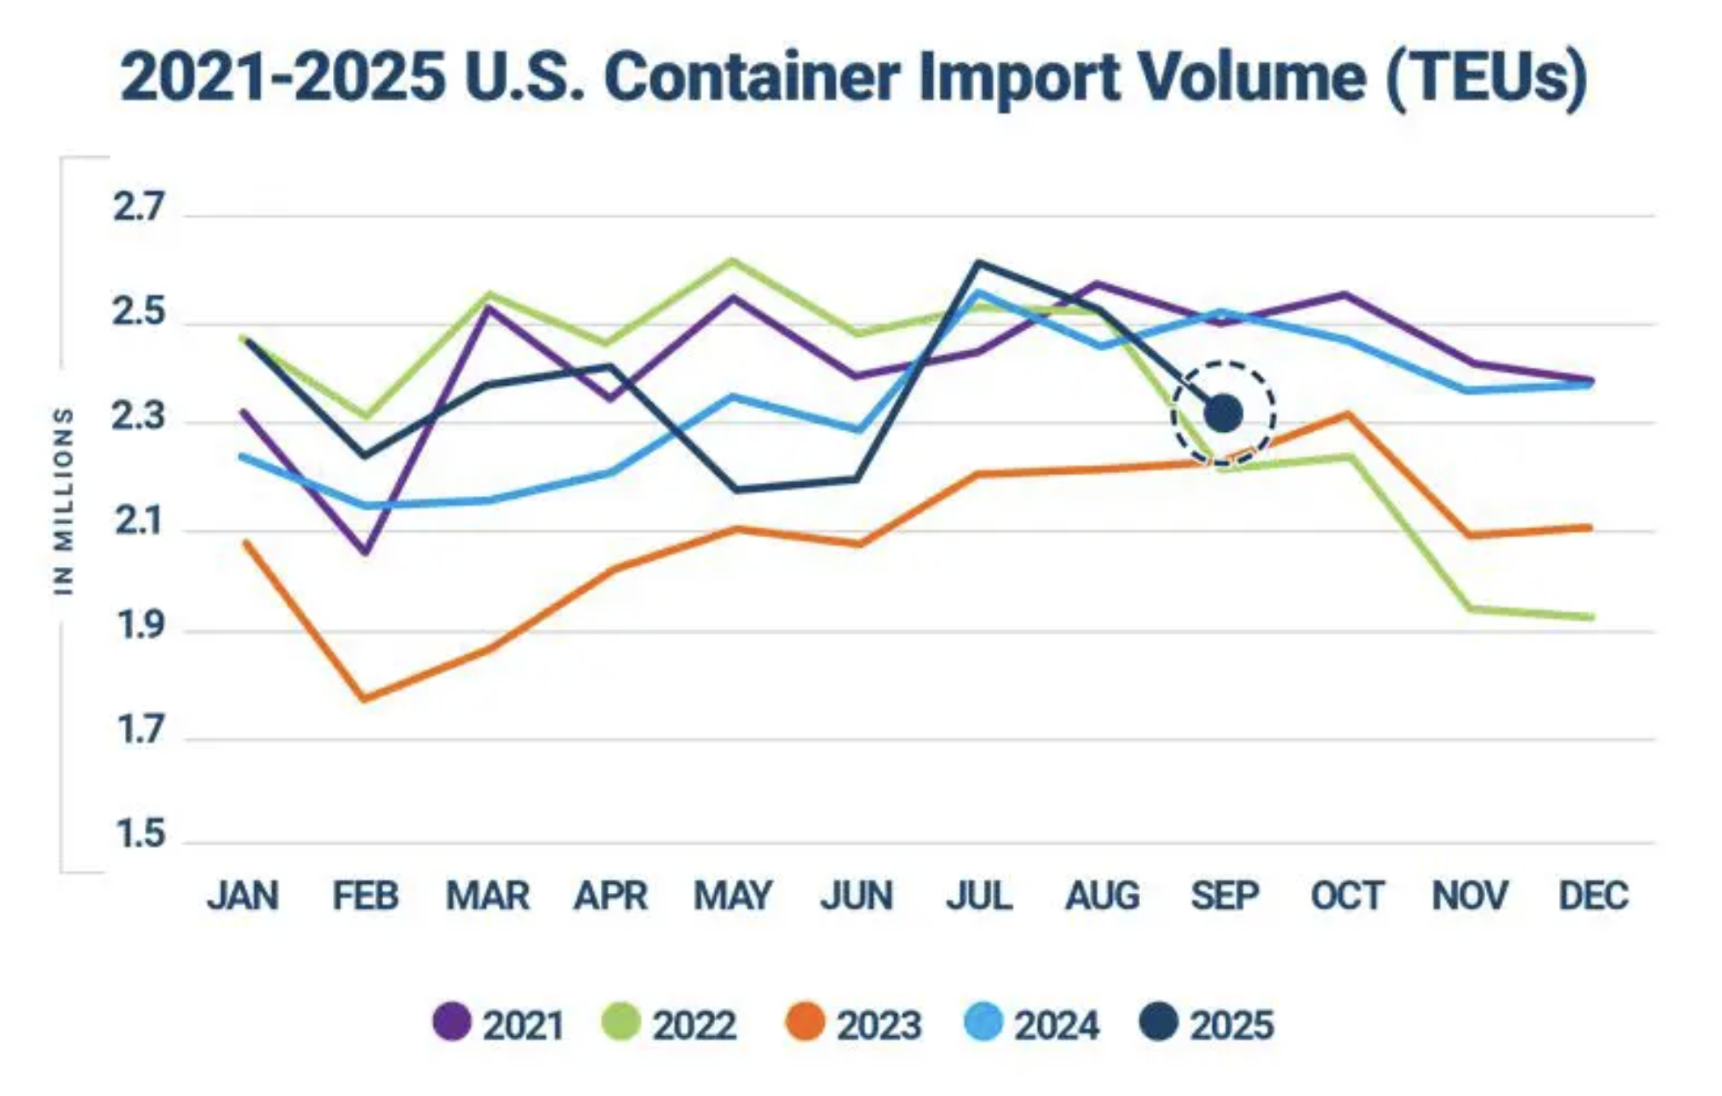
Containerized imports fell in October despite seasonal tailwinds.
Imports
What does it mean for truck tonnage?
Spending on goods
Key data points and commentary
Trucking
volume

Intermodal
rates

Geographic
trends

Routing guide trends

Routing guide trends
Geographic trends

Trucking volume
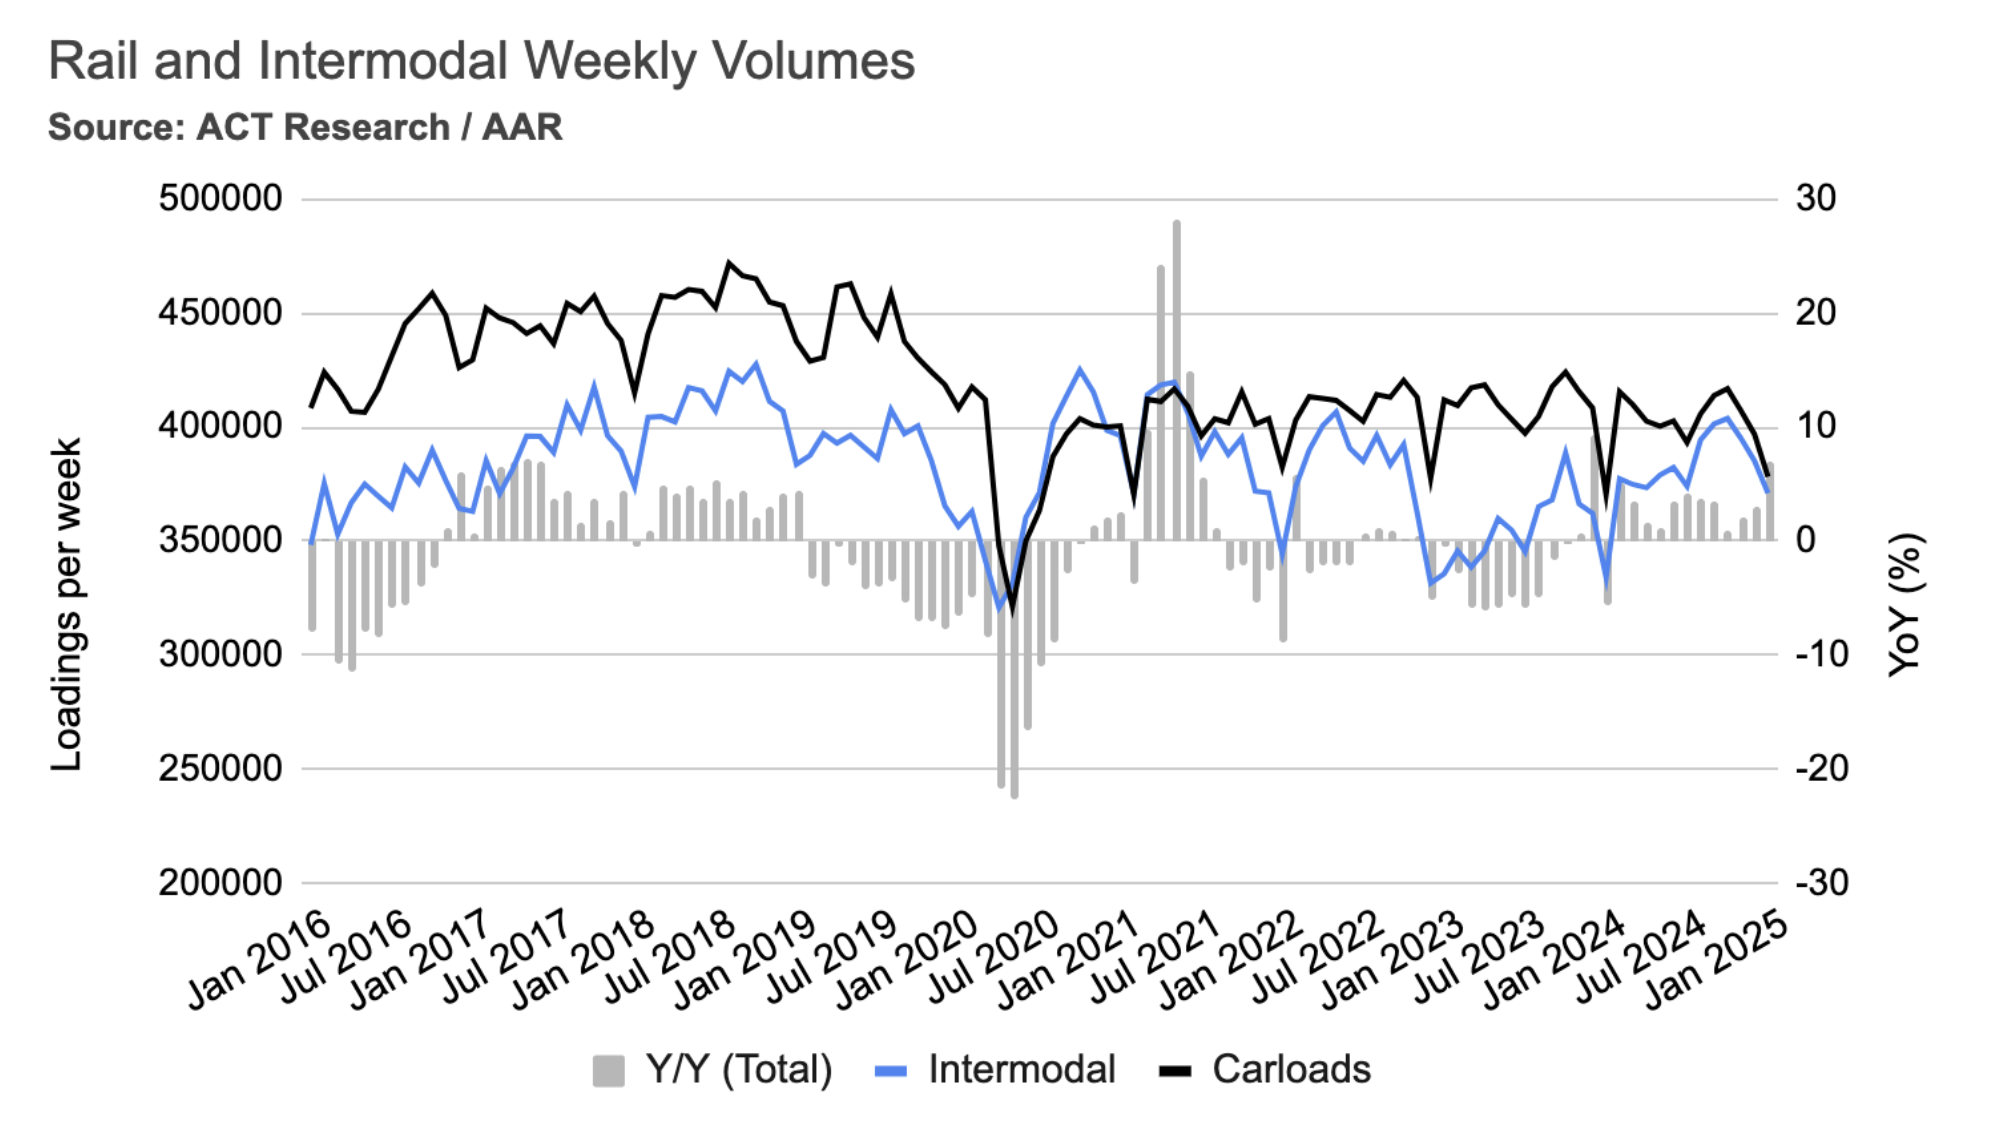
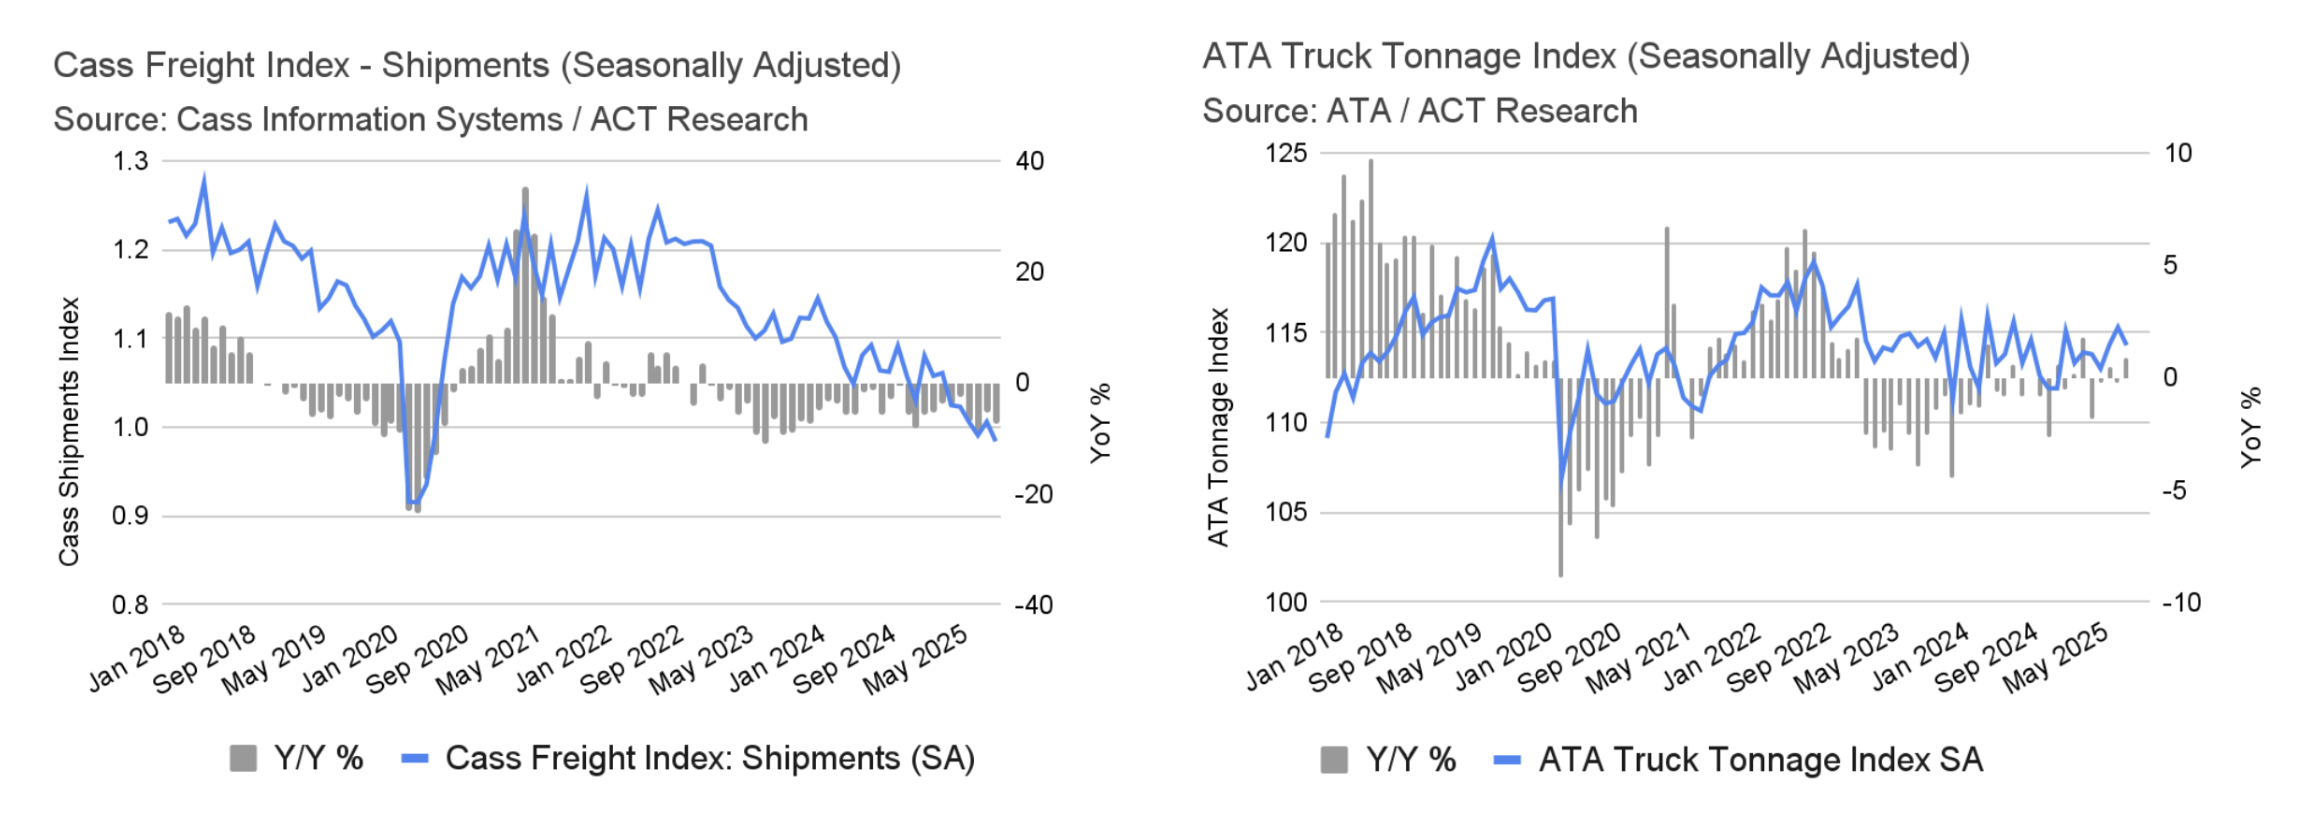
The Cass Freight Index shipments index fell sharply in October, dropping 4.3% month-over-month and accelerating the year-over-year decline to 7.8%. This weakness is concentrated in Less-Than-Truckload (LTL) freight because shippers are consolidating smaller loads into larger truckloads, according to ACT Research. Similarly, the American Trucking Associations’ Truck Tonnage Index saw a 0.9% decline in September, reaching its lowest level in three months. Despite this, overall tonnage levels are up 2.1% since the low point recorded in January, and up 0.8% compared to September 2024.
Intermodal rates
In January, average weekly intermodal loads decreased by 3.7%, and weekly carloads dropped by 4.7%. However, compared to the same time last year, intermodal volumes were significantly higher, up 11%, and carloads increased by 2.1%. It's worth noting that this January's declines were less severe than those of the previous year, which saw 7.7% and 9.3% reductions in intermodal and carload loadings, respectively.
Mazen’s work focuses on analyzing the freight transportation landscape, and producing short- and long-term forecasts based on supply and demand dynamics. He is also a research affiliate with the Intelligent Transportation Systems (ITS) Lab at MIT, where he completed his PhD in 2019. His work falls at the intersection of ITS, economic modeling, and analytics.
mdanaf@uberfreight.com
By Mazen Danaf, Senior Economist and Applied Scientist, Uber Freight
Featuring insights and contributions from Uber Freight leadership,
technologists and market specialists.

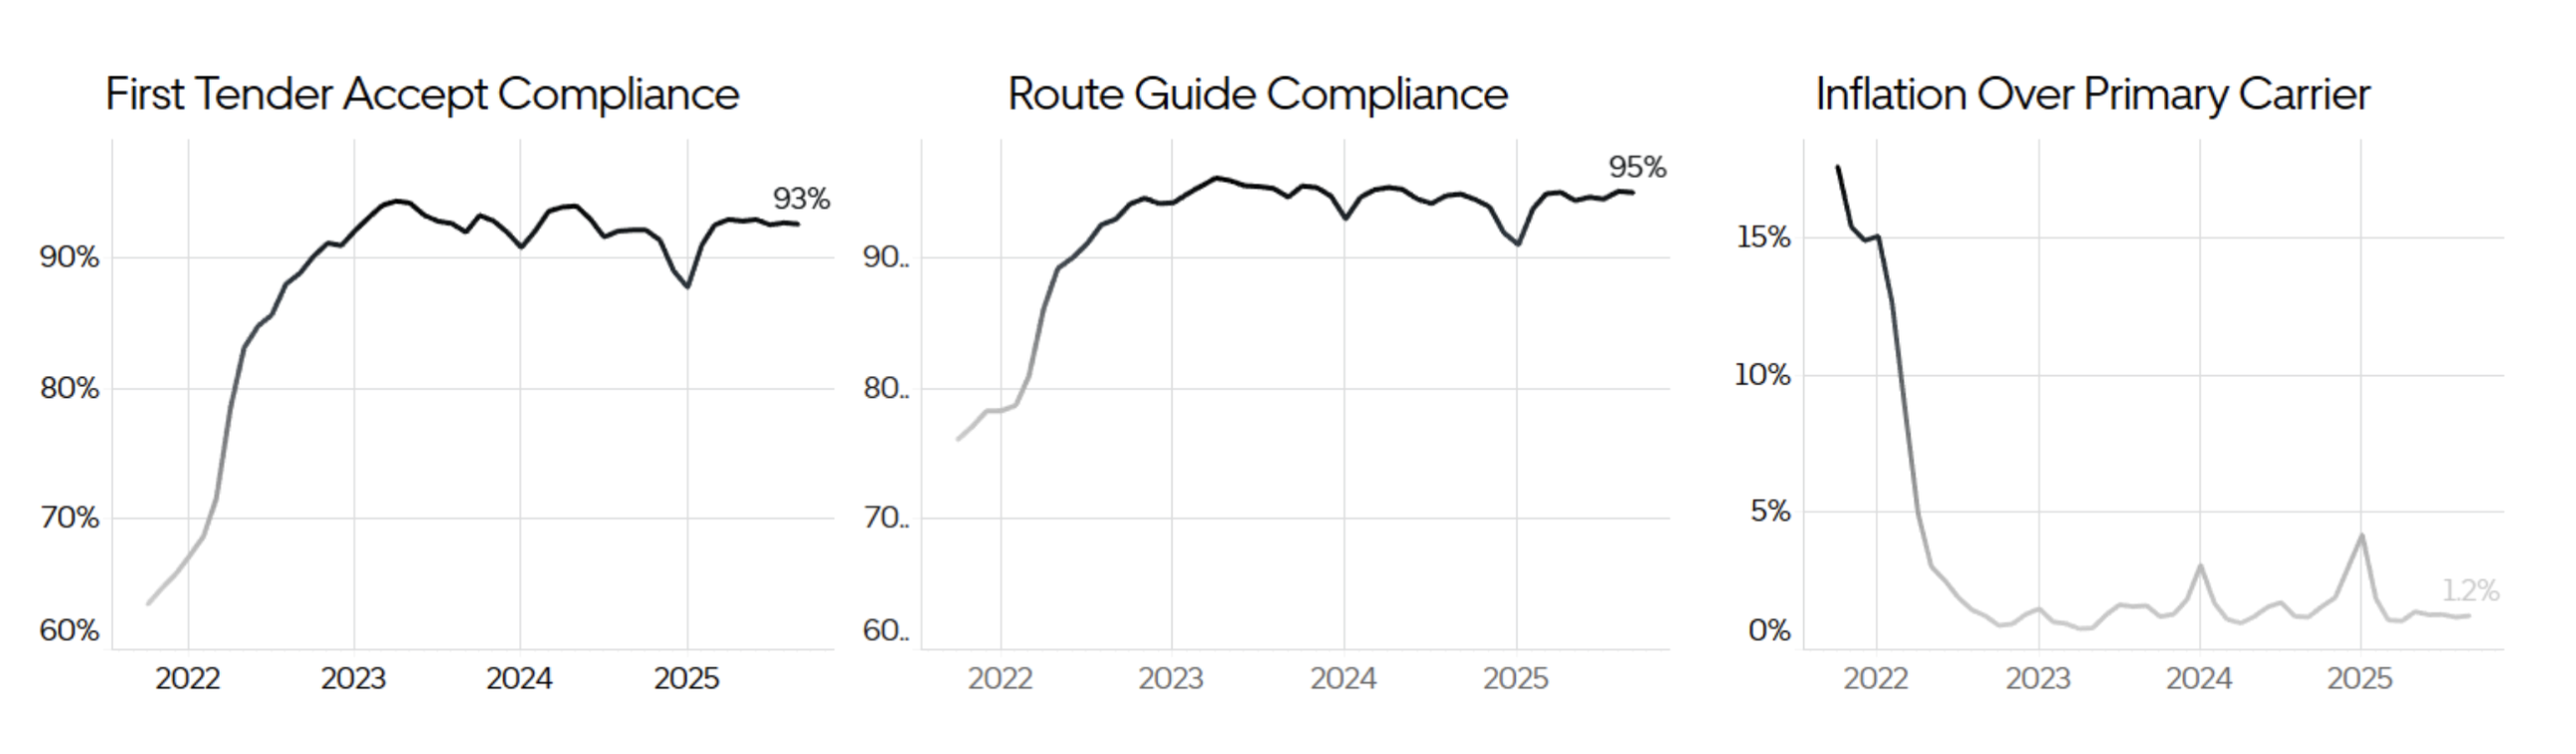
Route guide performance remained robust in October. The average First Tender Acceptance Rate remained unchanged at 93%, and Route Guide Compliance held at 95%. Tender rejections are resulting in a slight cost increase of 1.4% over the primary carrier, up from 1.2% in September. This marginal increase indicates that route guide failure remains de-risked.
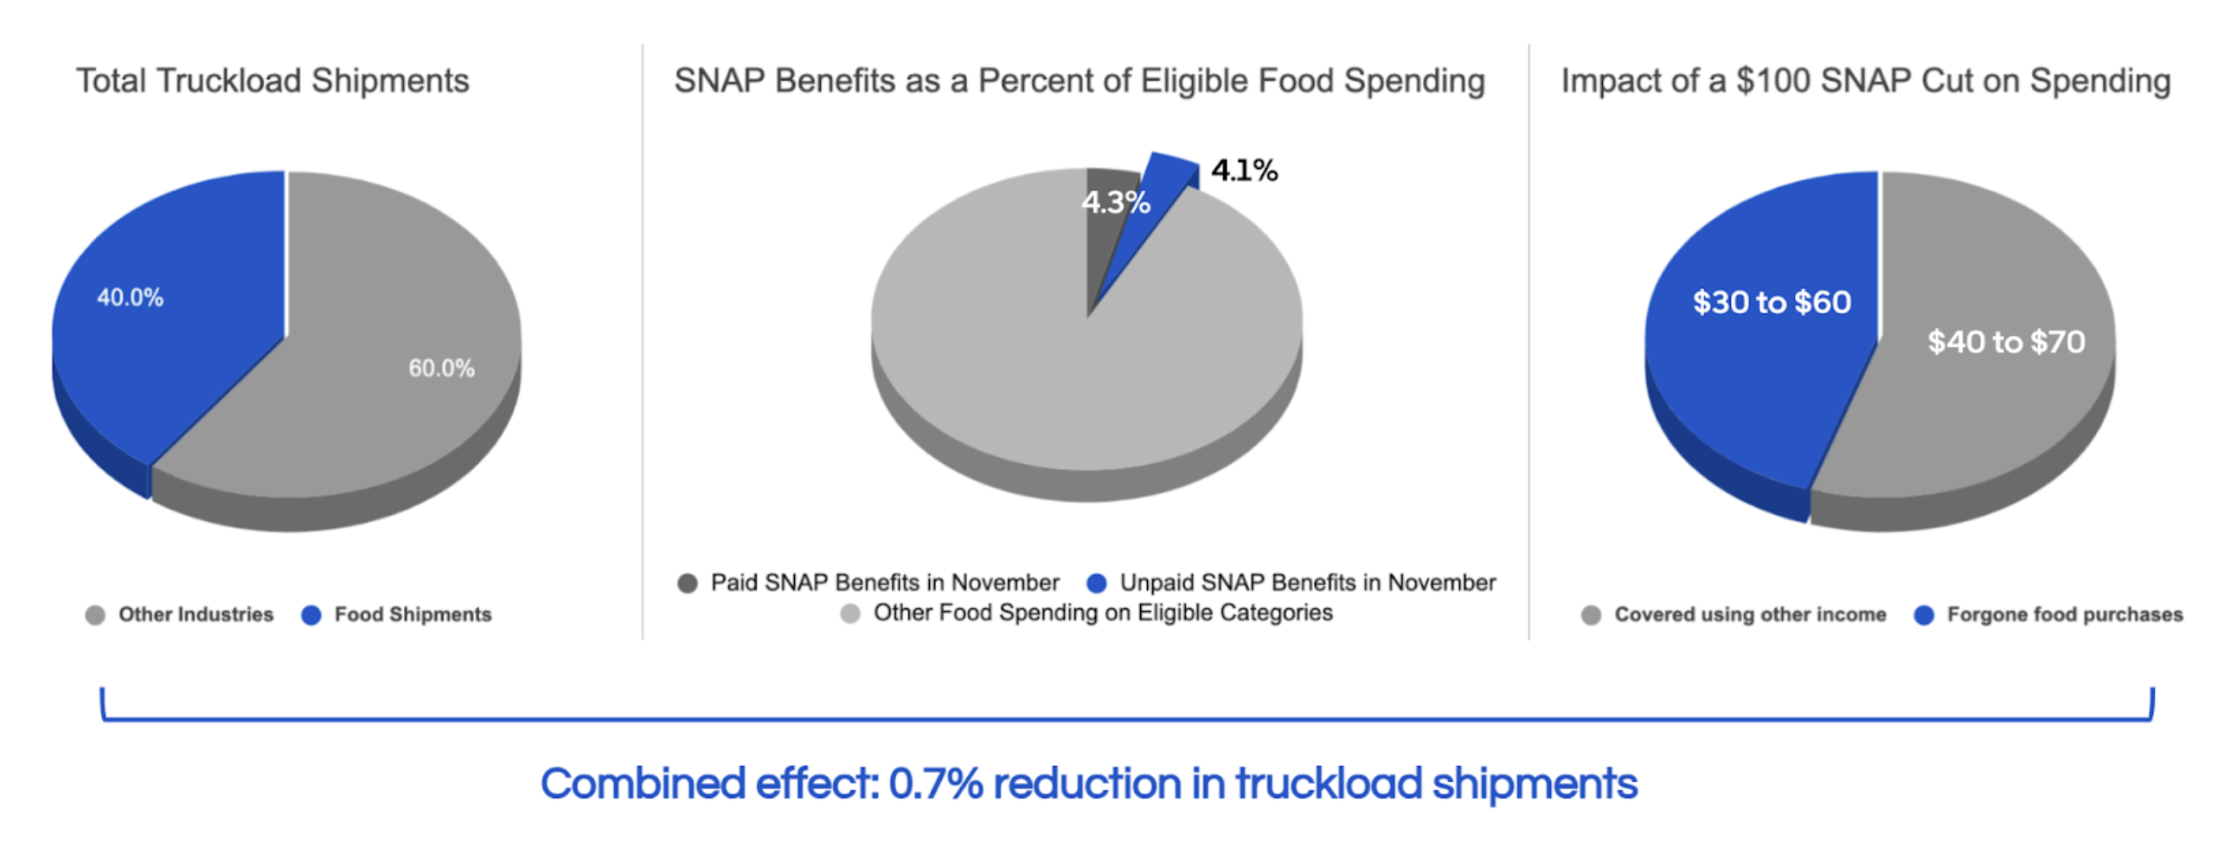
Due to the government shutdown, November SNAP payments are partially funded at $4.65 billion, down from the typical $8 billion. Food accounts for approximately 40% of U.S. truckload shipments, and a $100 SNAP cut typically correlates to a $30–$60 drop in food spending. Therefore, reduced SNAP benefits are projected to result in a 0.7% decline in U.S. truckload volumes.

Executive
summary
U.S.
economy
Freight
demand
Freight
supply
SNAP Benefits
Average m/m and y/y van spot rate index by destination regions – August
Source: DAT
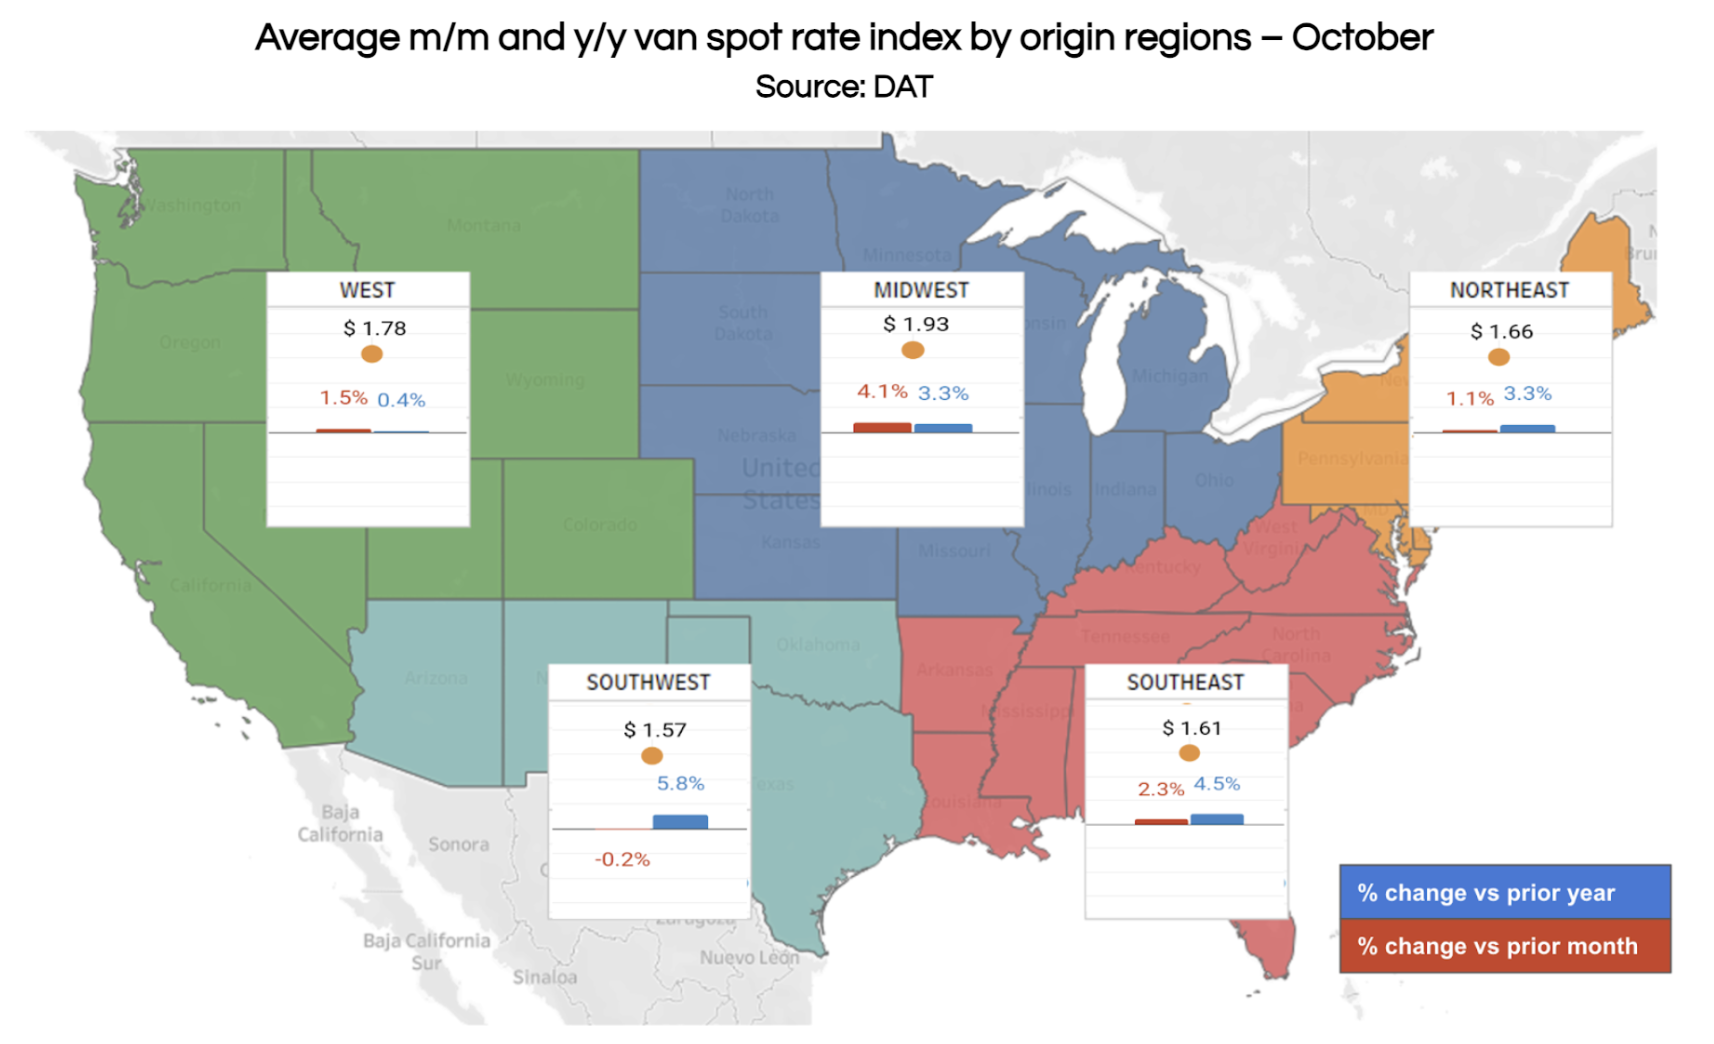
Spot rates increased across all regions in October, with the Southwest being the sole exception, experiencing a 0.2% month-over-month decline. While the gains in the West, Midwest, and Northeast were seasonally anticipated, the 2.3% jump in the Southeast was counter-seasonal. On a year-over-year basis, rates were higher across the board; the Southwest saw the largest increase (5.8% YoY), while the West posted the smallest (0.4% YoY), partially due to weaker imports following tariff disruptions.
Key data
points
Freight Supply
Carrier Population
Consumer spending remained robust in October, but tariffs are impacting retail volumes.
Inflation

Truckload demand slowed in June after a pre-stocking surge.
In August, truckload demand remained largely flat. A slight increase in retail and manufacturing demand was counteracted by a significant drop in imports. Consumer-driven demand rose 3.2% year-over-year, while manufacturing demand decreased by 0.2%. Full visibility into all demand indicators, such as wholesalers' sales and inventories, was not possible due to the government shutdown.


1/2
2/2
Freight demand remains choppy due to tariffs affecting manufacturing and retail. The ISM PMI has shown manufacturing contraction for eight consecutive months. Although consumer spending is up since early 2025, according to Bank of America data, the transaction volume is flat, suggesting tariffs are increasing the average price per transaction. However, a potential demand shock looms as President Trump plans to distribute a $2,000 "tariff dividend" to 150 million individuals earning under $100,000. This stimulus is expected to boost consumer spending, especially on durable goods, potentially providing the necessary catalyst for the trucking industry’s recovery.
1/3
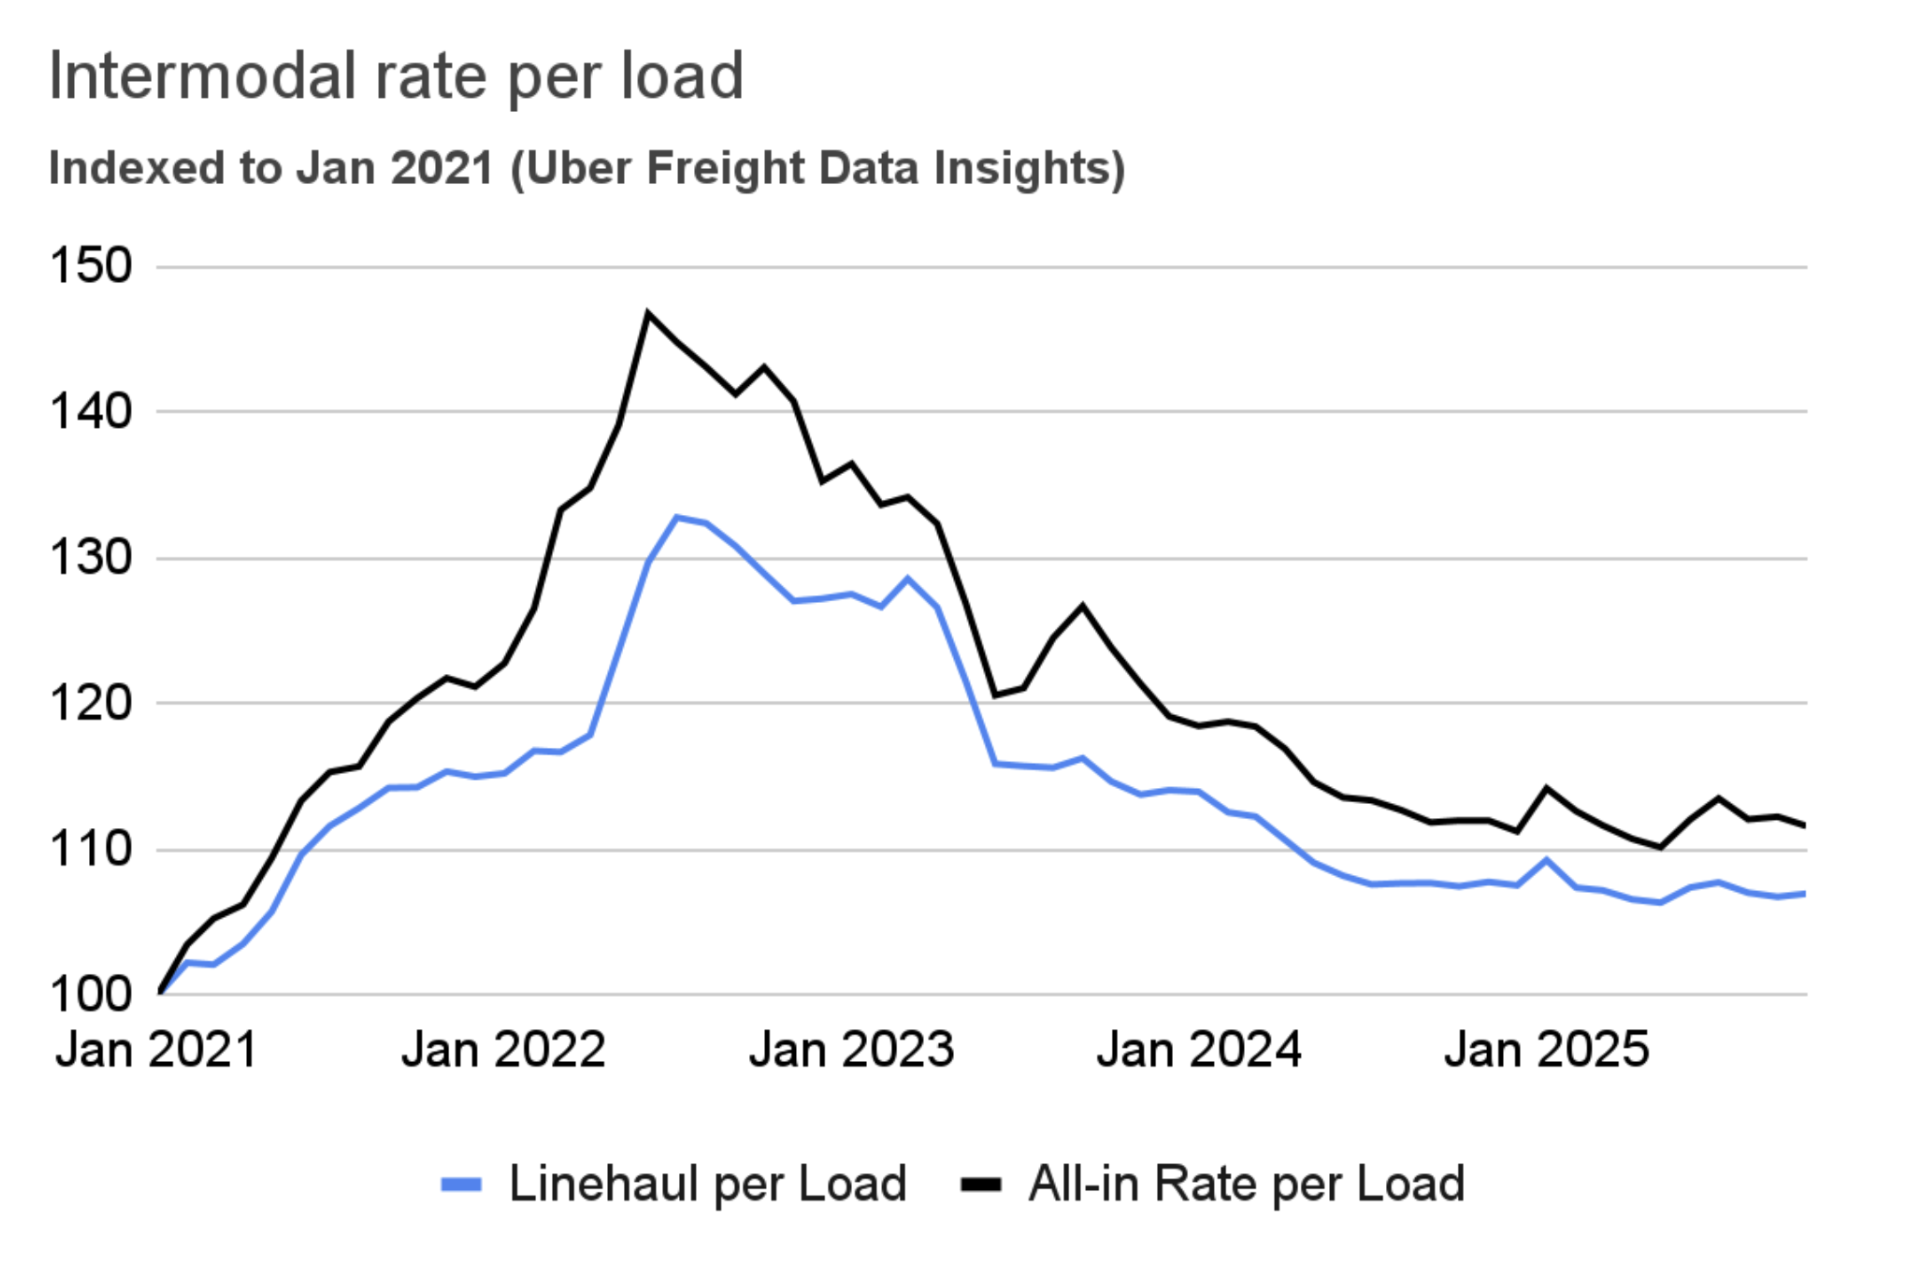
The intermodal linehaul rate per load edged up a mere 0.2% in October, yet it remains 0.5% lower year-over-year, according to Uber Freight’s data. However, falling fuel prices caused the all-in rate per load to decline slightly by 0.6%, leading to a $0.3 year-over-year drop. Intermodal rates continue to lag truckload contract rates, which have held flat for several quarters. As a result, we do not anticipate any significant movement in intermodal rates until truckload rates recover.
2/2
Shipper and carrier insights
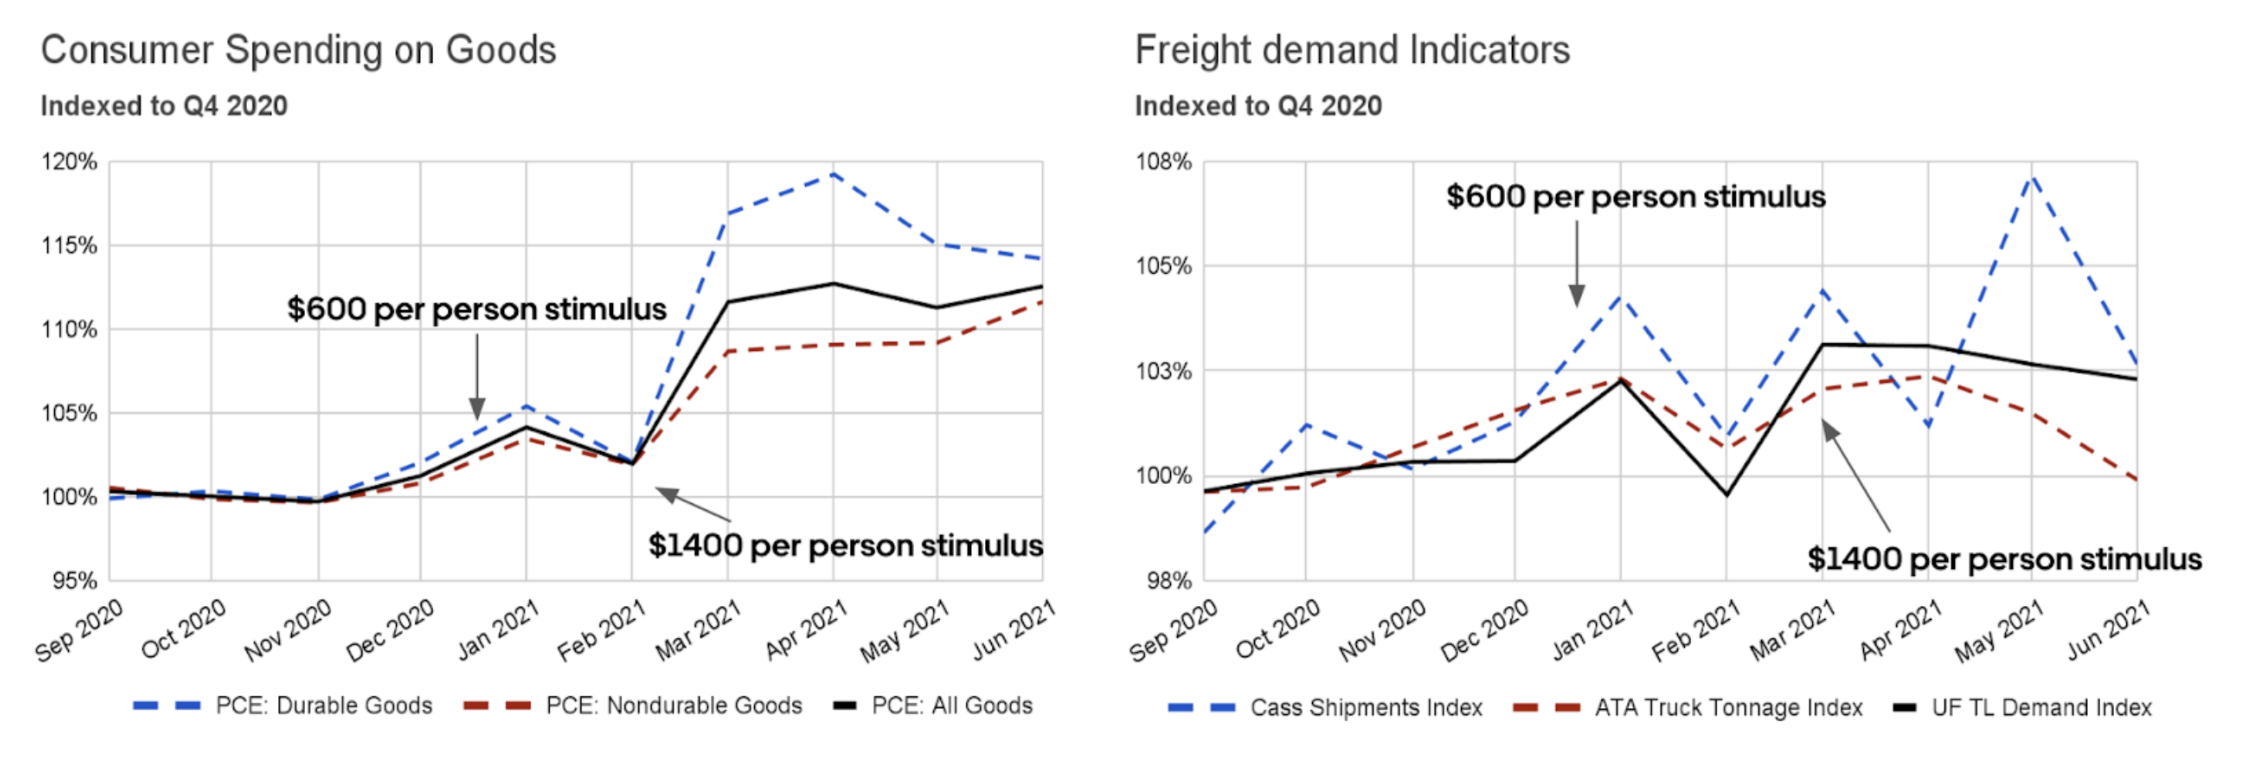
President Trump has announced a plan to distribute $2,000 per person to 150 million individuals earning less than $100,000 annually. This is expected to resemble previous stimulus rounds, which significantly boosted consumer spending, particularly on durable goods (big-ticket items), during the COVID-19 pandemic. We can analyze the impact of the two main COVID-era stimulus packages (excluding the initial CARES Act due to unreliable signals at the pandemic's onset):
• Consolidated Appropriations Act ($600 per person): This bill led to a goods spending spike of approximately 3% to 5% above Q4 2020 levels in January 2021. Durable goods spending surged more than non-durables. Freight indicators showed corresponding increases: the Uber Freight Truckload Demand Index and the ATA Tonnage Index both rose by 3% above Q4 2020 in January, while the Cass Shipments Index surged by 5%.
• American Rescue Plan Act ($1,400 per person): This larger payment resulted in even bigger spikes. Goods spending soared by 12% to 13% above Q4 2020 levels. Spending on durables increased by over 15%, while non-durables rose by 9%. Freight demand also saw a lift: Uber Freight’s Truckload Demand Index increased by 3% to 4%, and the Cass Shipments Index showed a similar, though more volatile, increase over subsequent months. The ATA Truck Tonnage Index showed a smaller increase of less than 3%
Tariff Dividends
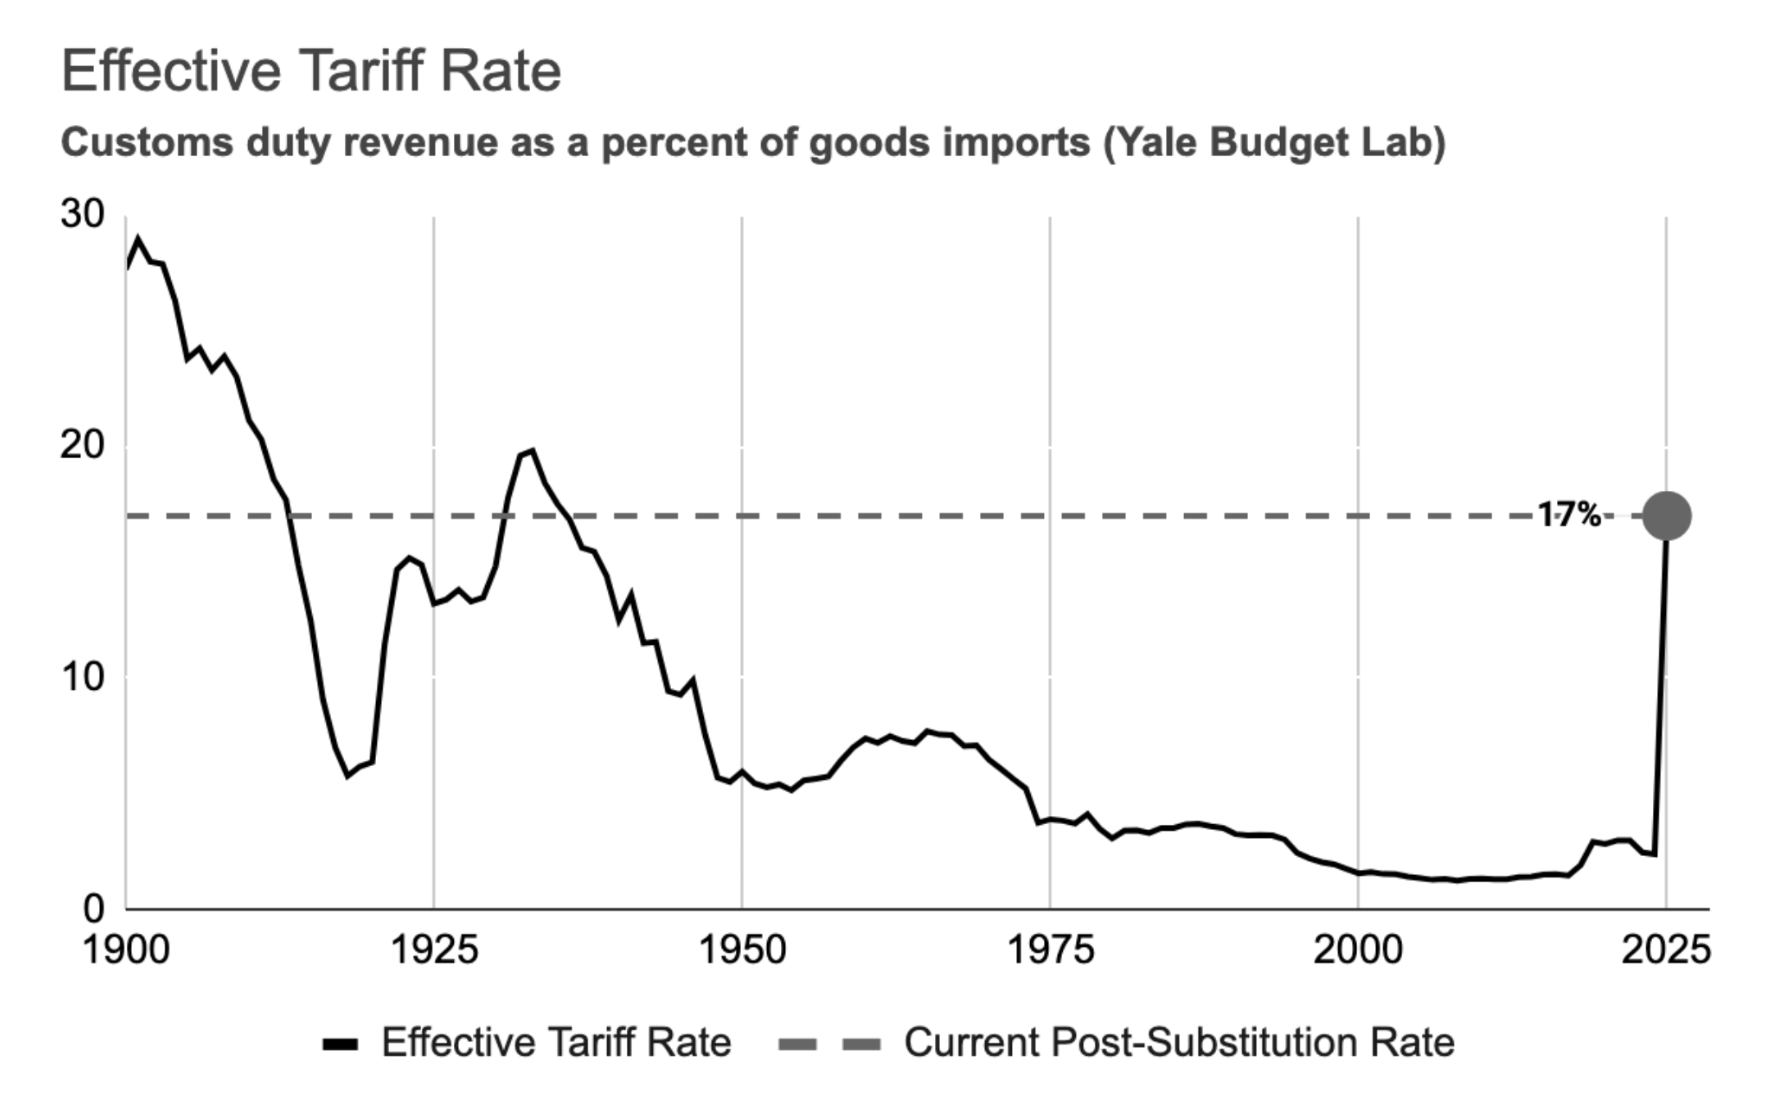
The average effective tariff rate reached 17% in October, the highest level since 1936, according to the Yale Budget Lab. This is expected to increase consumer prices by 1.3%, resulting in an average annual loss of $1,800 per household. The tariffs disproportionately impact clothing, footwear, autos, electrical equipment, manufacturing commodities (metals and minerals), and machinery.
Inflationary signals have recently appeared. The manufacturing (ISM PMI) and wholesale (PPI) sectors first saw these initial signs, and the retail sector followed in September, when goods’ prices climbed 1.5% higher than the previous year.
On the positive side, the White House outlined a one-year trade truce on November 1st, which is expected to cut the average U.S. tariff rate on Chinese imports from 57% to 47%. This truce also includes China suspending its additional 24% retaliatory tariff on certain U.S. goods for one year (a 10% base tariff remains) and pulling back export controls on rare earth minerals.

Tariffs
In the long run, tariffs might boost domestic freight by giving local manufacturers an edge. However, the magnitude and sudden implementation of tariffs means we probably won't see benefits for a while, and the immediate damage will be greater.
Unlike Canada and Mexico, the 10% percent tariffs on Chinese products went into effect on February 4, and are likely to stay. Tariffs on China were already anticipated by shippers, some of which pulled imports forward in 2024.
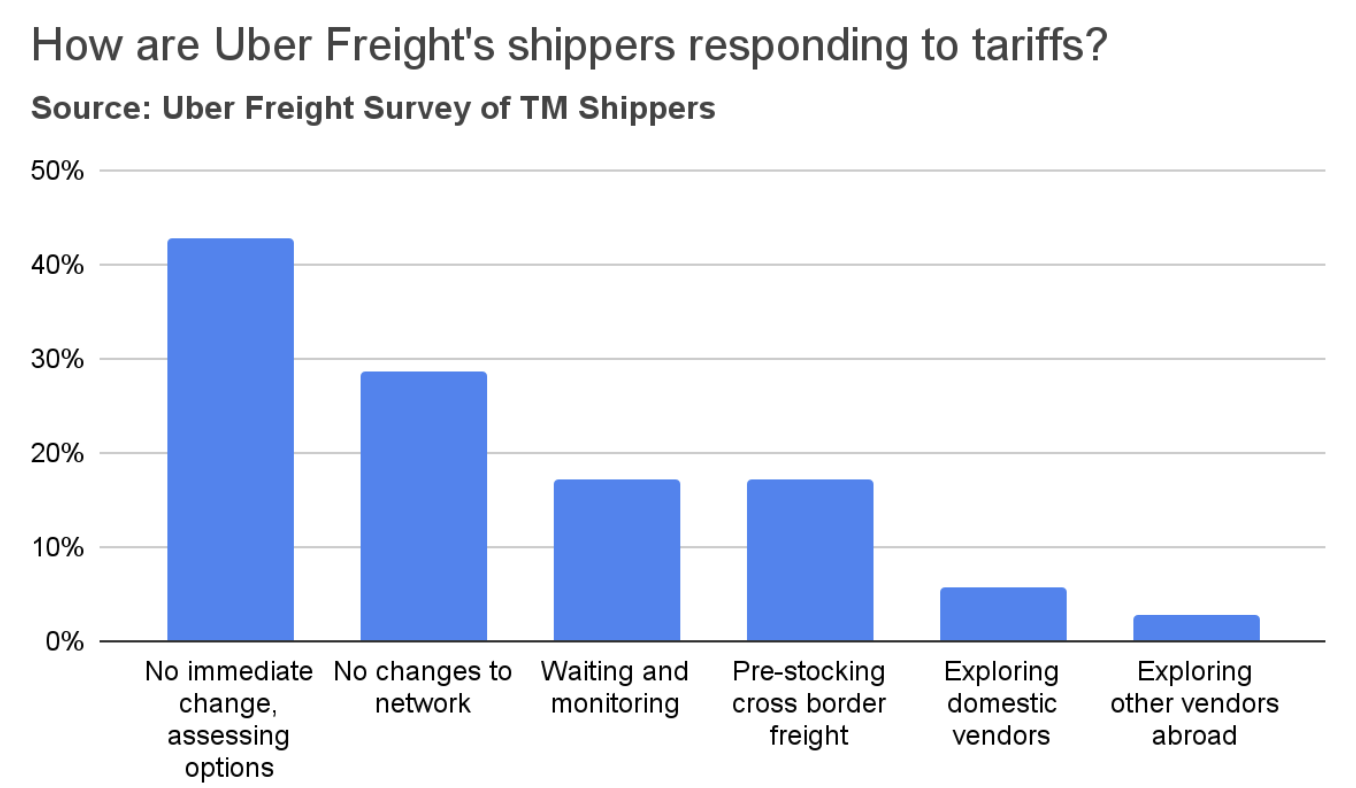
A survey of Uber Freight shippers found that the majority do not foresee immediate changes to their networks. However, a significant minority (42%) are actively assessing various options. Some shippers reported that they anticipate absorbing cost increases and subsequently passing those increases on to their customers. Seventeen percent of shippers indicated they are pre-stocking cross-border inventories. In contrast, very few are exploring domestic alternatives or alternative vendors in countries not impacted by tariffs. Some expressed concerns that it will take several months to adapt their networks.
Inflation


The U.S. manufacturing sector continued to contract in October.
Manufacturing
The ISM report also highlighted widespread concerns among manufacturers about declining demand and order levels. Respondents across various sectors expressed pessimism about the near-term outlook.
Manufacturing

2/2
Freight supply
Spot and
contract rates

Carrier
population

Tractor orders

Tractor ordering season is off to a weak start.
Tractor orders
Spot and contract rates rose in October across all trucking modes.
Spot and contract rates
Market conditions
Market
conditions
In October, spot and contract rates for all truckload trailer types saw low single-digit increases. However, these rates are only slightly above year-ago levels, indicating a mild year-over-year tightening. This is significantly below initial expectations and forecasts for 2025.
3/3
The emergency order targeting non-domiciled CDLs is being challenged in court.

Carrier population
As 2025 draws to a close, shippers need to finalize their budgets for the upcoming year. Effective budgeting goes beyond simply estimating spot and contract rates and volumes; shippers should prepare for various market scenarios to ensure their businesses remain resilient against potential market challenges.
For the past three years, shippers have benefited from a soft freight environment, particularly in the spot market. This period saw not only a decrease in costs but also sustained, historically high routing guide performance, evidenced by low tender rejection rates. This allowed shippers to benefit strategically from favorable spot rates while maintaining predictability in their networks.
However, this soft market may not persist throughout 2026. Shippers should anticipate potential routing guide degradation, especially with carriers with whom they lack robust relationships. Shippers must anticipate potential market tightening due to two primary risks:
1. Capacity Crunch: The market could lose 5% to 9% of its capacity if the FMCSA rule targeting non-domiciled CDLs is enacted.
2. Demand Shock: A sudden increase in demand, such as that caused by the tariff dividends proposed by President Trump (as previously discussed), is also a significant risk.
Scenario Planning
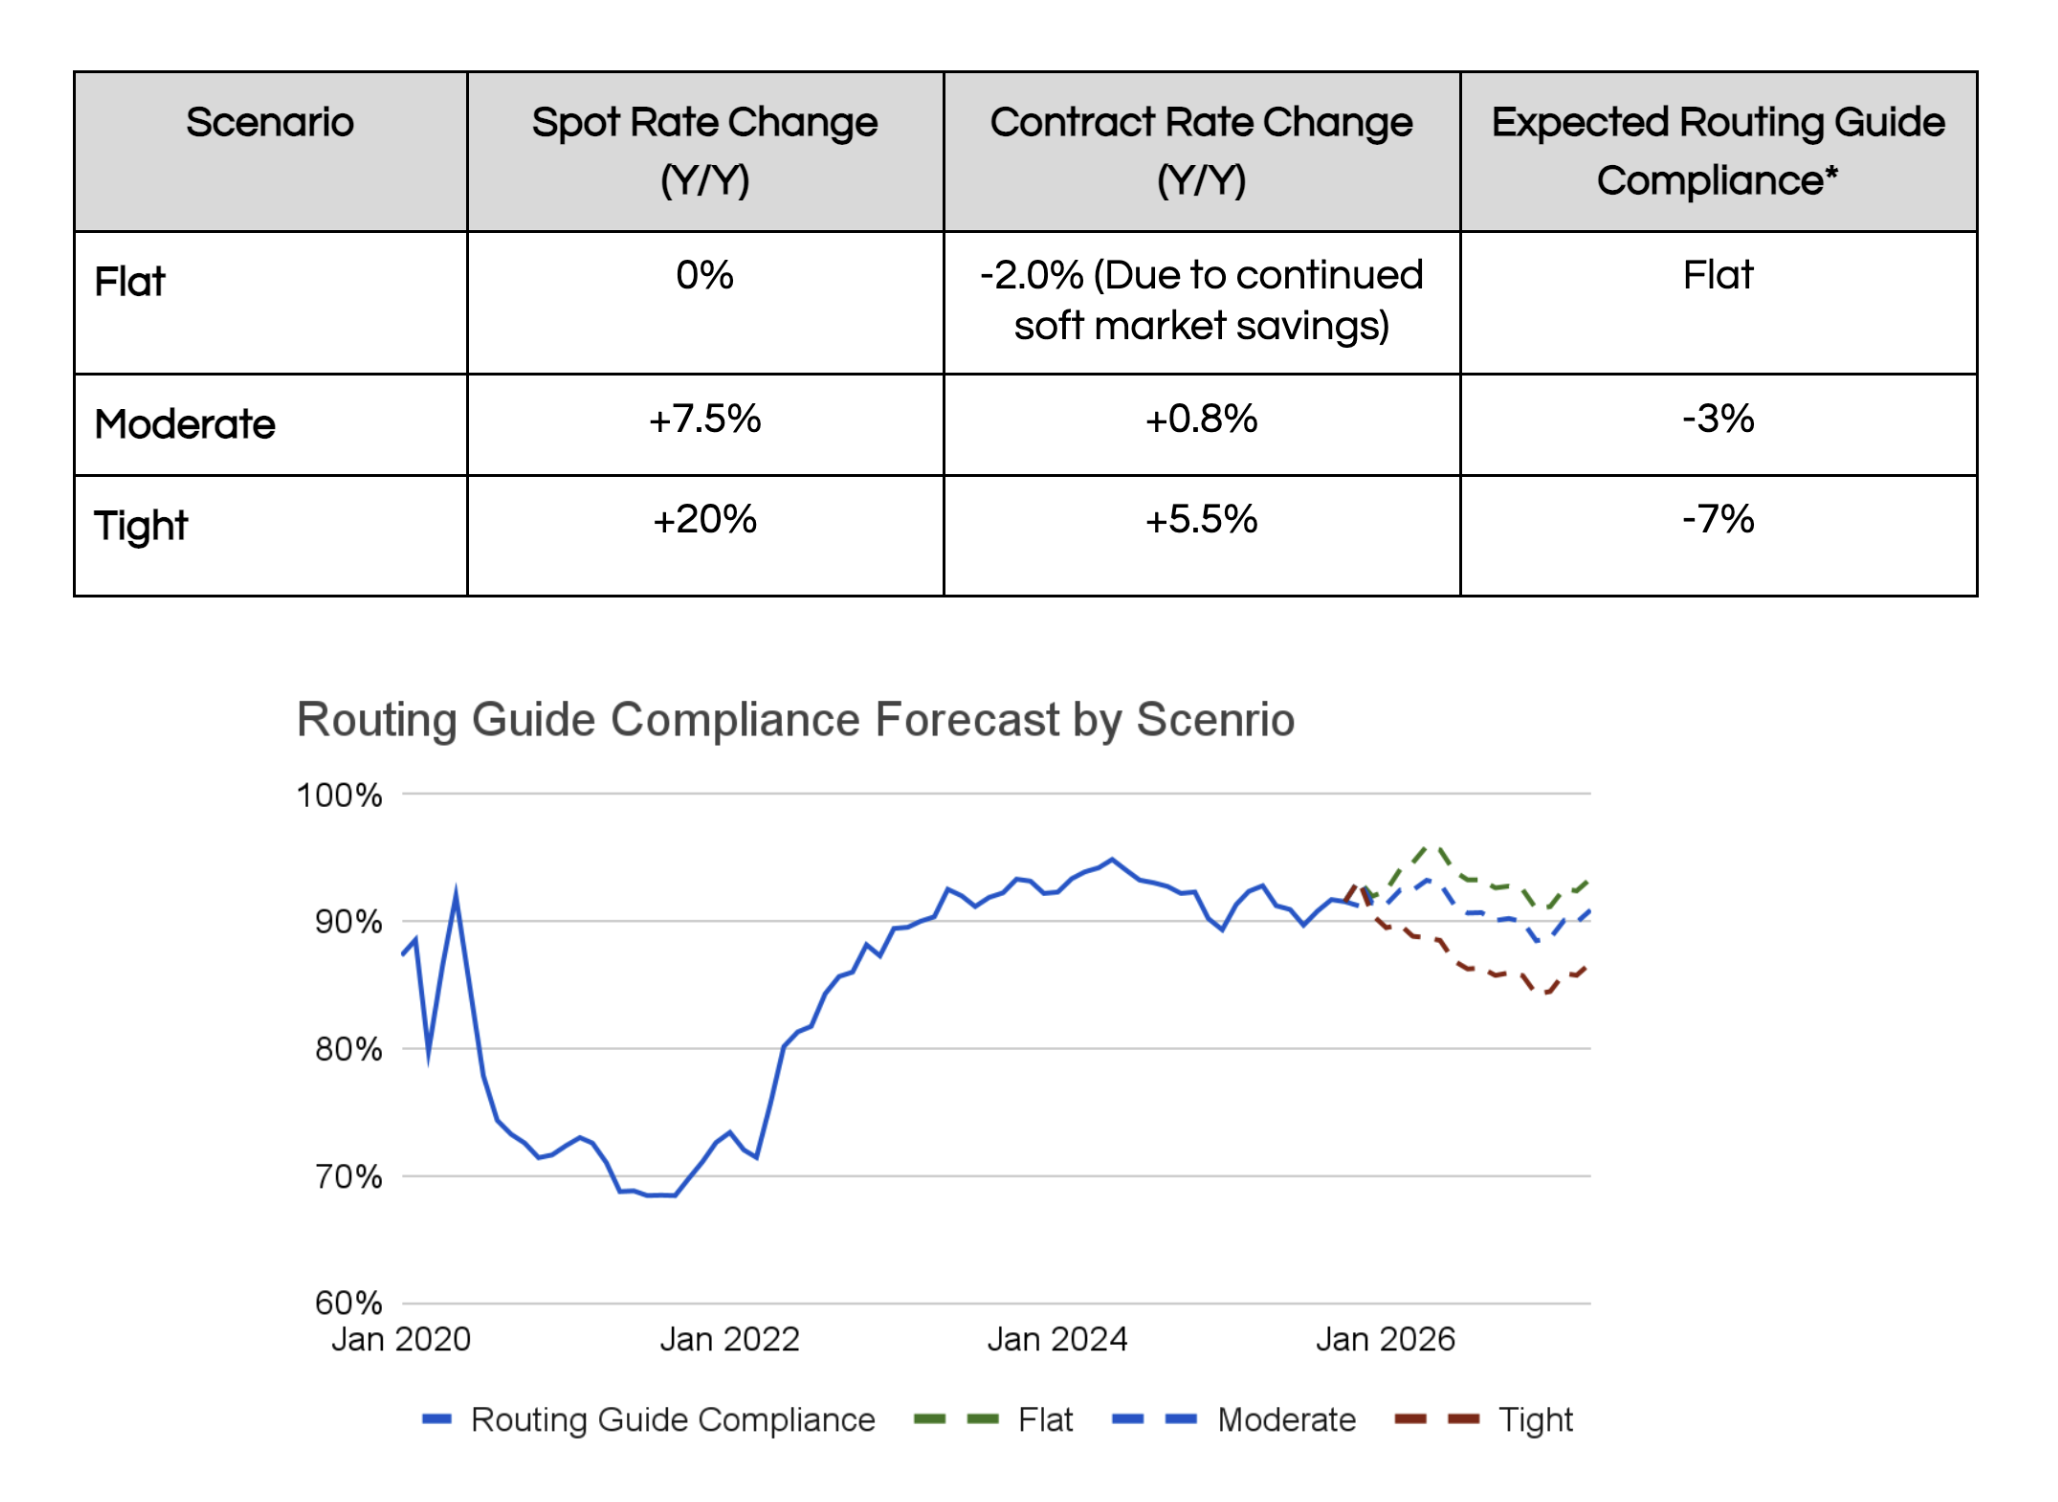
It is crucial to understand the relationship between spot and contract rates and routing guide performance. When spot rates increase, tender rejections typically react immediately and rise concurrently. In contrast, contract rates increase more slowly, as they must be repriced or allowed to expire. The difference between spot and contract rates is the primary driver of tender rejections, as carriers seek more profitable opportunities in the spot market.
Uber Freight has analyzed three specific scenarios for potential market tightness in 2026:
• Flat Scenario: Spot rates remain unchanged year-over-year.
• Moderate Scenario: Spot rates rise by 7.5%, consistent with various internal and external forecasts.
• Tight Scenario: Spot rates surge by 20%, representing the highest end of both our internal and tracked external forecasts.
Utilizing our extensive dataset—which includes $20 billion in Freight Under Management, data from hundreds of carriers and shippers, and millions of truckload shipments—we developed forecasts for contract rates and routing guide compliance under each scenario:
Click to jump to section
In the freight market, a court challenge to the Transportation Secretary’s order to stop issuing and renewing non-domiciled Commercial Driver's Licenses (CDLs) is not enough to ease concerns over a capacity crunch in 2026. The FMCSA estimates this mandate could remove about 194,000 drivers in the next two years. In response to these uncertainties, carriers are showing caution with a weak start to the tractor peak ordering season. Year-over-year declines are stark: Class 8 tractor orders are down 21%, sales have dropped 32%, and production is 38% lower.
2/3
Tariff dividends could deliver the demand shock the trucking industry has been waiting for.
Industrial production of machinery, primary metals, and fabricated metals has remained relatively flat or slightly declined over the past year. A recovery in these sectors seems unlikely in the near future, as orders and shipments of core capital goods—a key indicator of manufacturing activity—have also stagnated.
Orders for core capital goods, which are nondefense capital goods excluding aircraft, are considered an early indicator of manufacturing activity. Weak orders and shipments in this sector suggest that a broader economic recovery may be delayed.


Freight demand remains choppy due to tariffs affecting manufacturing and retail. The ISM PMI has shown manufacturing contraction for eight consecutive months. Although consumer spending is up since early 2025, according to Bank of America data, the transaction volume is flat, suggesting tariffs are increasing the average price per transaction. However, a potential demand shock looms as President Trump plans to distribute a $2,000 "tariff dividend" to 150 million individuals earning under $100,000. This stimulus is expected to boost consumer spending, especially on durable goods, potentially providing the necessary catalyst for the trucking industry’s recovery.
1/3
Industrial equipment and supplies
Automotive
Auto manufacturing has been one of the bright spots in the economy over the past year, driven by pent-up demand and a shortage of vehicles at dealerships. While production rose to meet demand, the market is starting to show signs of saturation, with inventories gradually normalizing and potential glut looming on the wholesale side.


Paper and plastics
Paper and plastics are highly used in the packaging industry, which has been affected by the recent slowdown in food spending after the economy re-opened. In addition, the demand for paper products was already on a downward trajectory due to factors such as digitalization, adoption of alternatives (plastics), and growth of e-commerce. The pandemic further accelerated this decline. Moreover, a surge in downstream inventories led to a slowdown in manufacturers’ demand.


Nondurable consumer goods
Demand for food consumed at home fell from its pandemic highs as the economy re-opened, normalizing back to its pre-pandemic levels. Demand for other consumer goods (such as apparel) continues to be pressured by external competition, slowing consumer demand, and high downstream inventories.


Durable consumer goods
Durable consumer goods such as appliances, furniture, and wood products are affected by the ongoing housing recession. New home sales remain below the 2019 levels, and about 30% below the pandemic peak. Similarly, housing starts are at their lowest level since the beginning of the housing recession, 32% below the 2022 peak.


A one-year trade truce between the U.S. and China signals de-escalation.
Reduced SNAP benefits in November could decrease U.S. truckload demand by 0.7%.
Tariffs are driving up consumer goods prices.
Inflation
Class 8 tractor
production is down
38% year-over-year.
How to use these results?
Routing guide performance and the blend of spot versus contract rates are highly dependent on an individual shipper’s network and risk tolerance. In a tightening market, a typical shipper with a 90% contract and 10% spot split can expect 7% of their originally contracted loads to be shifted to the higher-cost spot market. Shippers must proactively budget for the increased costs associated with this projected diversion of contracted shipments.
Shipper Recommendations for 2026
Scenario Planning: Develop strategies based on multiple potential scenarios for 2026, incorporating a range of internal and external market forecasts, rather than relying on a single, static projection.
Carrier Relationships: Prioritize and invest in strategic relationships with carriers now to ensure service continuity and quality, especially if the freight market tightens.
Flexible Pricing Arrangements: Where feasible, transition to flexible pricing models, such as Cost-plus or Index-based pricing, given their increasing acceptance and adoption among Uber Freight's shipper base. These models allow shippers to continue benefiting from soft market rates, while protecting their routing guides against potential tightening.
Short-term Outlook
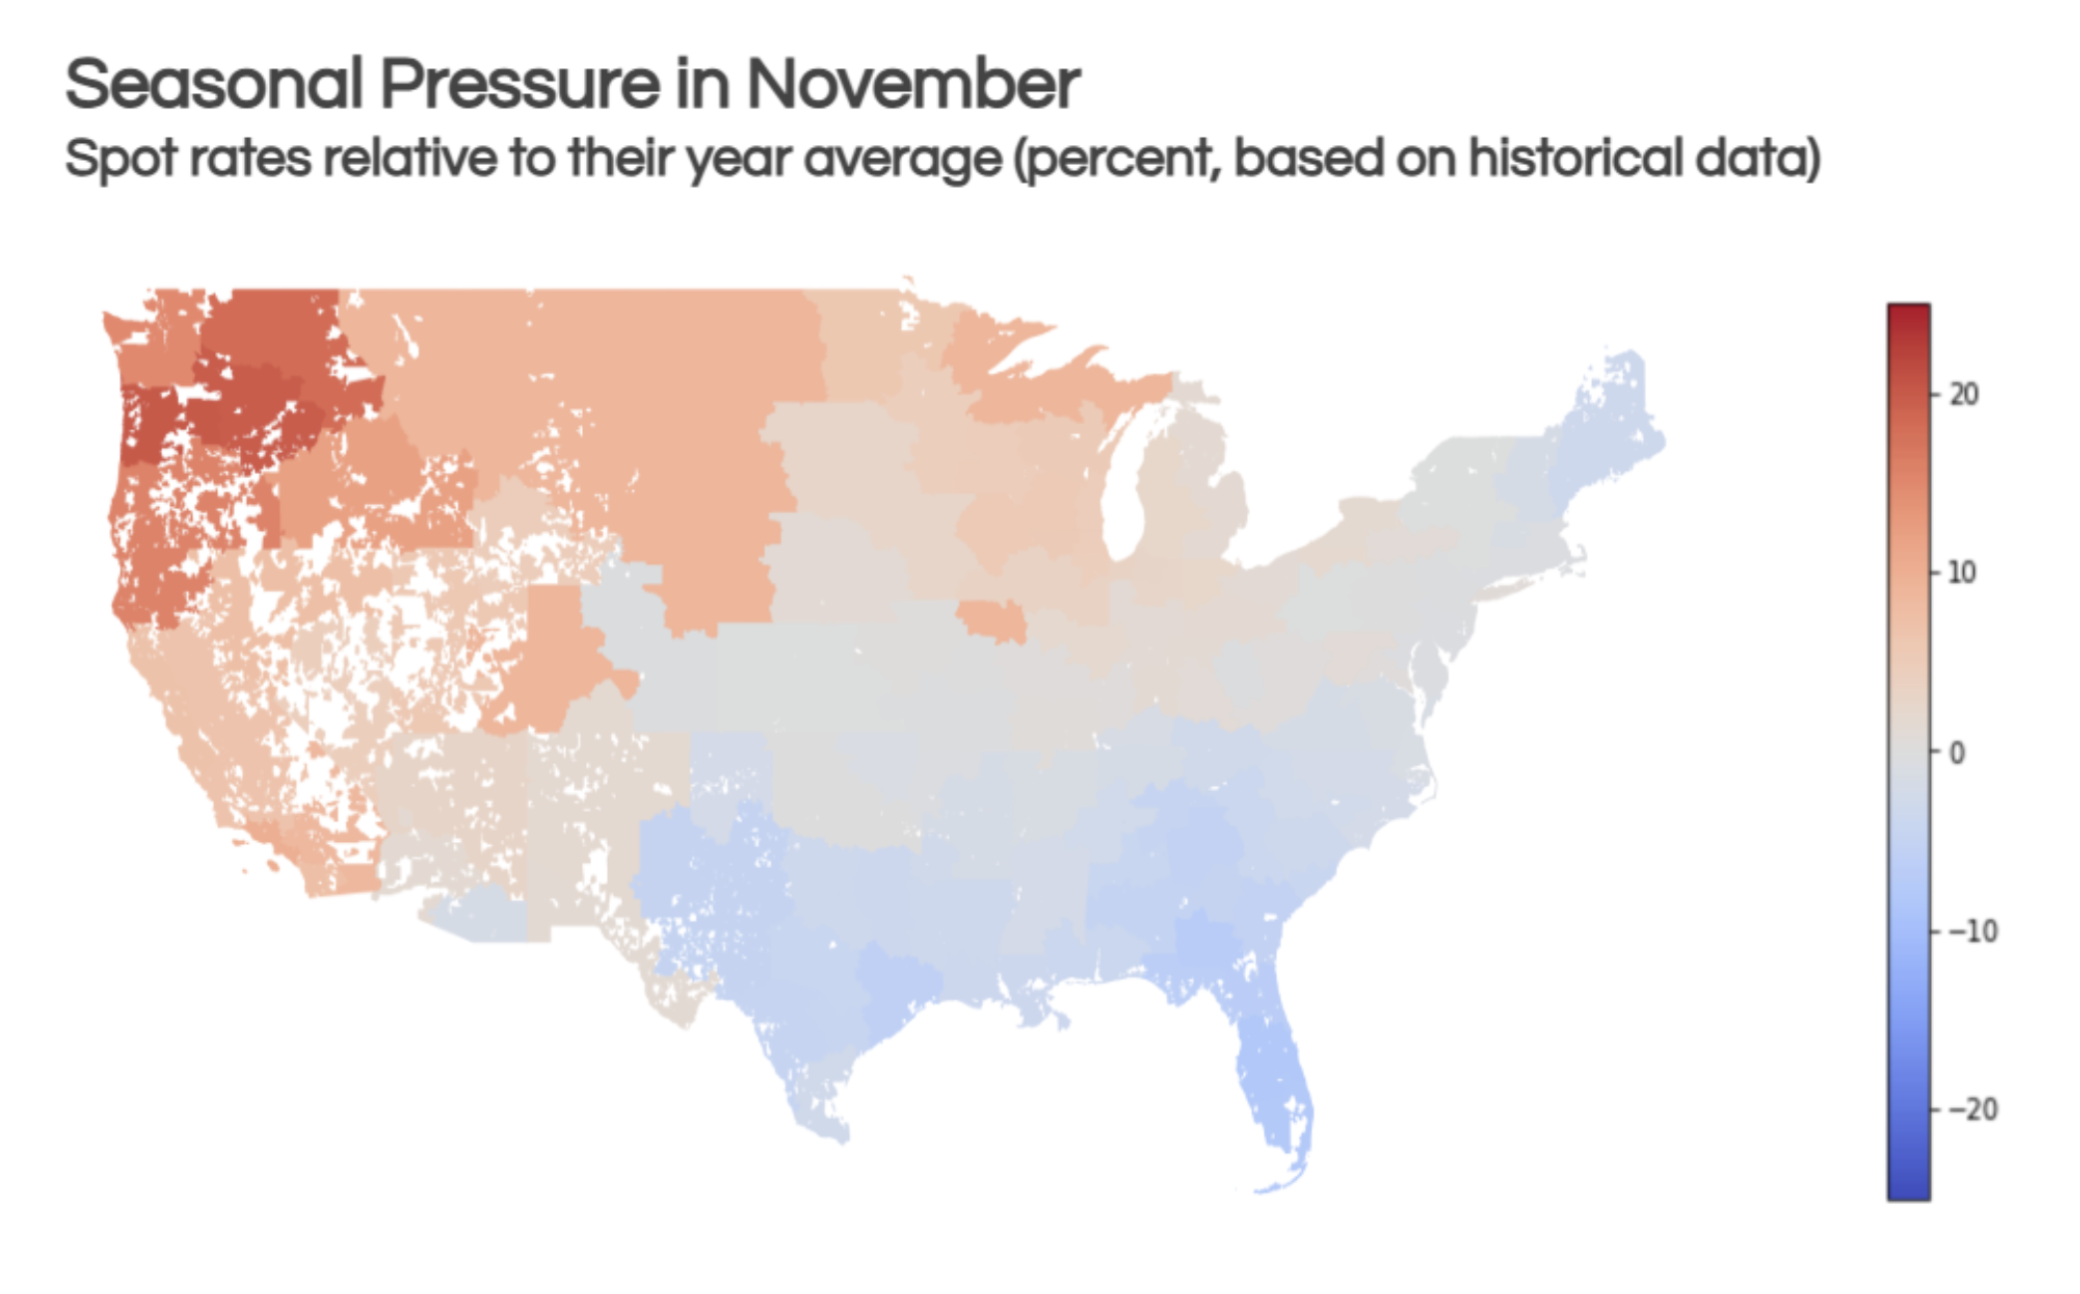
In November, Christmas tree demand tightens the market in the Pacific Northwest. West Coast imports drive additional demand, as retailers stock up ahead of peak season, and weather disruptions can lead to market turbulence in Northern markets. Meanwhile, the Southeast and South regions soften due to lacking produce volumes.
Shipper and carrier insights
Planning robust routing guides for 2026
As 2025 draws to a close, shippers need to finalize their budgets for the upcoming year. Effective budgeting goes beyond simply estimating spot and contract rates and volumes; shippers should prepare for various market scenarios to ensure their businesses remain resilient against potential market challenges.
For the past three years, shippers have benefited from a soft freight environment, particularly in the spot market. This period saw not only a decrease in costs but also sustained, historically high routing guide performance, evidenced by low tender rejection rates. This allowed shippers to benefit strategically from favorable spot rates while maintaining predictability in their networks.
However, this soft market may not persist throughout 2026. Shippers should anticipate potential routing guide degradation, especially with carriers with whom they lack robust relationships. Shippers must anticipate potential market tightening due to two primary risks:
1. Capacity crunch: The market could lose 5% to 9% of its capacity if the FMCSA rule targeting non-domiciled CDLs is enacted.
2. Demand shock: A sudden increase in demand, such as that caused by the tariff dividends proposed by President Trump (as previously discussed), is also a significant risk.
Scenario planning
It is crucial to understand the relationship between spot and contract rates and routing guide performance. When spot rates increase, tender rejections typically react immediately and rise concurrently. In contrast, contract rates increase more slowly, as they must be repriced or allowed to expire. The difference between spot and contract rates is the primary driver of tender rejections, as carriers seek more profitable opportunities in the spot market.
Uber Freight has analyzed three specific scenarios for potential market tightness in 2026:
• Flat scenario: Spot rates remain unchanged year-over-year.
• Moderate scenario: Spot rates rise by 7.5%, consistent with various internal and external forecasts.
• Tight scenario: Spot rates surge by 20%, representing the highest end of both our internal and tracked external forecasts.
Utilizing our extensive dataset—which includes $20 billion in Freight Under Management, data from hundreds of carriers and shippers, and millions of truckload shipments—we developed forecasts for contract rates and routing guide compliance under each scenario:
How to use these results?
Routing guide performance and the blend of spot versus contract rates are highly dependent on an individual shipper’s network and risk tolerance. In a tightening market, a typical shipper with a 90% contract and 10% spot split can expect 7% of their originally contracted loads to be shifted to the higher-cost spot market. Shippers must proactively budget for the increased costs associated with this projected diversion of contracted shipments.
Shipper recommendations for 2026
Scenario Planning: Develop strategies based on multiple potential scenarios for 2026, incorporating a range of internal and external market forecasts, rather than relying on a single, static projection.
Carrier Relationships: Prioritize and invest in strategic relationships with carriers now to ensure service continuity and quality, especially if the freight market tightens.
Flexible Pricing Arrangements: Where feasible, transition to flexible pricing models, such as Cost-plus or Index-based pricing, given their increasing acceptance and adoption among Uber Freight's shipper base. These models allow shippers to continue benefiting from soft market rates, while protecting their routing guides against potential tightening.
Short-term outlook
In November, Christmas tree demand tightens the market in the Pacific Northwest. West Coast imports drive additional demand, as retailers stock up ahead of peak season, and weather disruptions can lead to market turbulence in Northern markets. Meanwhile, the Southeast and South regions soften due to lacking produce volumes.
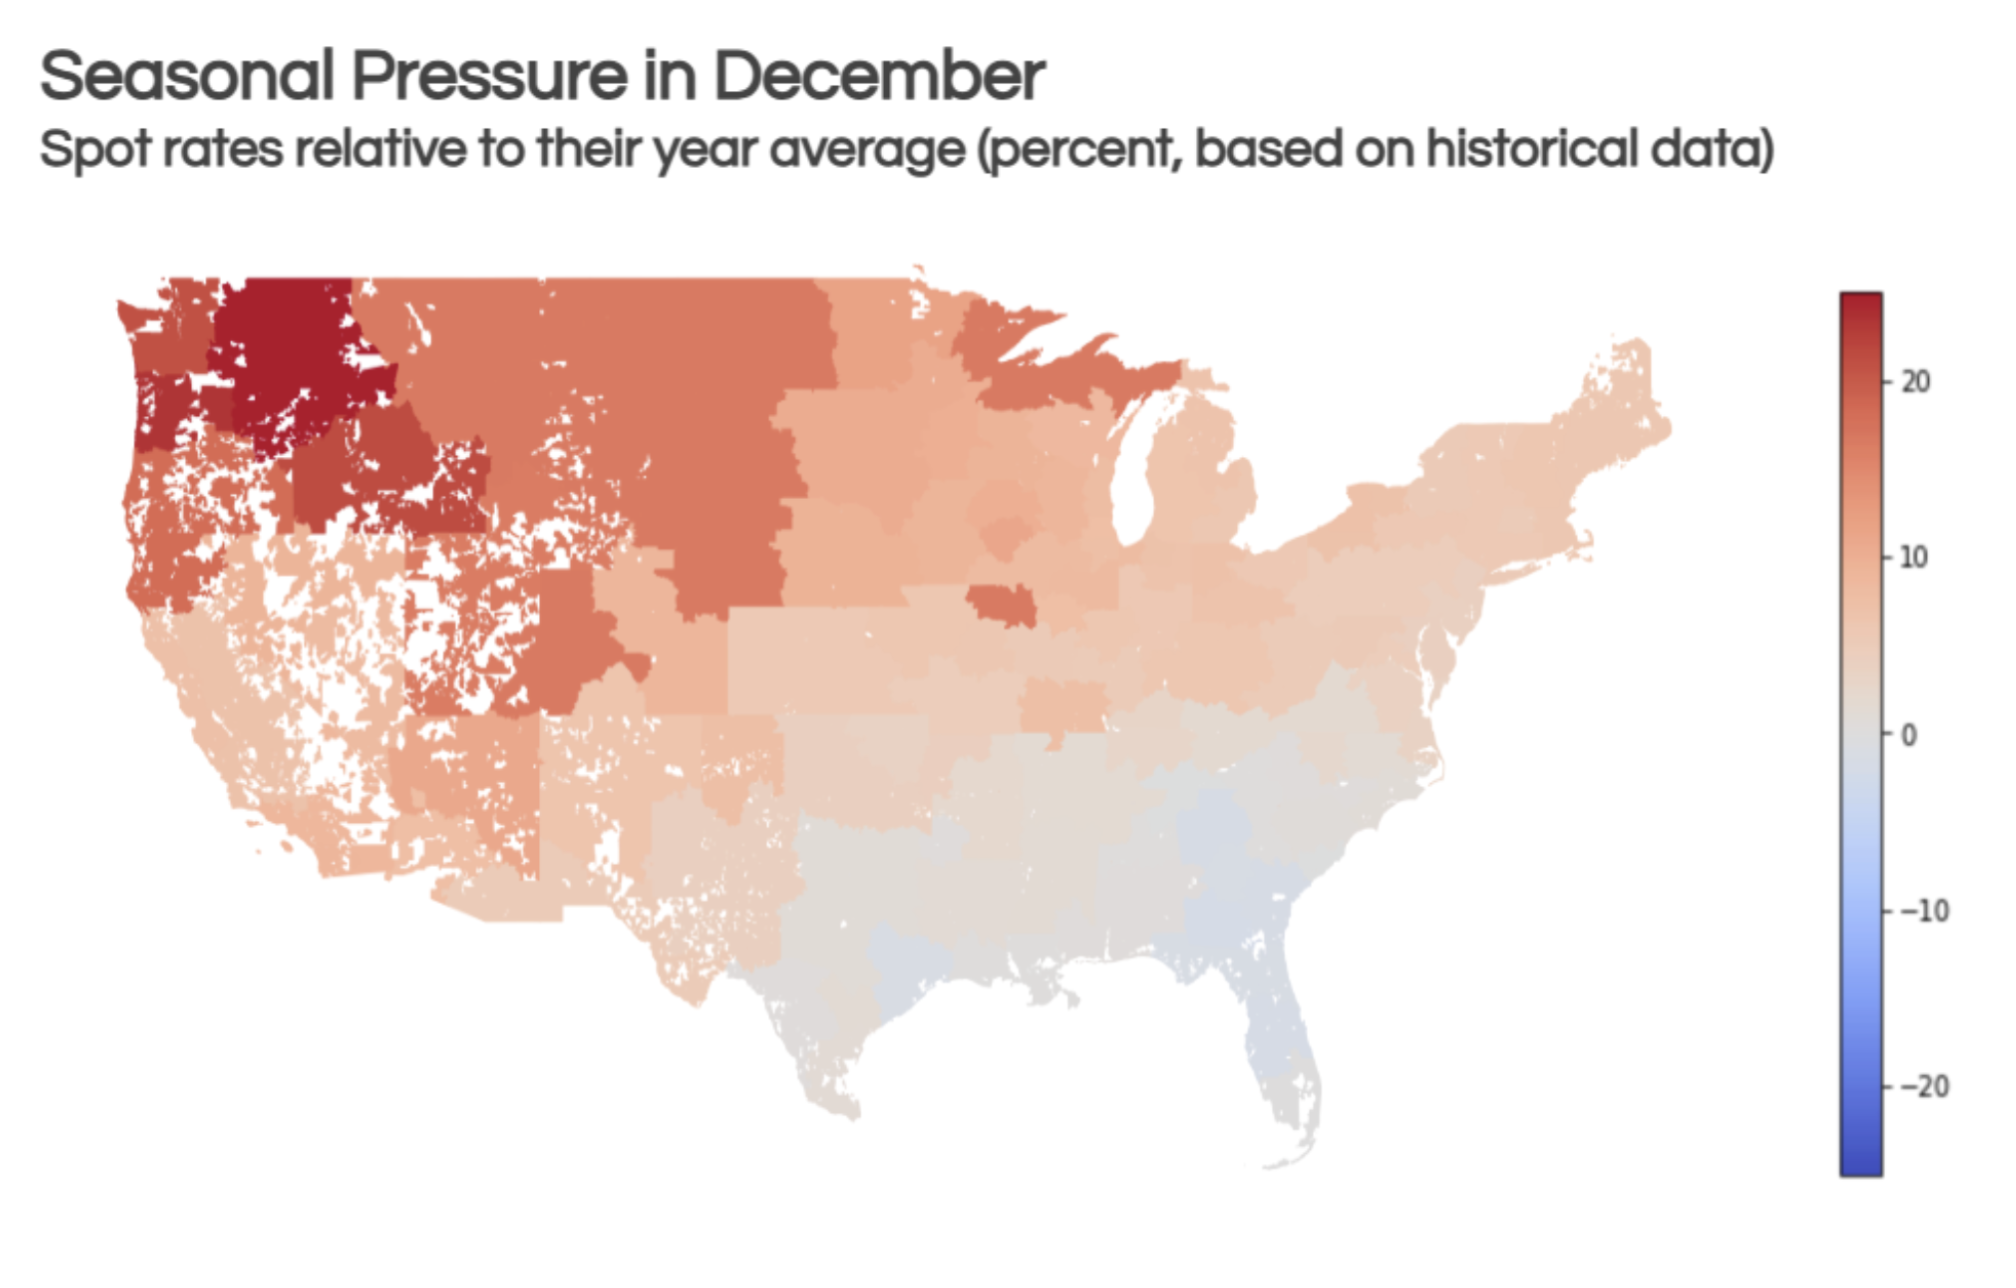
By December, the market tightens significantly across most regions, with the exception of the Southeast. Typically, spot rates in December are 5% higher than their yearly average. The Pacific Northwest is expected to experience the most severe tightness, with some markets seeing spot rate increases exceeding 20%.
A one-year trade truce between the U.S. and China signals de-escalation.
1/2
It’s important to note that in 2021, pandemic-related lockdowns led consumers to spend most of their stimulus money on goods, as services spending was suppressed. Future stimulus impact could differ significantly, as services now account for a larger share of overall consumer spending.
Finally, it is estimated that the current accumulated tariff revenues, approximately $120 billion to date, are insufficient to meet the $300 billion required to issue a $2,000 dividend to 150 million individuals. Consequently, the distribution of these tariff dividends, if it happens at all, is likely to be delayed until the first or second quarter of 2026 at least.
Tariff Dividends
2/2
The annual inflation rate hit 3% in September (a 0.3% monthly increase), the highest level since May 2024. Core inflation, which excludes the often-volatile food and energy sectors, also reached 3%, still above the Federal Reserve's 2% target.
However, the drivers of inflation have shifted significantly following tariffs. In 2024, core goods (excluding food and energy) saw an average annual deflation of -1.1%, while core services experienced high inflation at 5%. This trend has reversed in 2025. The price of goods has gradually risen, reaching 1.5% year-over-year in September—the highest since June 2023. Conversely, the services inflation has gradually softened, falling to 3.5%, the lowest since November 2021.
This shift is supported by Bank of America Institute Consumer Checkpoint data, which shows that while total retail spending has increased over the past year, the number of retail transactions has decreased, indicating a higher average cost per purchase.
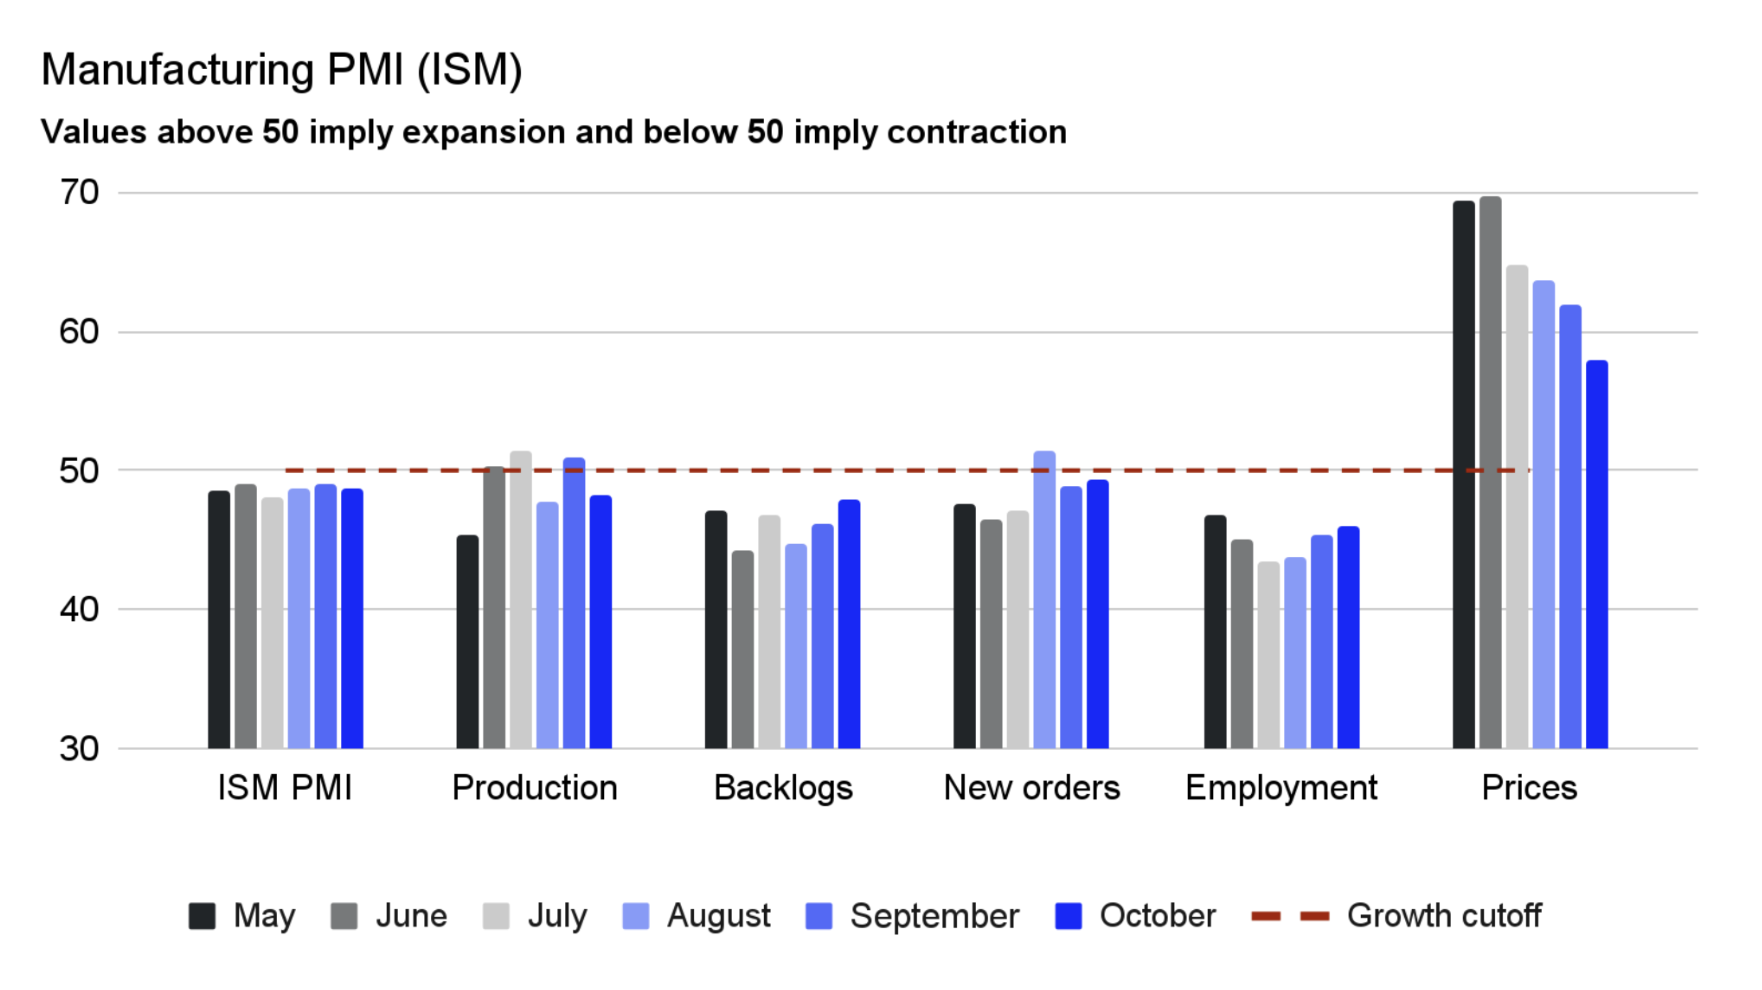
The Institute for Supply Management Purchasing Managers Index (ISM PMI) fell slightly to 48.7 in October, remaining below the 50.0 expansion threshold and indicating a continued, albeit moderate, contraction in the manufacturing sector. Forward-looking indicators such as New Orders and Backlogs also stayed under 50.0. However, their sequential rise hints that manufacturing activity may be approaching a bottom in the near future. The Prices Index decreased to 58, signaling a deceleration of inflation in the cost of commodities and raw materials.
Despite a lack of full visibility into key economic indicators due to the government shutdown—particularly those measuring consumer spending—external data suggests little cause for alarm. The Bank of America Institute Consumer Checkpoint, for example, reports solid consumer spending, with seasonally adjusted credit card spending per household growing 0.3% month-over-month (MoM), marking a fifth consecutive monthly increase. Year-over-year spending on "holiday items" also remained healthy through the end of October, with average daily spending up nearly 5.7% YoY.
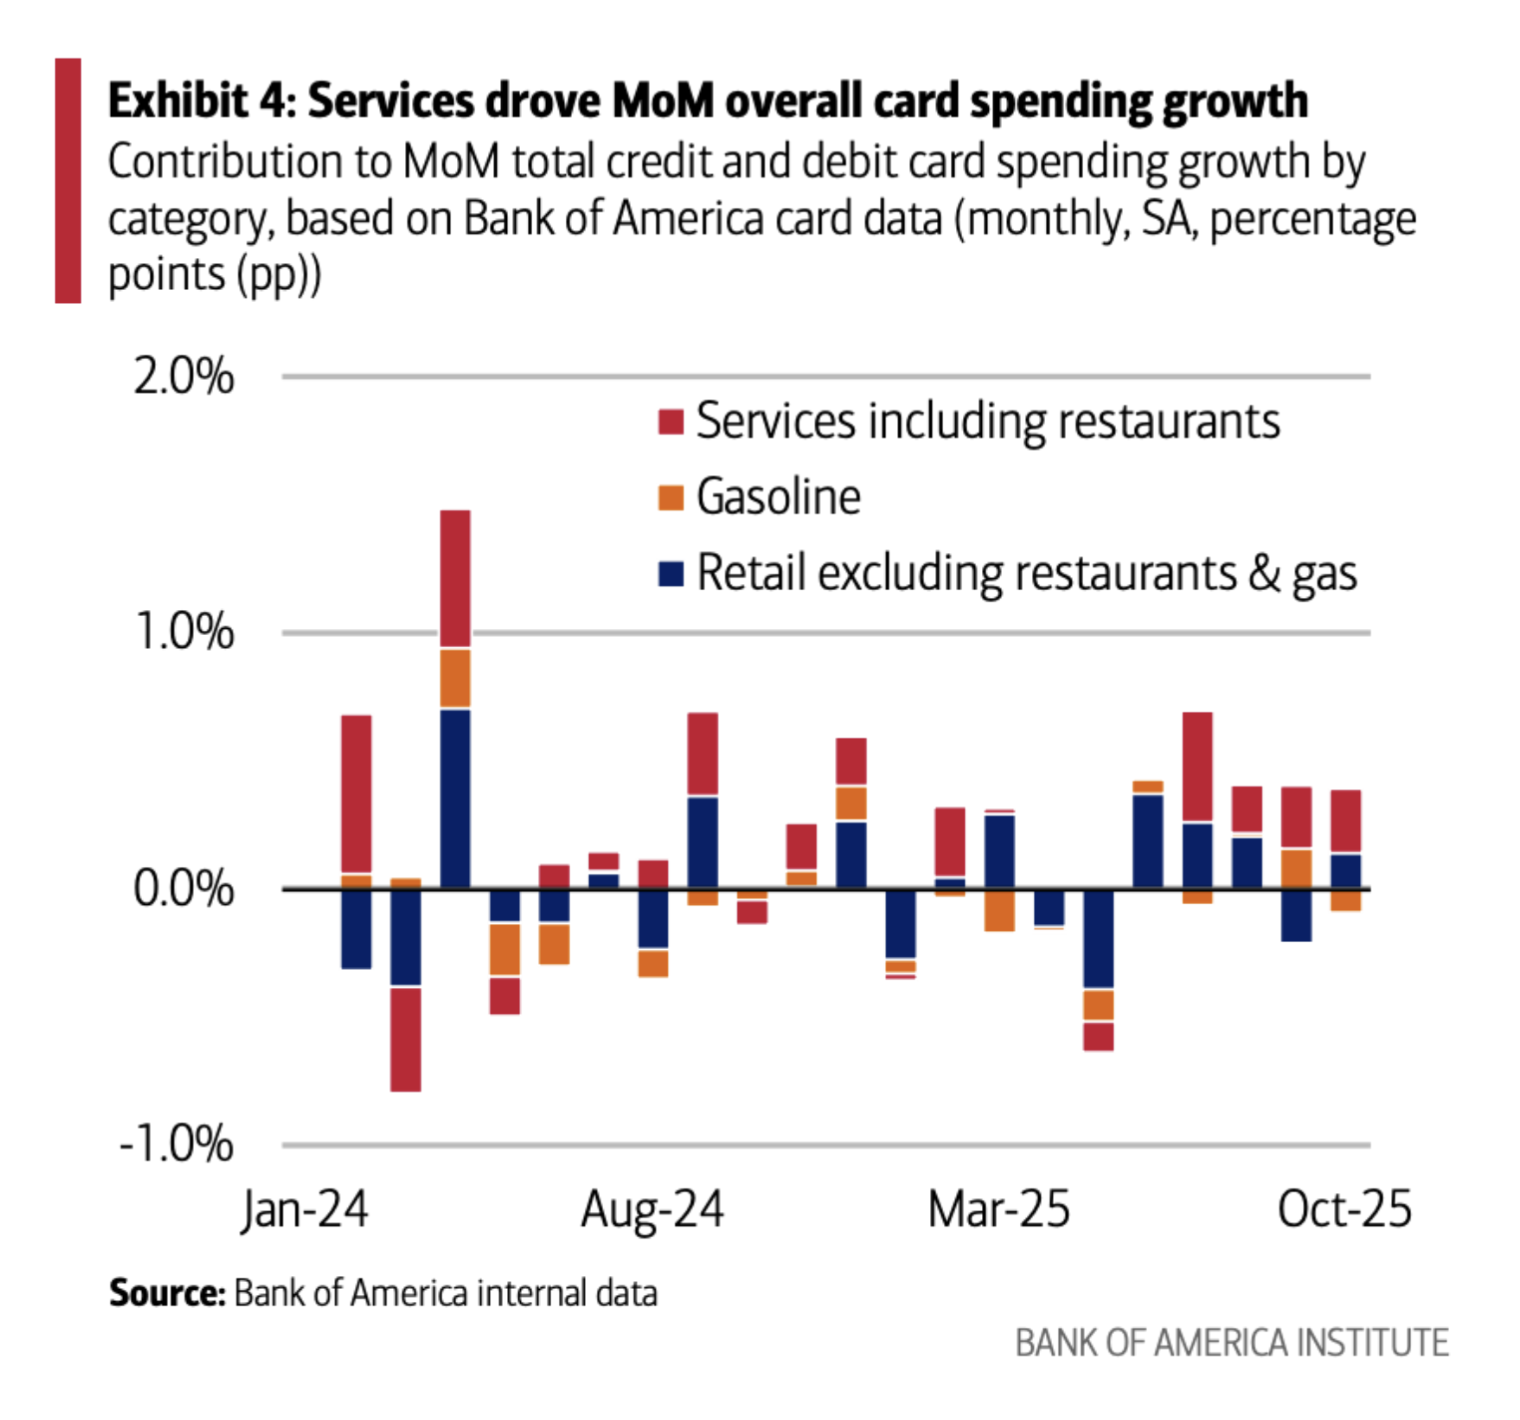
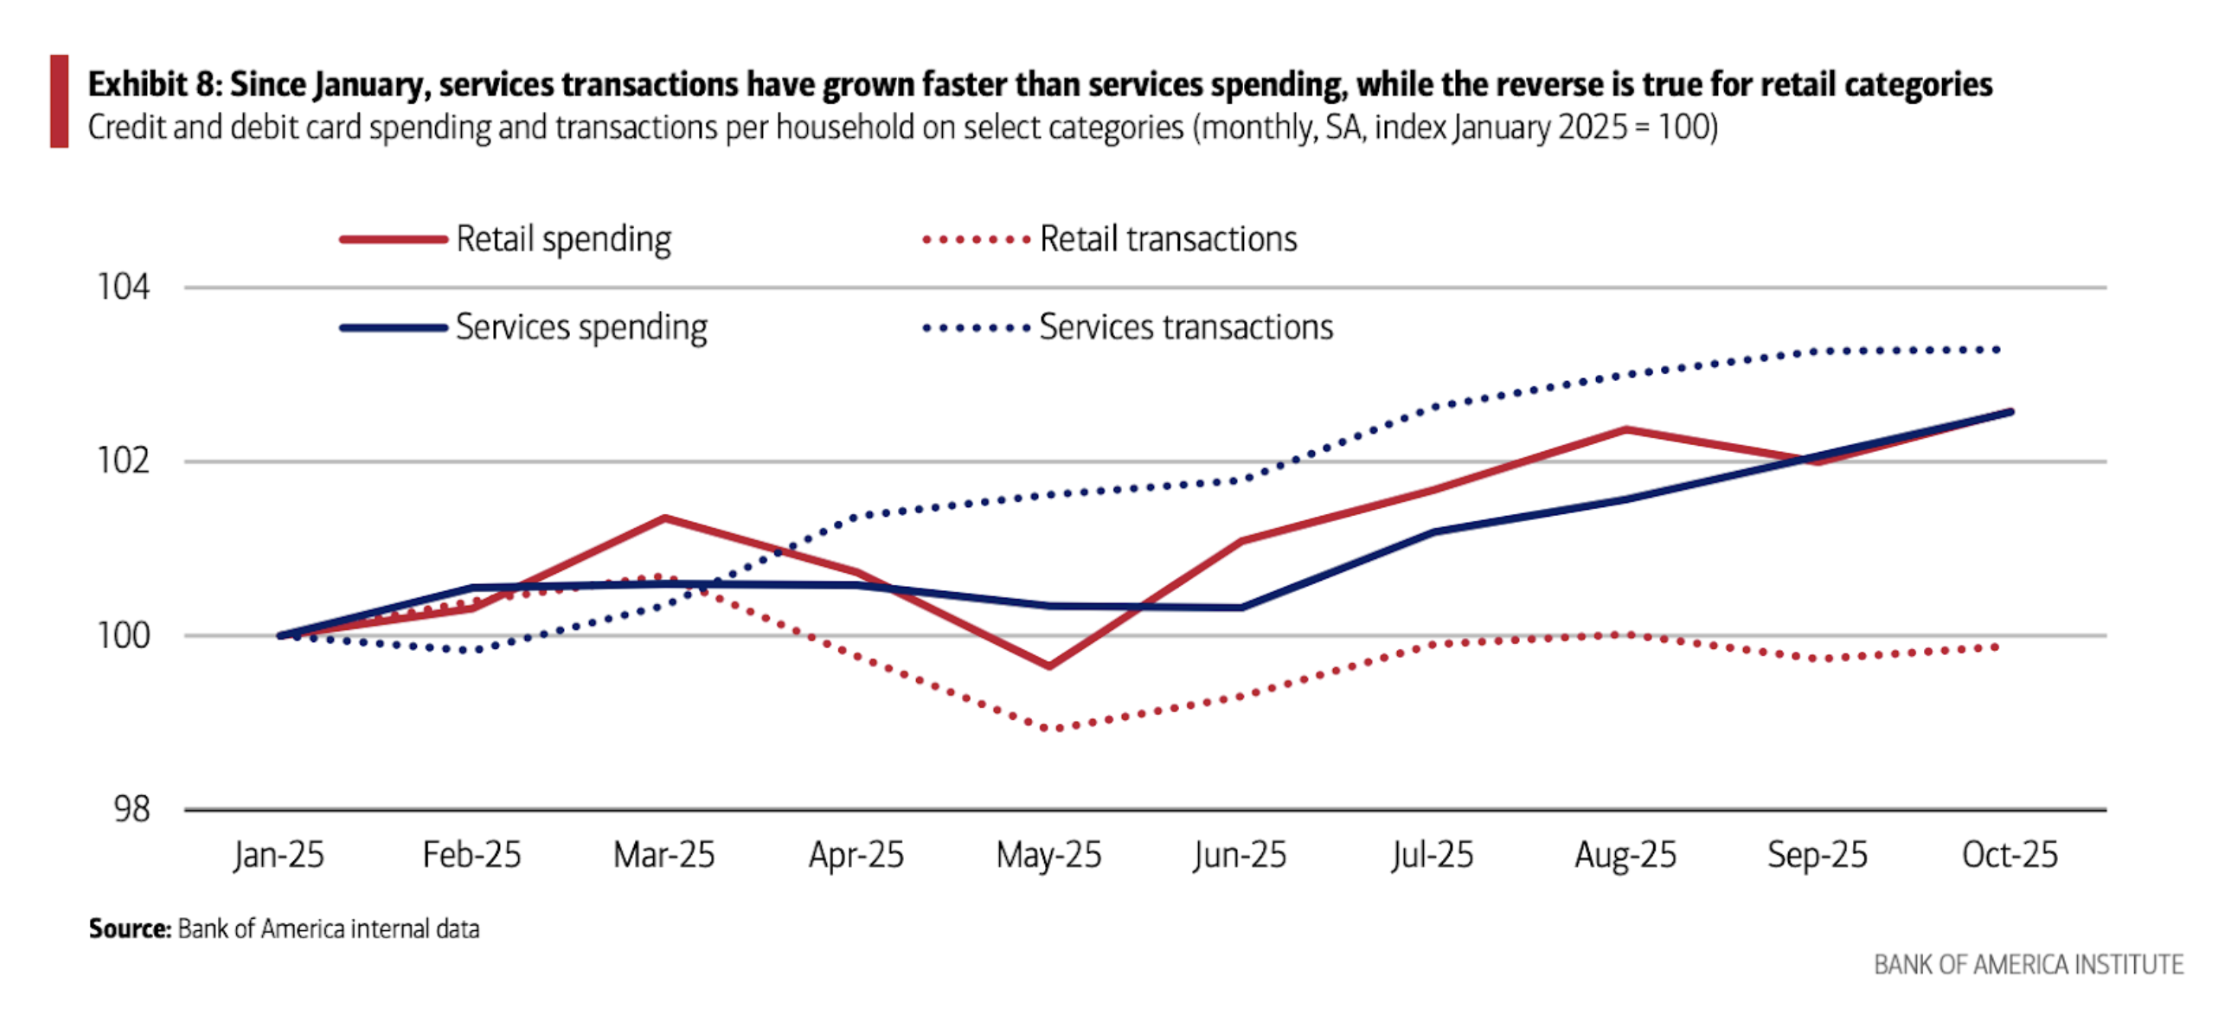
However, a strong consumer might not translate to stronger freight volumes. An analysis of spending categories reveals that services spending (including restaurants) drove more than half of the overall spending growth for the second straight month. Meanwhile, retail spending (excluding gas and restaurants) accounted for roughly a quarter of the growth. Furthermore, the increase in retail spending may be more reflective of tariff-related price increases than an increase in the number of purchases; while overall retail spending (excluding food and gas) was up 2.0% in October 2025 compared to January, the actual number of transactions has declined over that period.
Consumer spending remained robust in October, but tariffs are impacting retail volumes.
U.S. container imports totaled 2.31M TEUs in October, a slight 0.1% drop from September, according to Descartes. However, imports were 7.5% lower year-over-year and, when adjusted for seasonality, 1.3% lower than in September. Imports from China rose 5.4% month-over-month, recovering modestly from August/September declines, but remained 16.3% below last year’s levels.
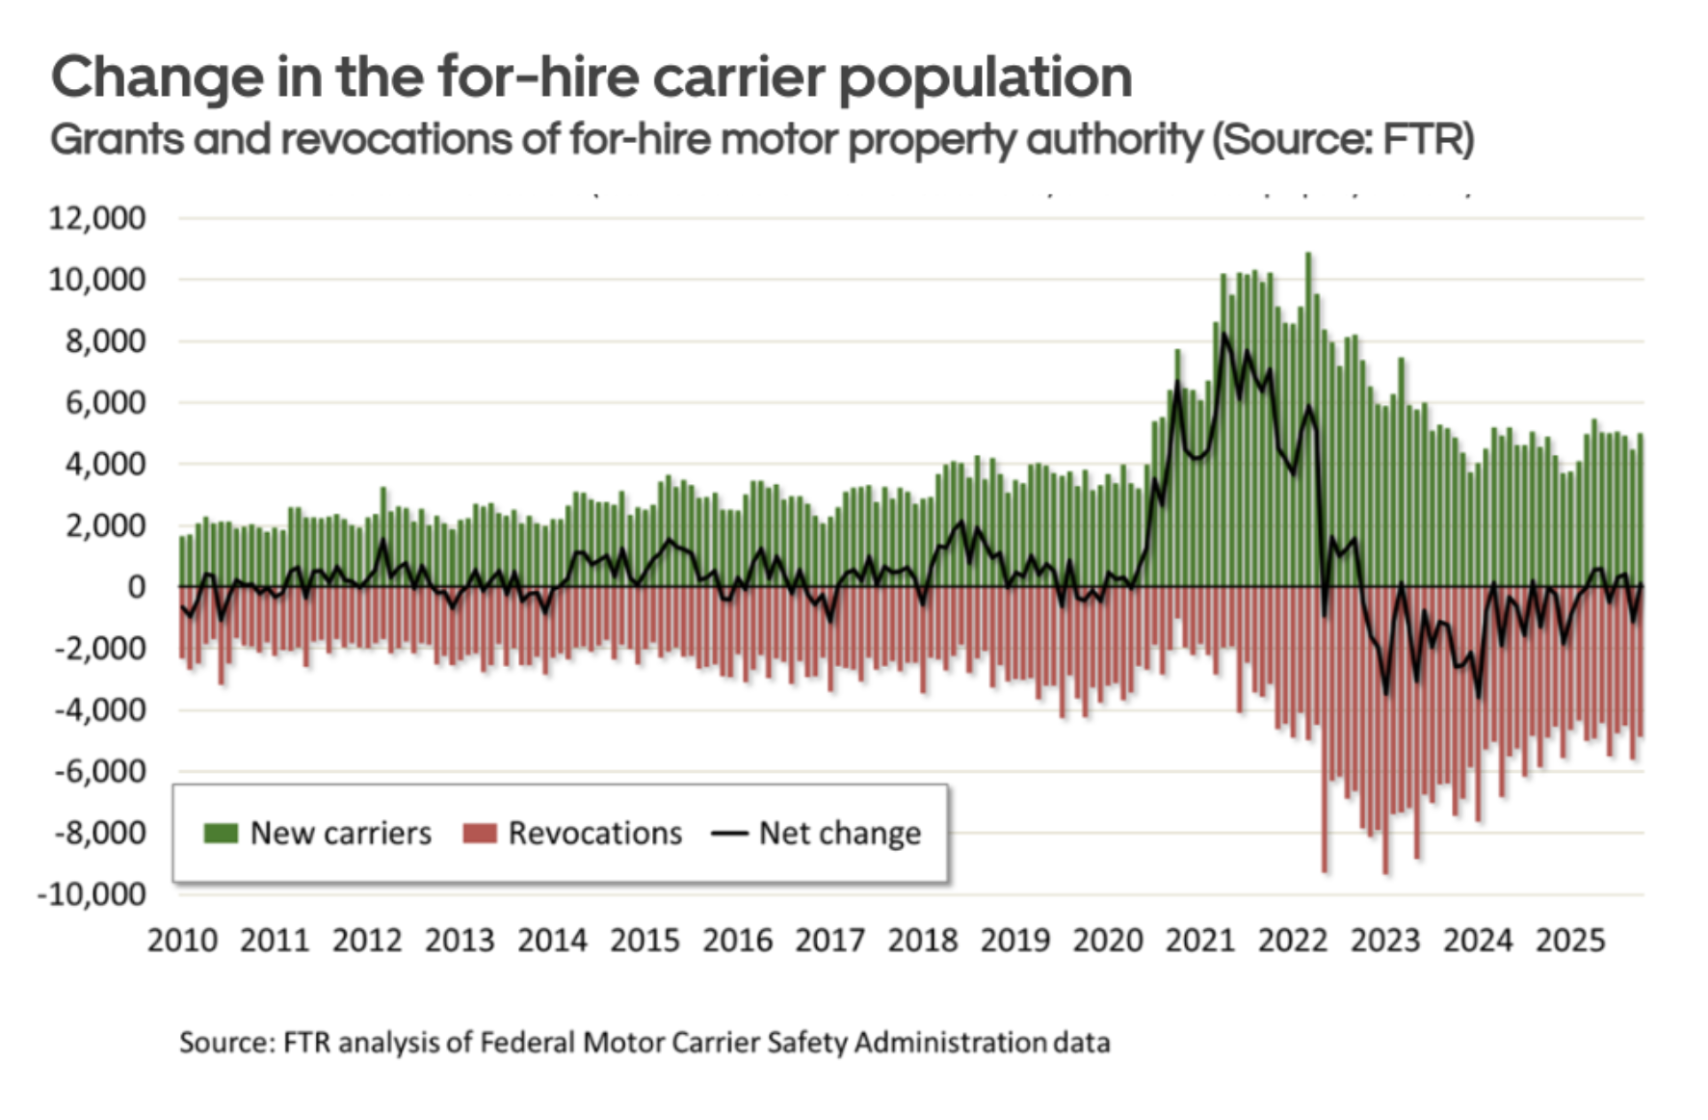
The Transportation Secretary has ordered a halt to the issuance and renewal of non-domiciled Commercial Driver's Licenses (CDLs). However, the rule has been put on hold by the U.S. Court of Appeals for the District of Columbia until the court issues a subsequent order. Despite this rule, the overall carrier population did not yet show any negative impact in October, instead recording a slight net increase of 132 carriers.
The Federal Motor Carrier Safety Administration (FMCSA) projects this mandate will remove an estimated 194,000 drivers from the market over the next two years. The precise segment of the market that will be most affected remains unclear. For context, the U.S. labor market included 2,235,100 tractor-trailer drivers and 1,531,300 delivery truck drivers as of 2024 (BLS data). If all 194,000 impacted drivers are from the tractor-trailer segment, it would constitute approximately 9% of Over-the-Road (OTR) capacity, which could lead to a significant capacity crunch. The situation would be more severe if these drivers are disproportionately drawn from the long-distance truckload for-hire sector, which has fewer than 500,000 drivers according to BLS data.
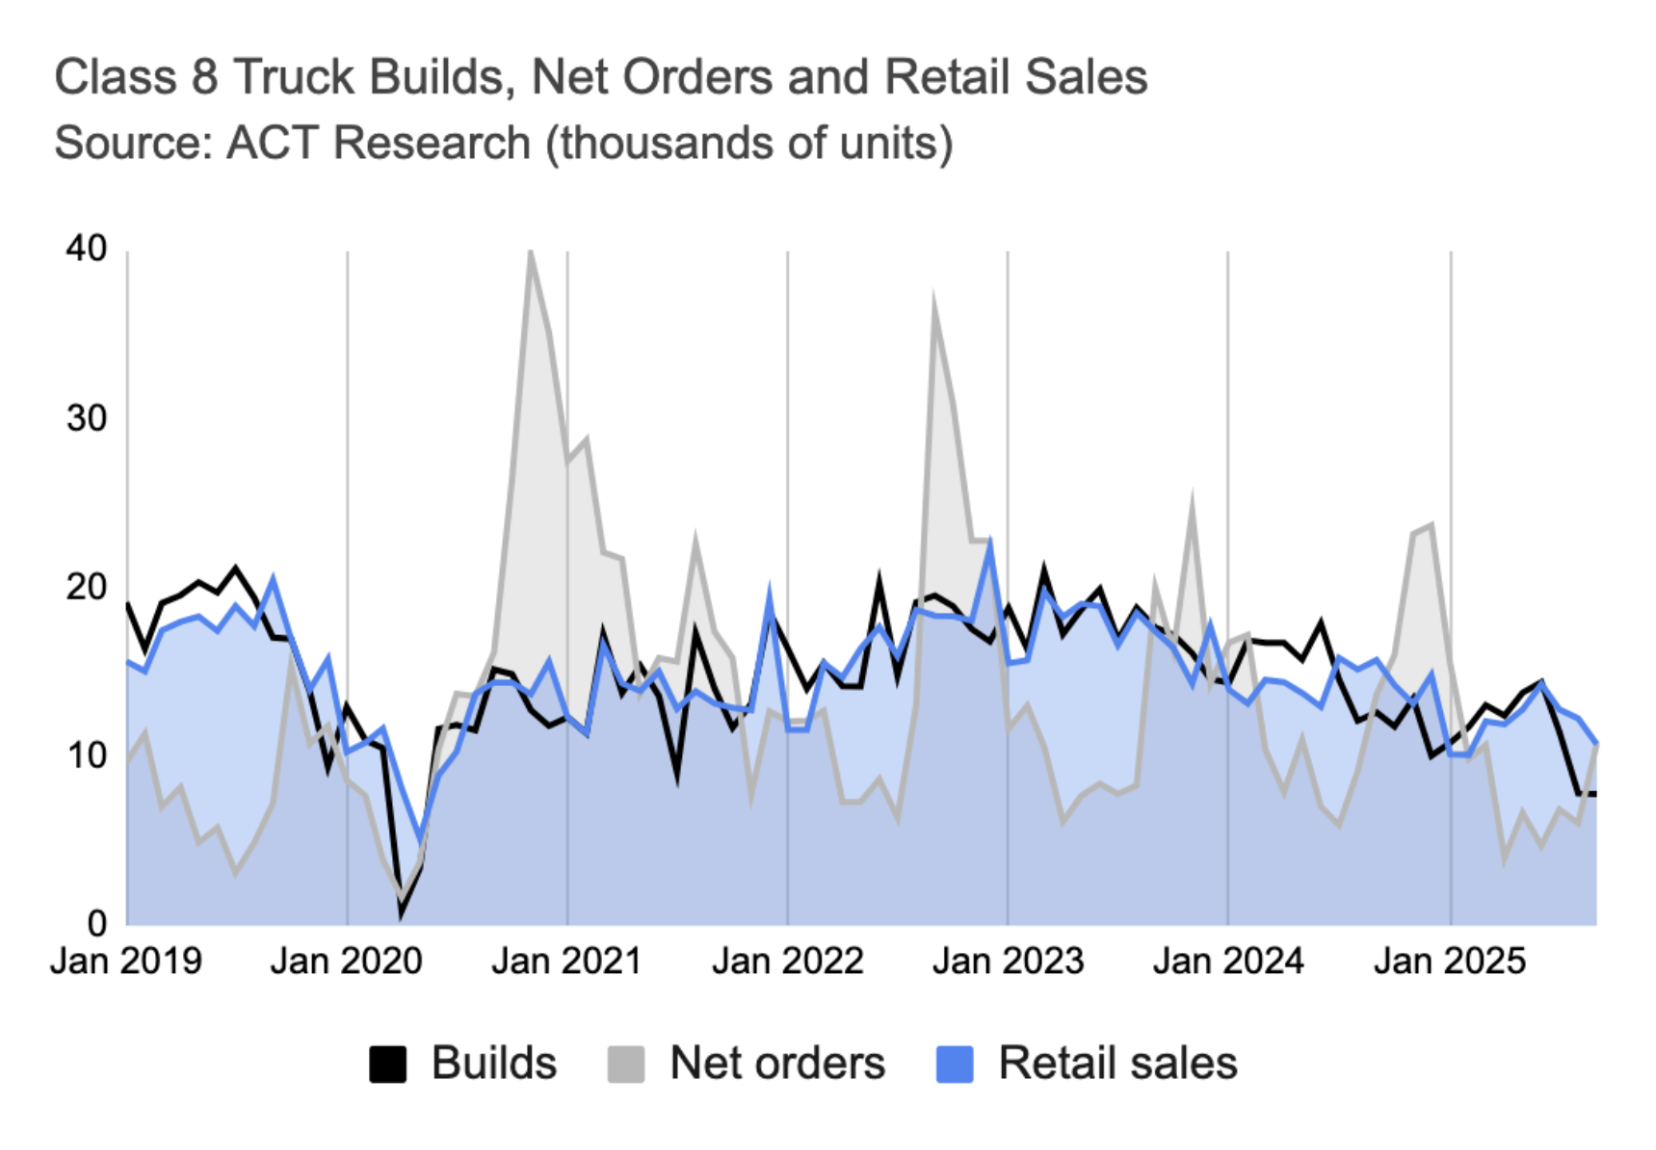
Amid a prolonged freight recession and tariff uncertainty, carriers remain cautious, keeping tractor orders low. This market slump, which sees current tractor orders near a five-year low, has been compounded by President Trump's imposed 25% tariff on medium- and heavy-duty trucks, which primarily impacts imports from Mexico. In the current peak ordering season, year-over-year declines stand at 21% for Class 8 tractor orders, 32% for sales, and 38% for production, according to ACT Research.
Given that LTL volumes have fallen more sharply than truckload volumes over the past two years, the resulting drop in tractor orders and sales is more pronounced for daycab trucks. Year-over-year figures for daycabs show significant declines: orders are down 23%, sales are down 41%, and production is down 54%.
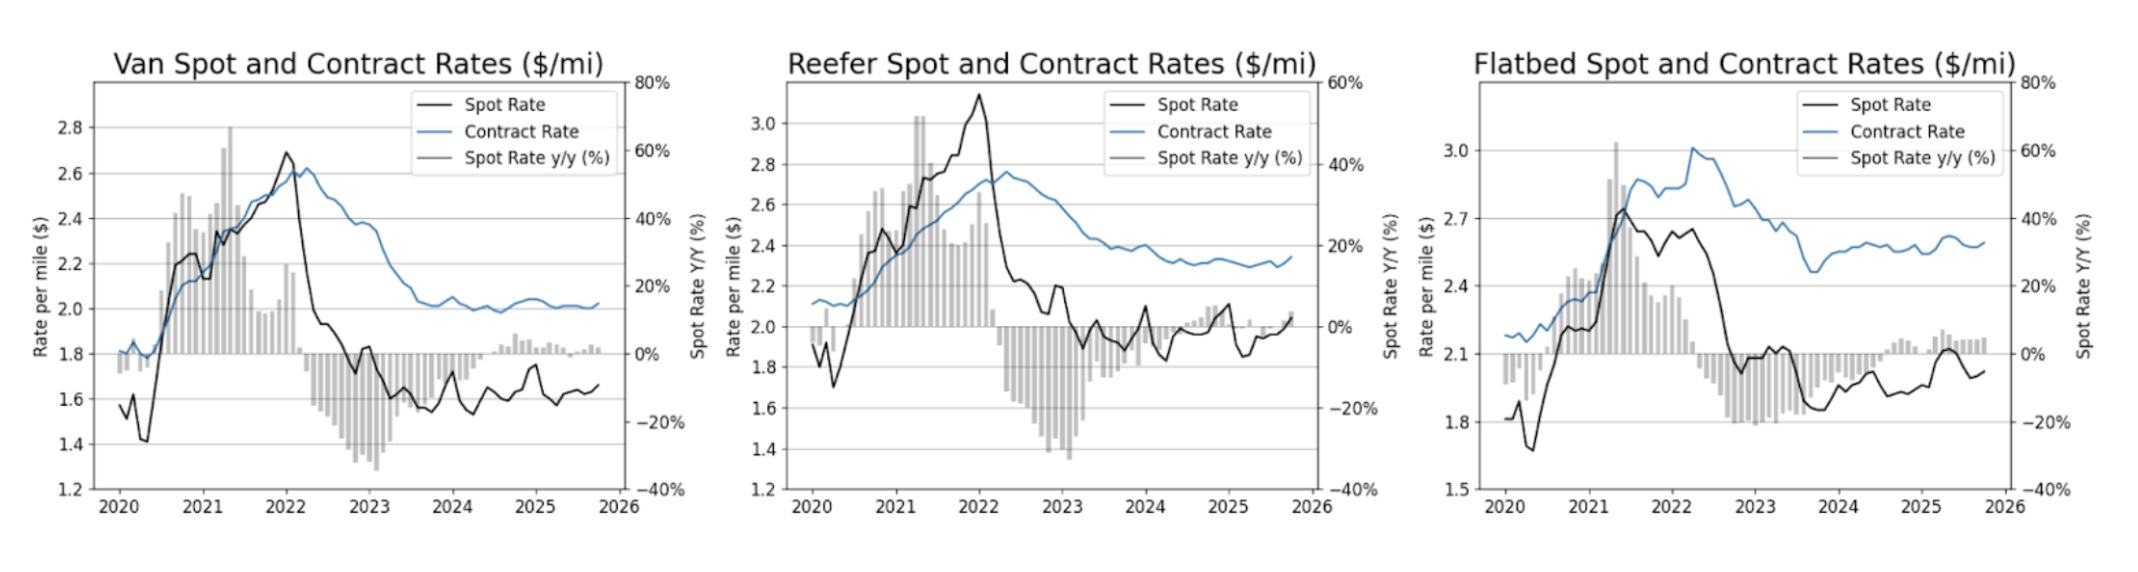
The spot market saw greater-than-expected tightening in October. Month-over-month, spot rates increased across all trailer types: dry van rose 1.8%, reefer jumped 2.5%, and flatbed climbed 1.0%. Contract rates also trended upward, with van up 1.0%, reefer increasing 1.3%, and flatbed rising 0.8%.
Compared to a year ago, year-over-year spot rate gains were strongest in flatbed (4.7%) and reefer, slightly outperforming dry van (1.8%). While van contract rates remained flat year-over-year, reefer (1.3%) and flatbed (1.6%) contract rates both posted increases.
It’s important to note that in 2021, pandemic-related lockdowns led consumers to spend most of their stimulus money on goods, as services spending was suppressed. Future stimulus impact could differ significantly, as services now account for a larger share of overall consumer spending.
Finally, it is estimated that the current accumulated tariff revenues, approximately $120 billion to date, are insufficient to meet the $300 billion required to issue a $2,000 dividend to 150 million individuals. Consequently, the distribution of these tariff dividends, if it happens at all, is likely to be delayed until the first or second quarter of 2026 at least.

Tariff Dividends
1/2
2/2
Despite rising inflation, the labor market continued to show signs of softening.
The government shutdown has created a data blackout, delaying official economic reports vital for our analysis and forecasting. In the absence of federal data, the ADP National Employment Report stood out, showing that private sector employment fell by 32,000 in September, signaling continued weakness in the U.S. labor market. Adding to the concerns about labor market softness, in August, Job Hires fell 2.2% m/m and were down 2.0% y/y, to their second lowest level since April 2020.
The U.S. housing market saw volatility amidst shifting mortgage rates.
The U.S. housing market continues to contract, with new permits decreasing 2.3% month-over-month in August and 9.9% year-over-year. Despite this, August saw a positive shift: a slight dip in mortgage rates led to a 20.5% month-over-month surge in new home sales, reaching their highest level since January 2022. This suggests a significant pool of potential homebuyers awaiting lower mortgage rates, indicating a substantial amount of dormant freight demand that could be unleashed next year if rates fall.
The Institute for Supply Management Purchasing Managers Index (ISM PMI) fell slightly to 48.7 in October, remaining below the 50.0 expansion threshold and indicating a continued, albeit moderate, contraction in the manufacturing sector. Forward-looking indicators such as New Orders and Backlogs also stayed under 50.0. However, their sequential rise hints that manufacturing activity may be approaching a bottom in the near future. The Prices Index decreased to 58, signaling a deceleration of inflation in the cost of commodities and raw materials.
Despite a lack of full visibility into key economic indicators due to the government shutdown—particularly those measuring consumer spending—external data suggests little cause for alarm. The Bank of America Institute Consumer Checkpoint, for example, reports solid consumer spending, with seasonally adjusted credit card spending per household growing 0.3% month-over-month (MoM), marking a fifth consecutive monthly increase. Year-over-year spending on "holiday items" also remained healthy through the end of October, with average daily spending up nearly 5.7% YoY.
However, a strong consumer might not translate to stronger freight volumes. An analysis of spending categories reveals that services spending (including restaurants) drove more than half of the overall spending growth for the second straight month. Meanwhile, retail spending (excluding gas and restaurants) accounted for roughly a quarter of the growth. Furthermore, the increase in retail spending may be more reflective of tariff-related price increases than an increase in the number of purchases; while overall retail spending (excluding food and gas) was up 2.0% in October 2025 compared to January, the actual number of transactions has declined over that period.
U.S. container imports totaled 2.31M TEUs in October, a slight 0.1% drop from September, according to Descartes. However, imports were 7.5% lower year-over-year and, when adjusted for seasonality, 1.3% lower than in September. Imports from China rose 5.4% month-over-month, recovering modestly from August/September declines, but remained 16.3% below last year’s levels.
An emergency order targeting non-domiciled CDLs could drive a capacity crunch in 2026.
U.S. Transportation Secretary Sean P. Duffy issued an emergency order immediately halting states from issuing or renewing non-domiciled Commercial Driver’s Licenses (CDLs). This rule closes loopholes created by states that had been granting CDLs to foreign nationals who lacked required employment-based visas or whose licenses were improperly extended long past the expiration of their lawful presence. The Federal Motor Carrier Safety Administration (FMCSA) estimates that its interim final rule on non-domiciled CDLs will remove 194,000 drivers from the market over the next two years.
Additionally, the carrier population continues to shrink due to ongoing capacity reduction. FMCSA data indicates a net decrease of 385 carriers in Q3, following a modest increase of only 671 in Q2.
A 25% tariff on new tractors could also contribute to the potential capacity tightening next year.
President Donald Trump announced plans to impose a 25% tariff on medium- and heavy-duty trucks starting next month. This action directly targets Mexico, which is a major manufacturing hub under the USMCA trade agreement. Mexico exported 159,466 heavy-duty trucks in 2024, with 95.5% going to the U.S. These trucks are currently permitted to cross the border tariff-free under the USMCA, provided they meet strict rules of origin requiring 64% of their value to originate regionally (a threshold set to increase to 70%). This announcement comes at a time when tractor orders are near their lowest levels in 5 years. Preliminary Class 8 orders totaled 20,800 units in September, down 44% y/y.
The spot market saw greater-than-expected tightening in October. Month-over-month, spot rates increased across all trailer types: dry van rose 1.8%, reefer jumped 2.5%, and flatbed climbed 1.0%. Contract rates also trended upward, with van up 1.0%, reefer increasing 1.3%, and flatbed rising 0.8%.
Compared to a year ago, year-over-year spot rate gains were strongest in flatbed (4.7%) and reefer, slightly outperforming dry van (1.8%). While van contract rates remained flat year-over-year, reefer (1.3%) and flatbed (1.6%) contract rates both posted increases.
By December, the market tightens significantly across most regions, with the exception of the Southeast. Typically, spot rates in December are 5% higher than their yearly average. The Pacific Northwest is expected to experience the most severe tightness, with some markets seeing spot rate increases exceeding 20%.