The Freight Economist
October 2025
Executive summary
Monthly economic and market update
Class 8 tractor orders
in September saw a
44% year-over-year decrease.
U.S. economy
Housing Market
Inflation
Tariffs


Freight demand
Imports
Truck
tonnage
Manufacturing
Spending
on goods


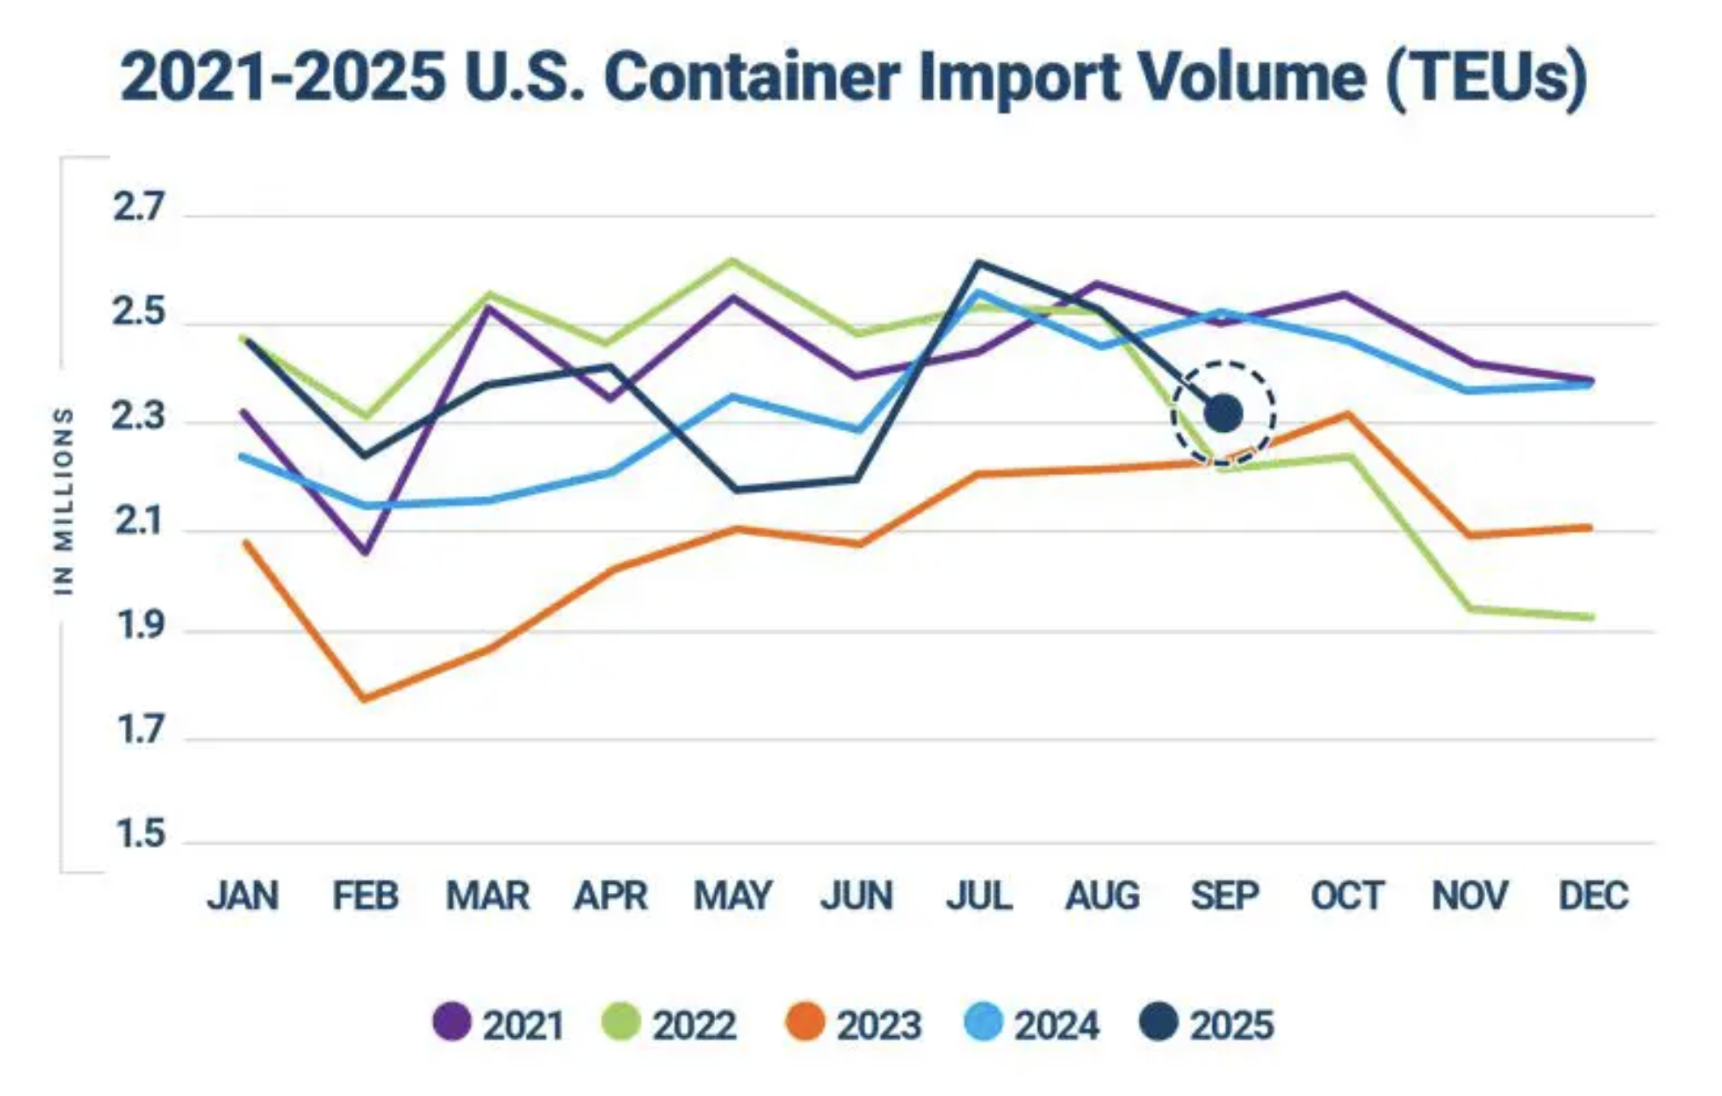
U.S. container imports fell in September as pre-stocking slowed, but further volatility is anticipated.
IIn September, U.S. container imports experienced a notable decline, totaling 2,307,933 Twenty-foot Equivalent Units (TEUs), according to Descartes. This figure represents an 8.4% decrease from both August 2025 and September 2024. Despite being the third-highest September on record, the strength observed in the first half of the year was likely due to pre-stocking ahead of tariffs.
Imports from China saw a significant drop to 762,772 TEUs, down 12.3% month-over-month and 22.9% year-over-year. Increased import volatility is anticipated in the coming months, following President Donald Trump's announcement of a new 100% tariff on imports from China, effective November 1, which will be "over and above any Tariff that they are currently paying."
a, effective November 1, which will be "over and above any Tariff that they are currently paying."
Imports
What does it mean for truck tonnage?
Spending on goods
Key data points and commentary
Trucking
volume

Intermodal
rates

Geographic
trends

Routing guide trends

Routing guide trends
Geographic trends

Trucking volume
In August, the American Trucking Associations (ATA) Truck Tonnage Index increased by 0.9% and was up 0.4% from August of last year, following a 0.5% rise in July. Year-to-date, tonnage has seen a modest 0.1% increase compared to the same period in 2024.
Similarly, the Cass Freight Shipments Index rose 1.5% month-over-month in September, narrowing its year-over-year decline to 5.4%. Weak Less-Than-Truckload (LTL) volumes primarily drove the year-over-year decline, although truckload volumes rose following pre-stocking. The recent volume increase might be temporary as the full tariff impacts are still expected to unfold in the months ahead.
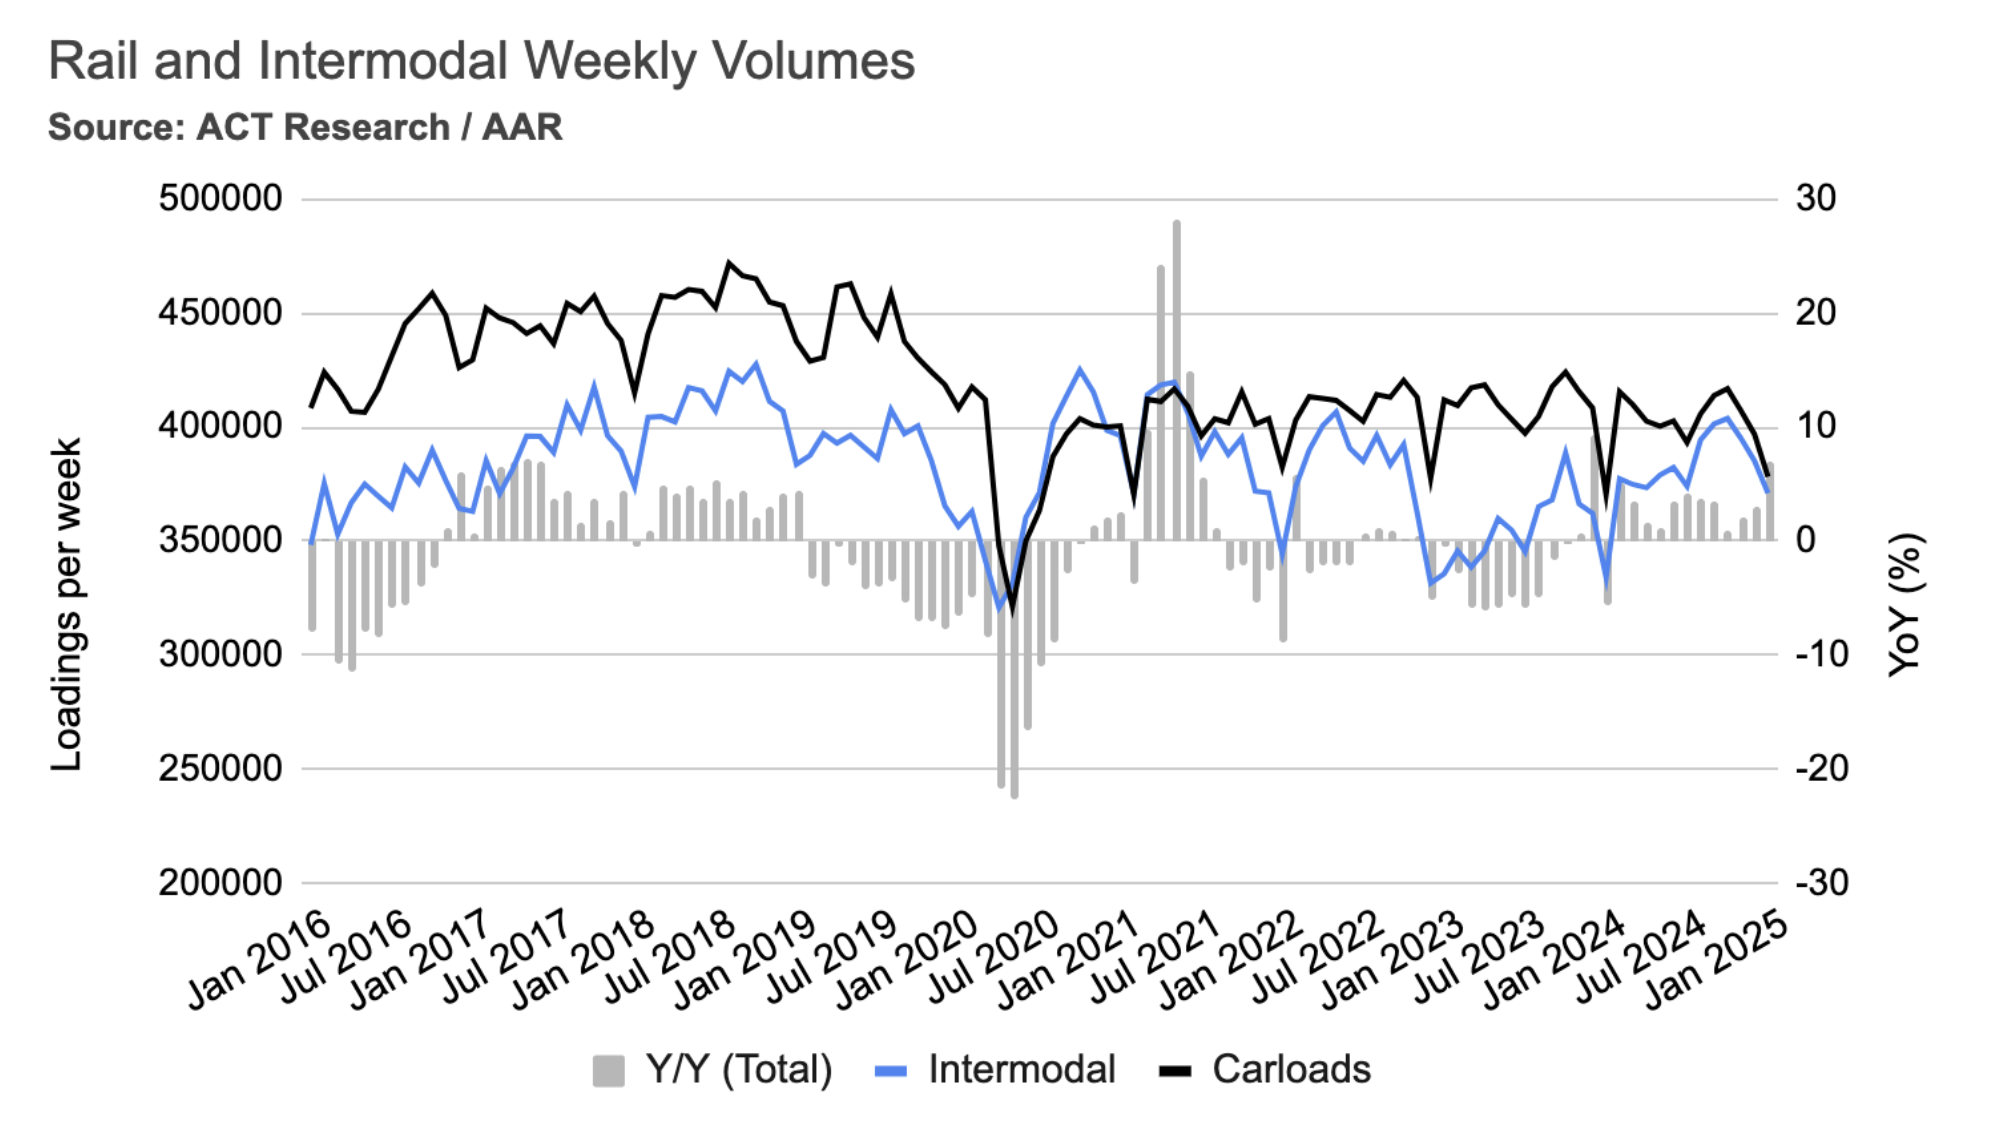
Intermodal rates
In January, average weekly intermodal loads decreased by 3.7%, and weekly carloads dropped by 4.7%. However, compared to the same time last year, intermodal volumes were significantly higher, up 11%, and carloads increased by 2.1%. It's worth noting that this January's declines were less severe than those of the previous year, which saw 7.7% and 9.3% reductions in intermodal and carload loadings, respectively.
Mazen’s work focuses on analyzing the freight transportation landscape, and producing short- and long-term forecasts based on supply and demand dynamics. He is also a research affiliate with the Intelligent Transportation Systems (ITS) Lab at MIT, where he completed his PhD in 2019. His work falls at the intersection of ITS, economic modeling, and analytics.
mdanaf@uberfreight.com
By Mazen Danaf, Senior Economist and Applied Scientist, Uber Freight
Featuring insights and contributions from Uber Freight leadership,
technologists and market specialists.


Route guide performance remained unchanged in September. The average First Tender Acceptance Rate remained stable at 93%, and Route Guide Compliance remained unchanged at 95%. Tender rejections are resulting in a slight cost increase of 1.2% over the primary carrier, up from 1.1% in August. This marginal increase indicates that route guide failure remains de-risked.
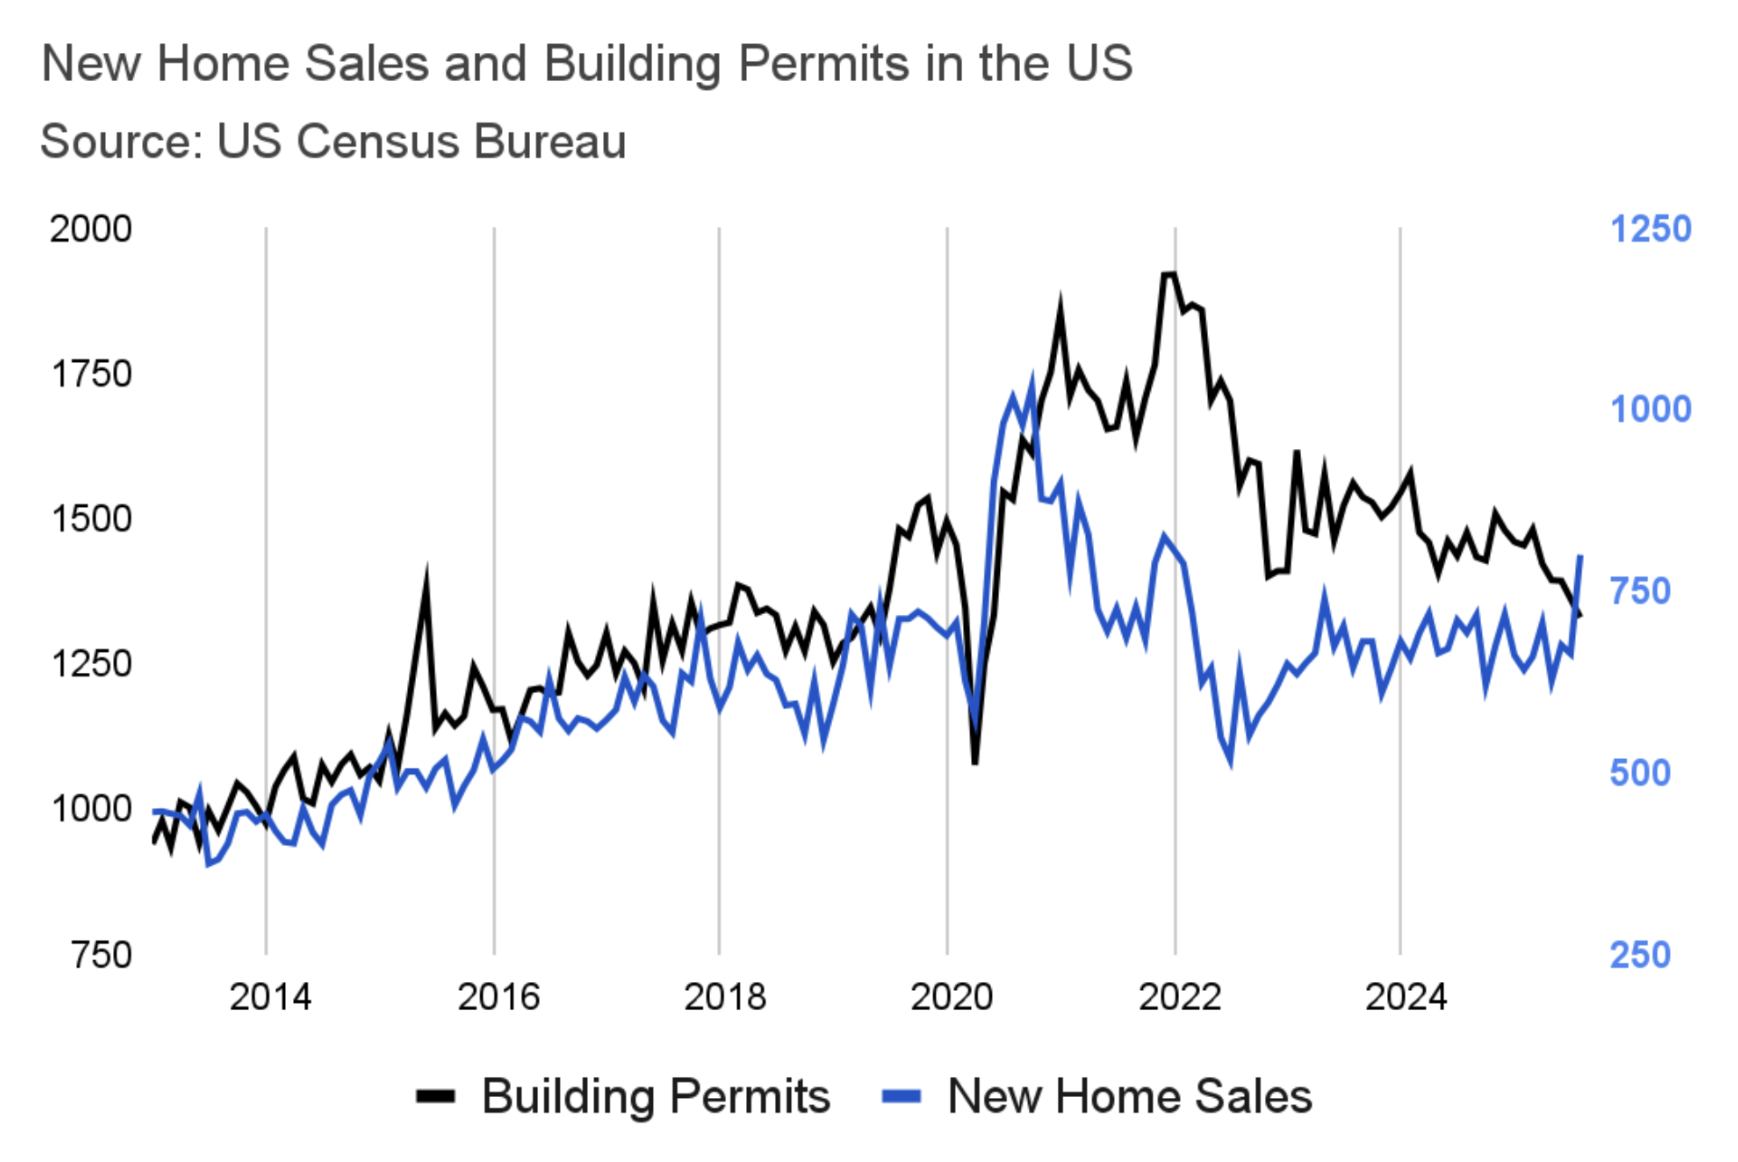
The U.S. housing market continues to contract, with new permits decreasing 2.3% month-over-month in August and 9.9% year-over-year. Despite this, August saw a positive shift: a slight dip in mortgage rates led to a 20.5% month-over-month surge in new home sales, reaching their highest level since January 2022. This suggests a significant pool of potential homebuyers awaiting lower mortgage rates, indicating a substantial amount of dormant freight demand that could be unleashed next year if rates fall.

Executive
summary
U.S.
economy
Freight
demand
Freight
supply
Housing Market
Average m/m and y/y van spot rate index by destination regions – August
Source: DAT
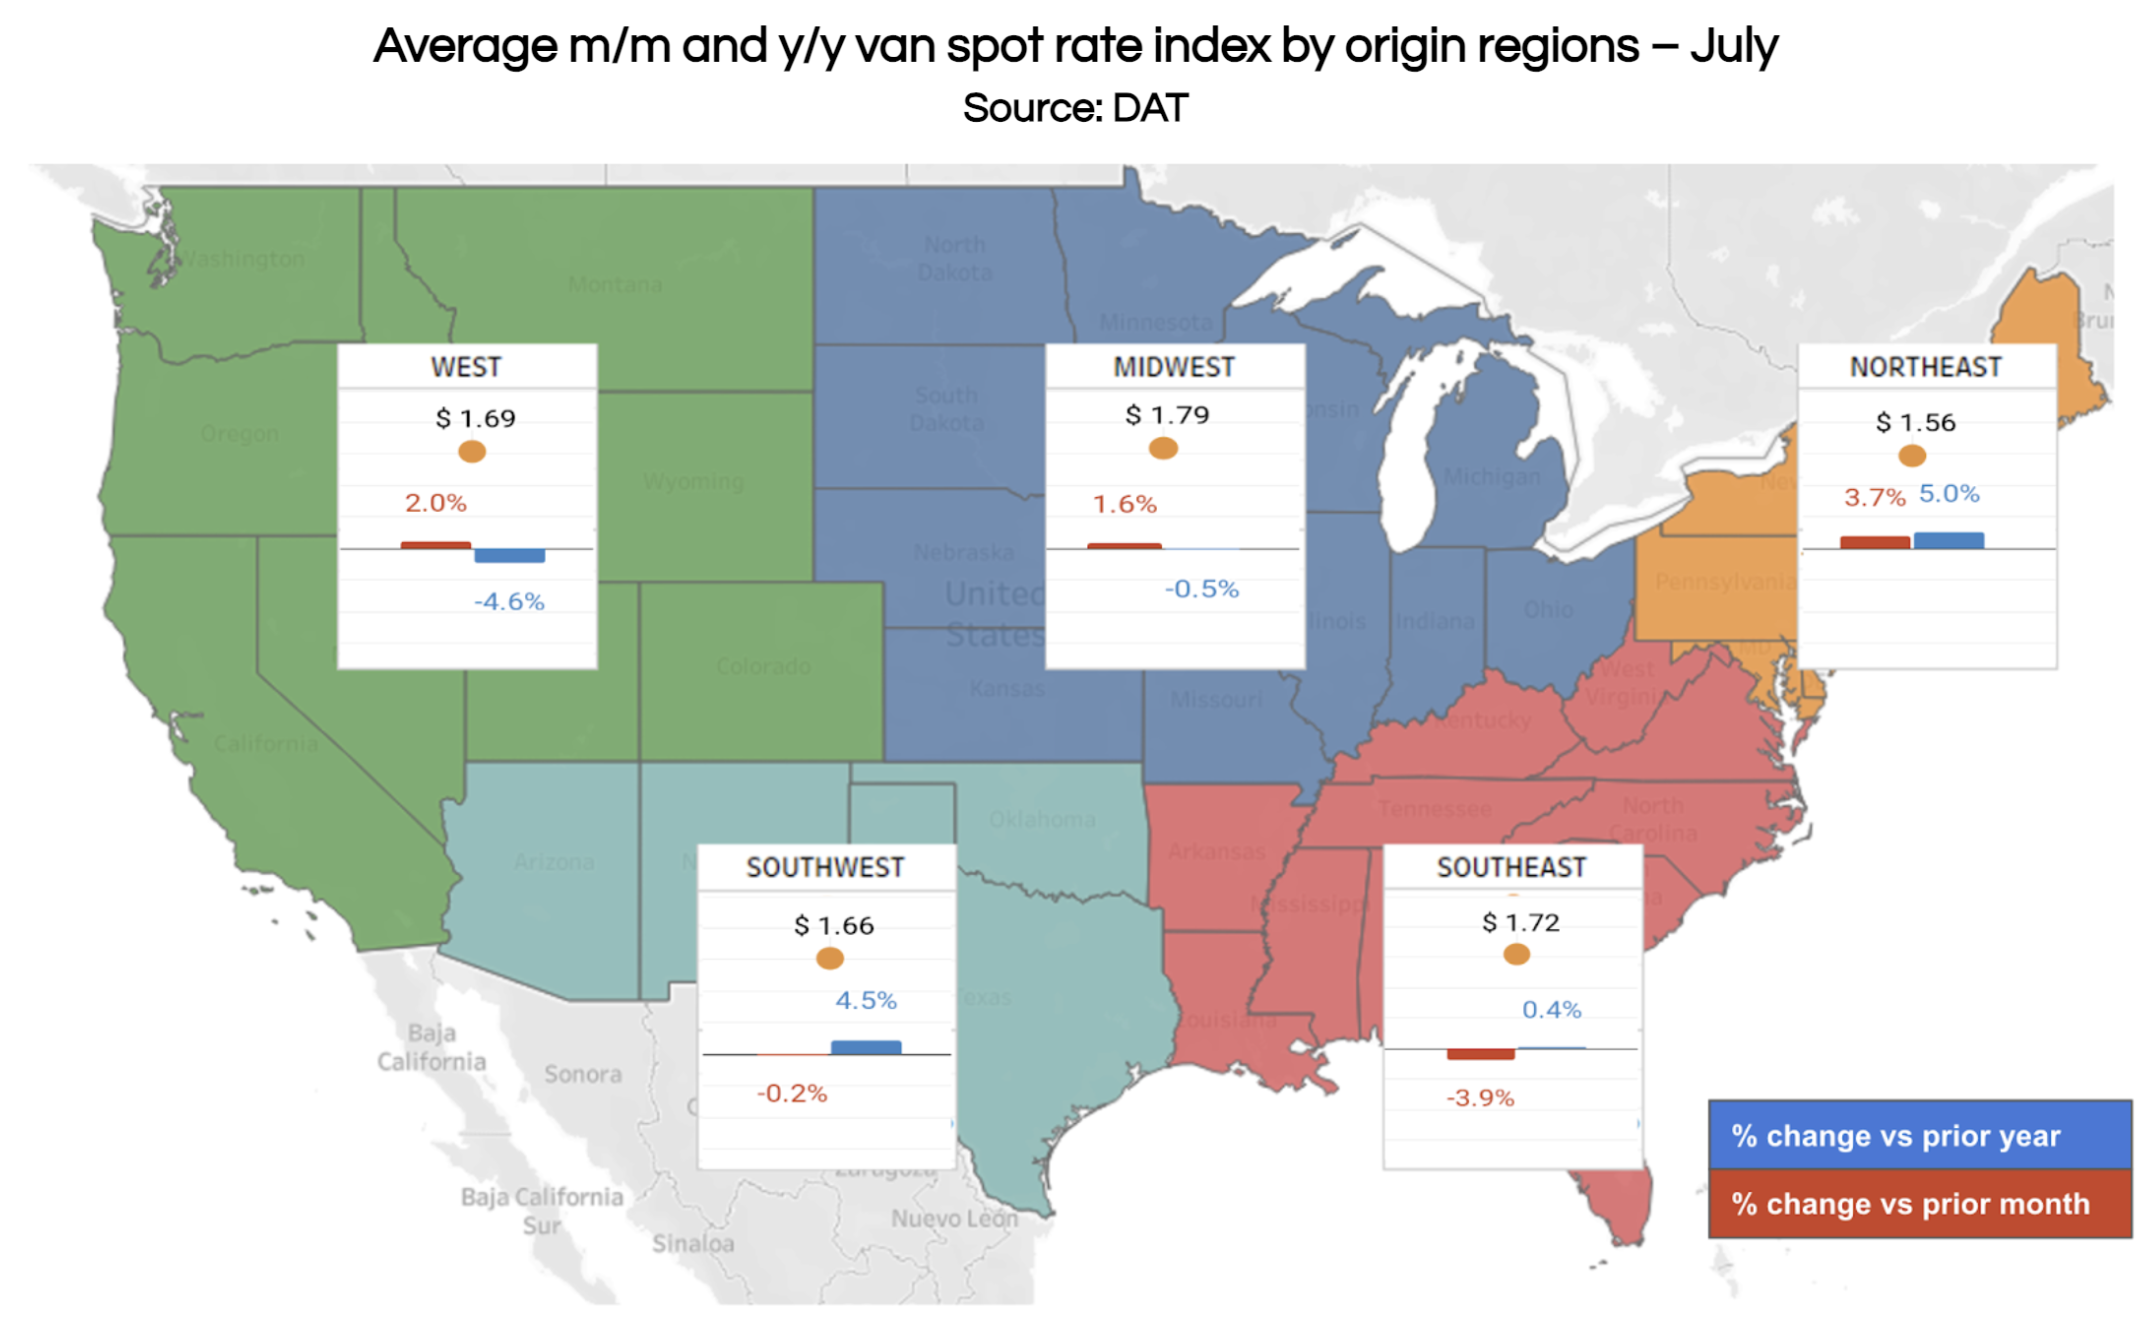
September exhibited typical seasonal trends in spot rates. The West, Midwest, and Northeast regions experienced increases of 0.8%, 2.2%, and 2.5%, respectively. Conversely, the Southeast and Southwest saw declines of 0.8% and 2.2%. Year-over-year, spot rates were up across all regions, with the Northeast showing the most significant increase at 5.1% and the Southeast the lowest at 1.4%.
Key data
points
Freight Supply
Carrier Population
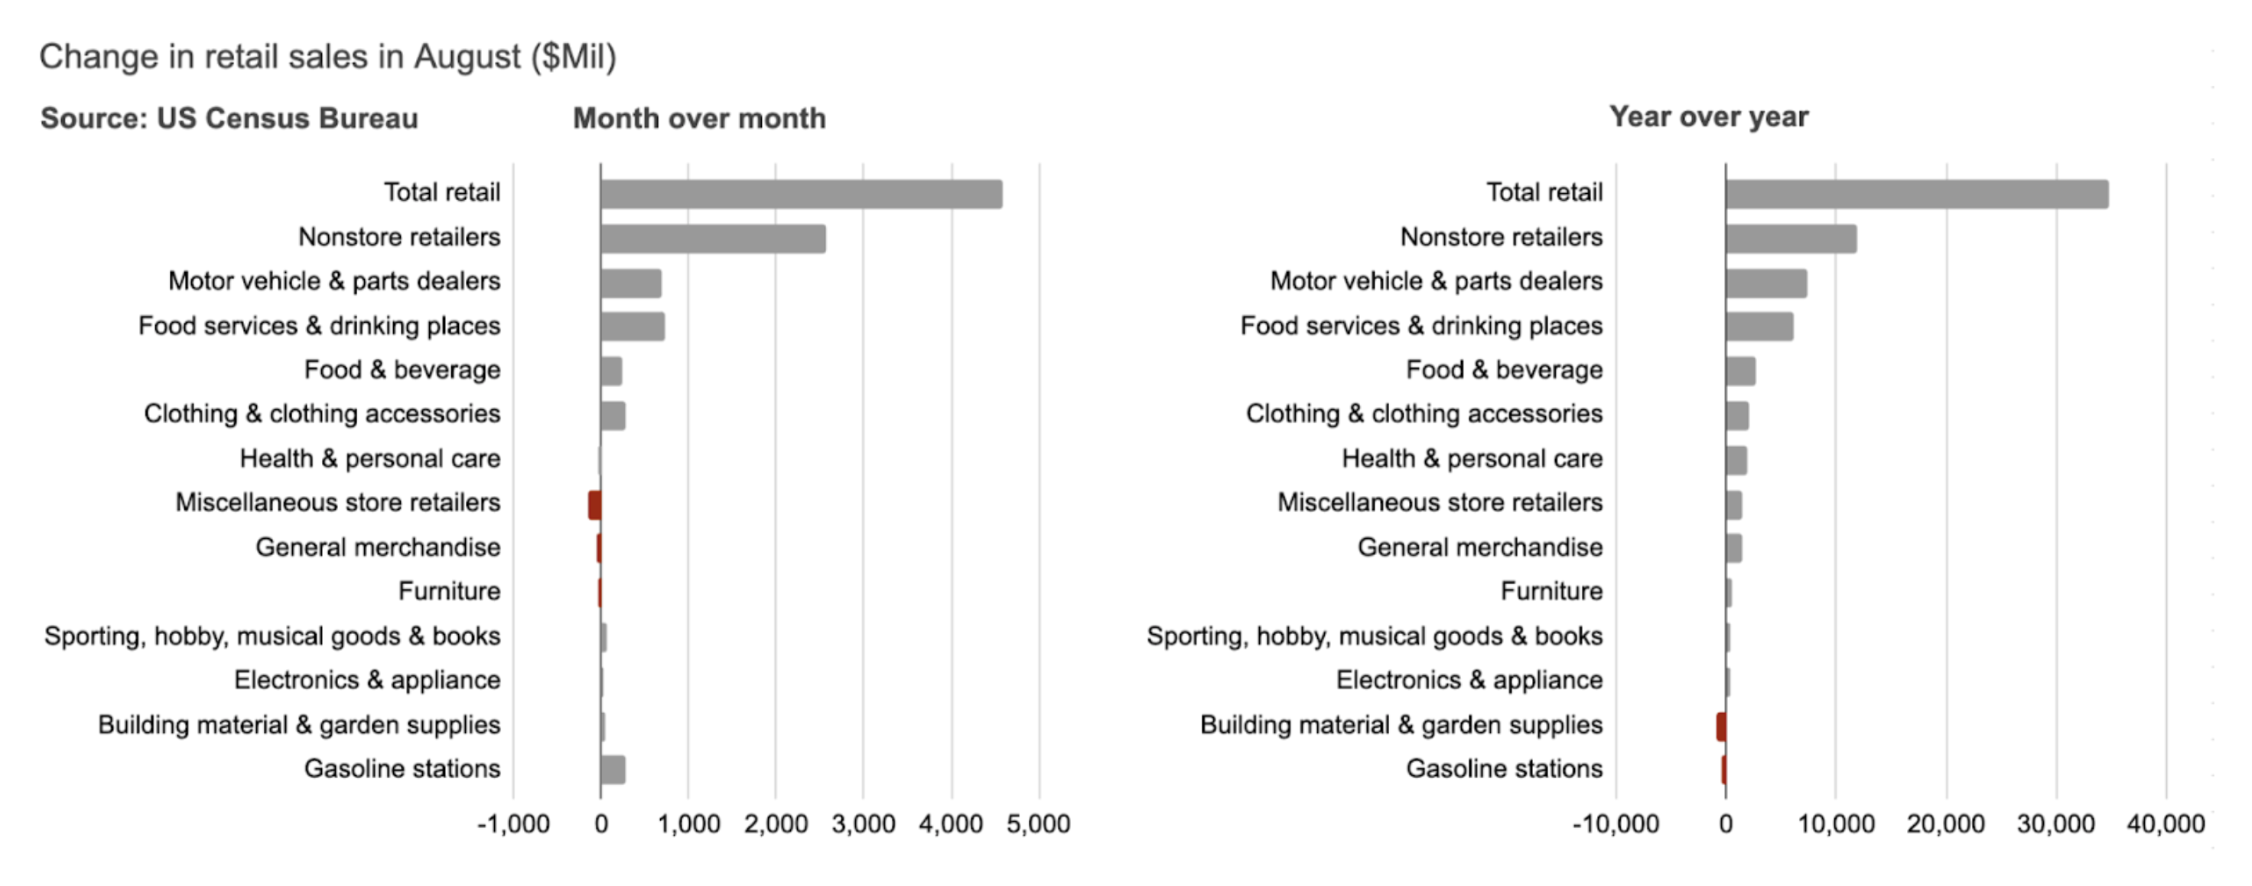
Consumer spending continued its upward trend in August.
Retail sales climbed 0.6% month-over-month and an impressive 5% year-over-year. This growth was largely fueled by strong performances in e-Commerce (+2%), food services (+0.7%), and apparel (+1%). However, the picture was mixed for sectors that typically contribute significantly to freight volumes. While food and beverage sales saw a modest increase of 0.3%, both furniture sales and department store sales experienced declines, falling by 0.3% and 0.8% respectively.
On a year-over-year basis, most sectors exhibited growth. The exceptions were department stores, which saw a 1% decline in sales, and building materials and garden supplies, where sales decreased by 2.3%.
Labor Market

Truckload demand slowed in June after a pre-stocking surge.
In August, truckload demand remained largely flat. A slight increase in retail and manufacturing demand was counteracted by a significant drop in imports. Consumer-driven demand rose 3.2% year-over-year, while manufacturing demand decreased by 0.2%. Full visibility into all demand indicators, such as wholesalers' sales and inventories, was not possible due to the government shutdown.


1/2
2/2
Tariffs continue to take their toll on the freight market and the broader U.S. economy. Inflation has been on the rise since the introduction of tariffs, while the labor market shows signs of softening. In the absence of government data, the ADP National Employment Report indicated a decline of 32,000 private sector jobs in September. The manufacturing sector continues to contract, and imports are decreasing after a surge in July, signaling a slowdown in freight demand. However, strong consumer spending is keeping both freight demand and the broader economy afloat.
1/3


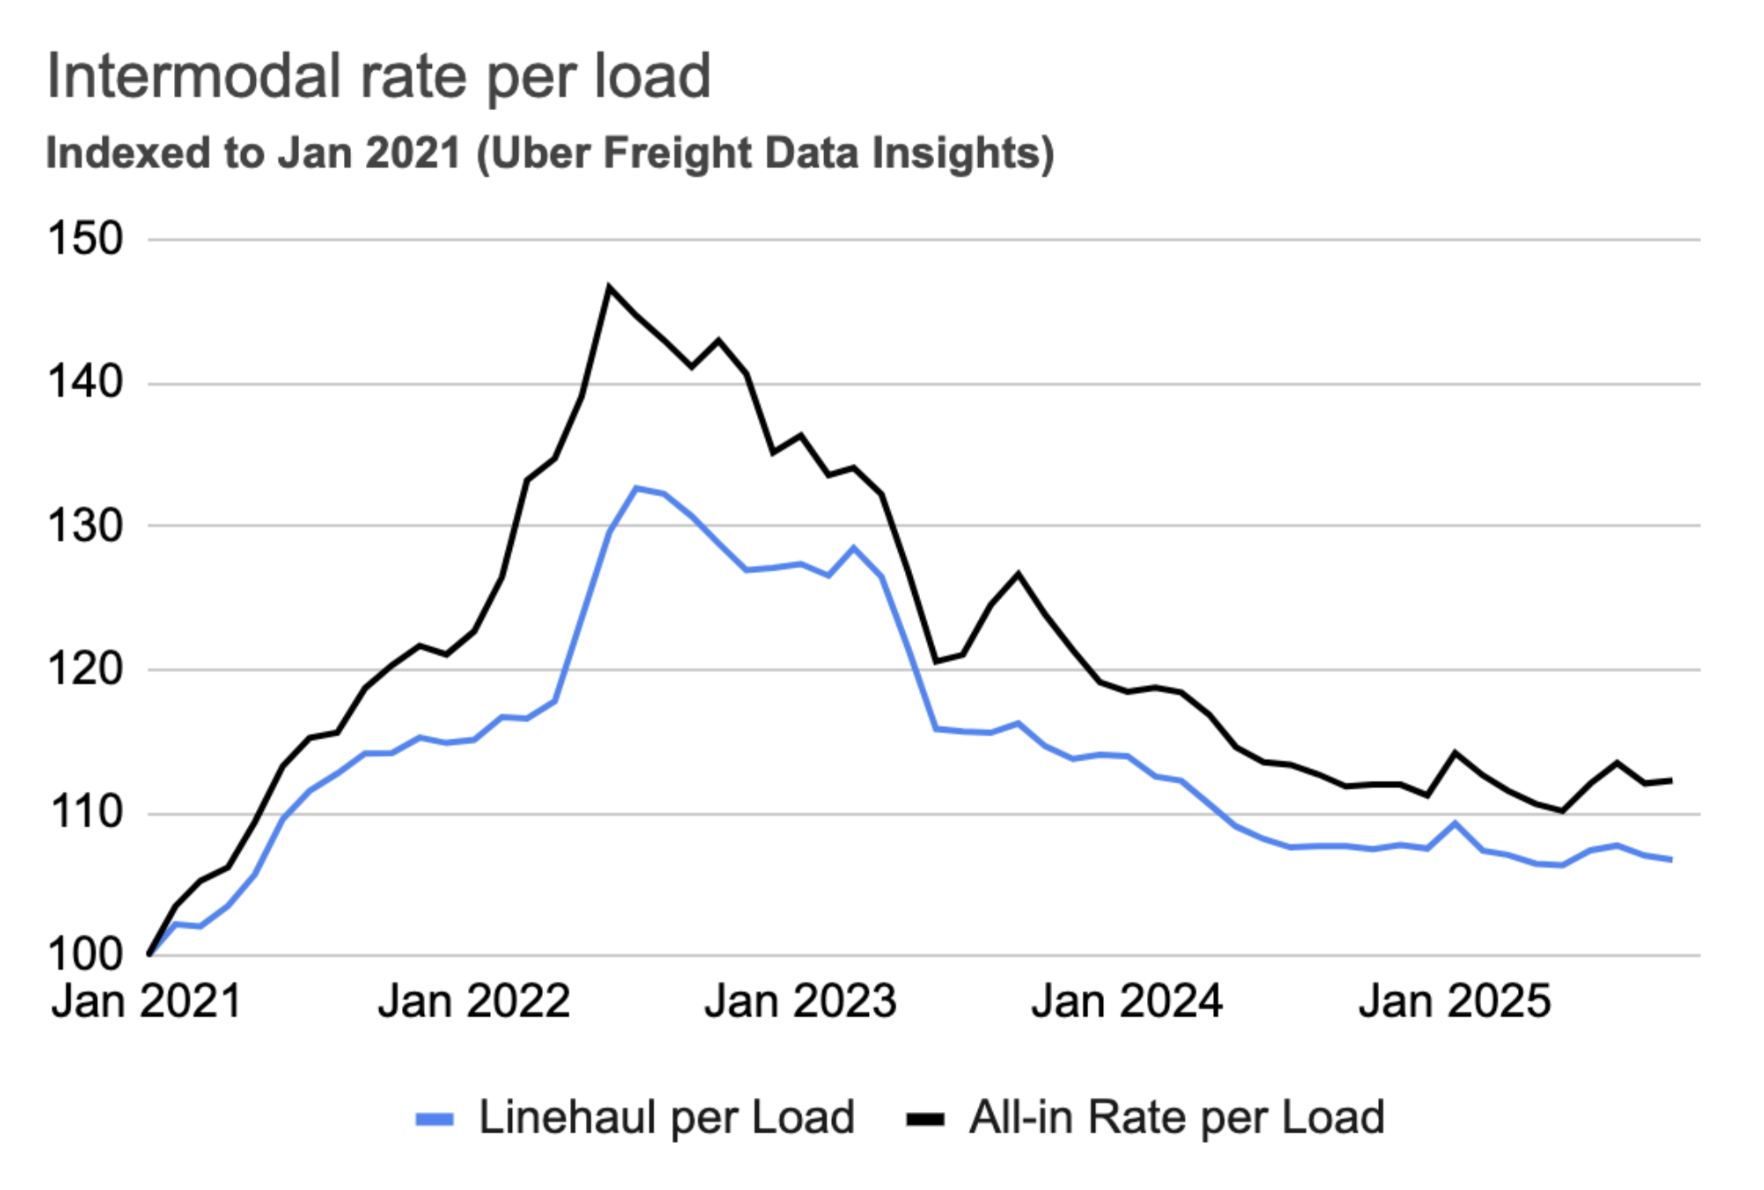
Intermodal rates continued to move sideways in September. According to Uber Freight's Intermodal Rate Index, September saw a slight 0.3% dip in linehaul intermodal rates. However, the all-in rate per load increased by 0.2% month-over-month, driven by rising fuel prices. Year-over-year, linehaul rates in September were 0.9% lower, while all-in rates were 0.4% higher.
2/2
Shipper and carrier insights
The Personal Consumption Expenditures (PCE) price index, the Federal Reserve's preferred inflation gauge, has shown a consistent upward trend since April, climbing from 2.3% to 2.7%. This rise slightly surpasses the Fed's 2% target. When excluding the volatile food and energy sectors, inflation increased from 2.6% to 2.9%, suggesting a potentially sustained inflationary environment. While inflation in the services sector remained steady at approximately 3.5%, the primary driver of this increase has been durable goods prices, which have risen by 1.5% since the announcement of new tariffs.
Inflation
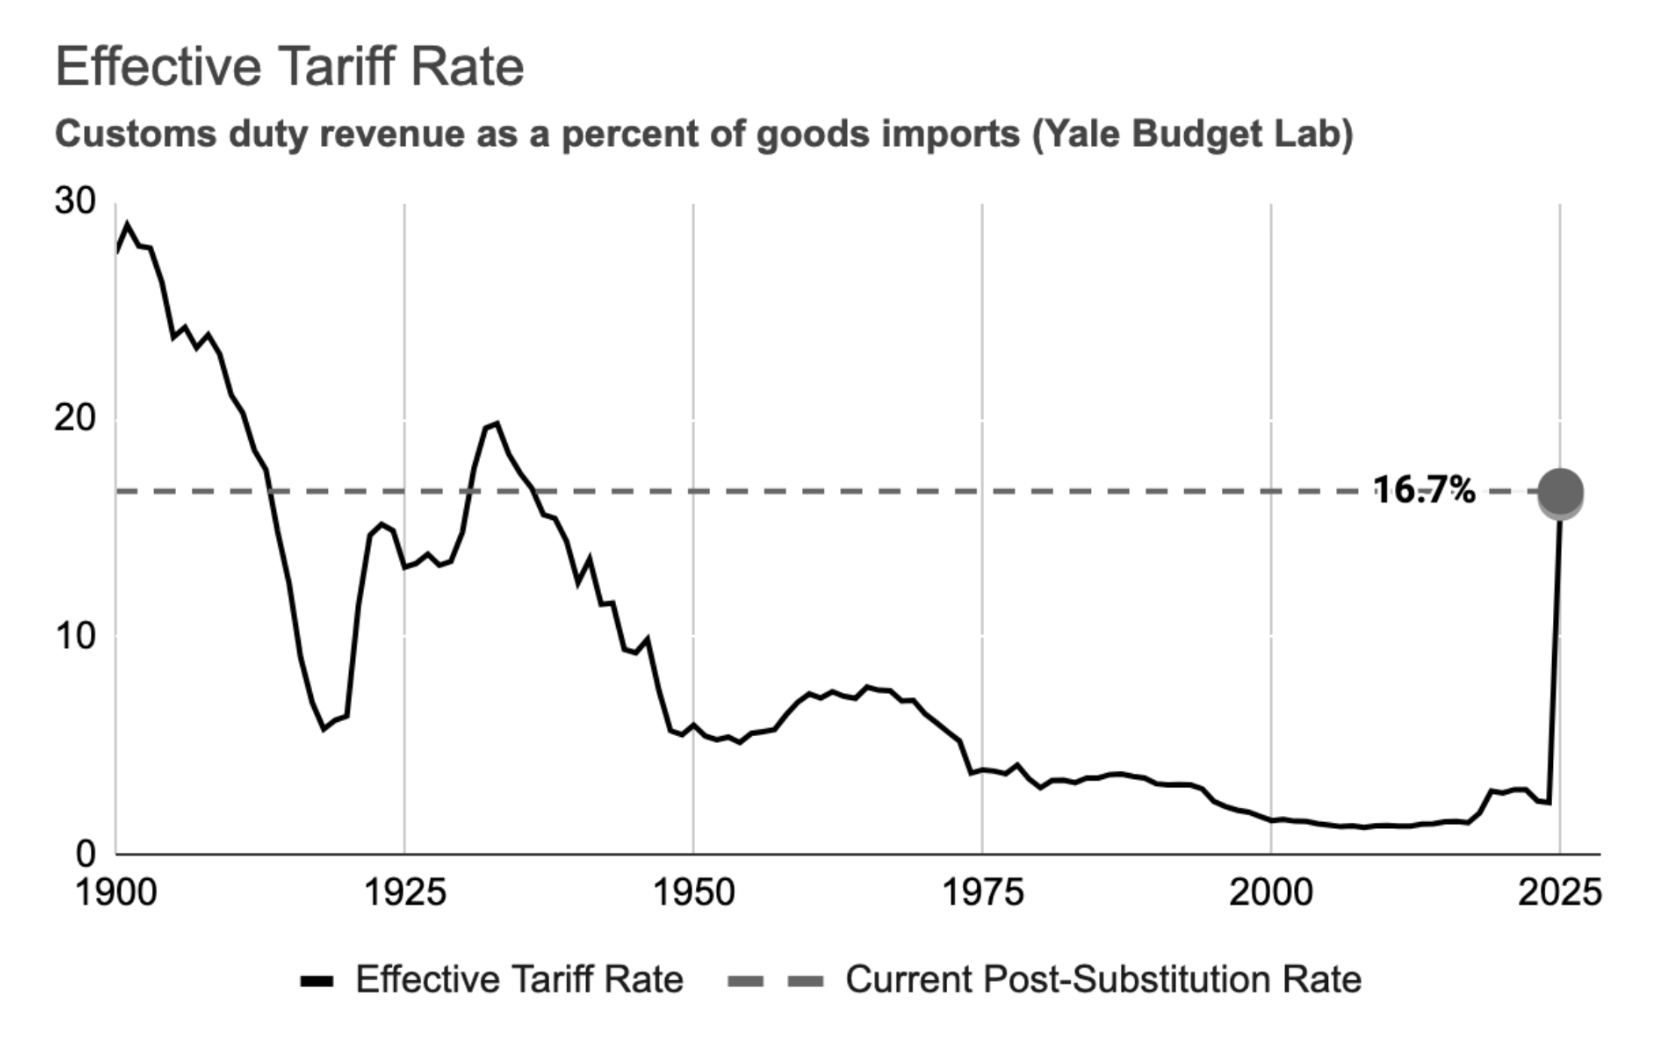
This increase is projected to raise prices by 1.4%, costing the average household $1,900 annually, according to the Yale Budget Lab. The impact is particularly felt in clothing, footwear, automobiles, and electrical equipment, as well as manufacturing commodities like metals, minerals, and machinery. Evidence of inflation is already emerging in manufacturing (ISM PMI) and wholesale (PPI).
On September 25th, President Trump announced new tariffs: 100% on branded/on-patent pharmaceuticals, 50% on kitchen cabinets, bathroom vanities, and related products, 30% on upholstered furniture, and 25% on heavy trucks. Furthermore, President Trump also issued a warning of an additional 100% tariff on Chinese imports, a measure that could significantly elevate average tariff rates beyond those seen in September.

Tariffs
In the long run, tariffs might boost domestic freight by giving local manufacturers an edge. However, the magnitude and sudden implementation of tariffs means we probably won't see benefits for a while, and the immediate damage will be greater.
Unlike Canada and Mexico, the 10% percent tariffs on Chinese products went into effect on February 4, and are likely to stay. Tariffs on China were already anticipated by shippers, some of which pulled imports forward in 2024.
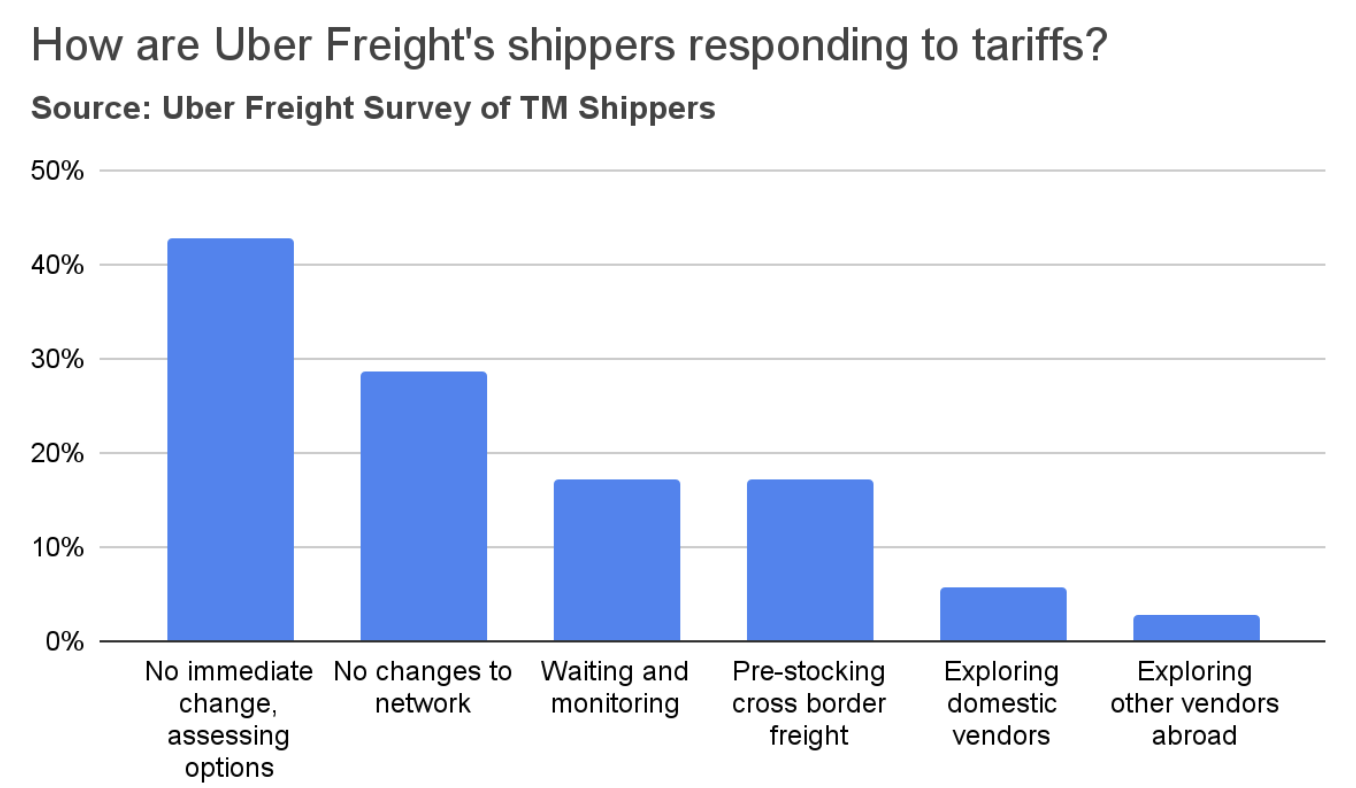
A survey of Uber Freight shippers found that the majority do not foresee immediate changes to their networks. However, a significant minority (42%) are actively assessing various options. Some shippers reported that they anticipate absorbing cost increases and subsequently passing those increases on to their customers. Seventeen percent of shippers indicated they are pre-stocking cross-border inventories. In contrast, very few are exploring domestic alternatives or alternative vendors in countries not impacted by tariffs. Some expressed concerns that it will take several months to adapt their networks.
Labor market


The U.S. manufacturing sector contracted further in September.
The Institute for Supply Management's (ISM) Purchasing Manager's Index (PMI) edged up slightly to 49.1 in September, yet remained below the 50.0 expansion threshold, signaling a sustained, but mild, contraction in manufacturing. Both New Orders and Backlogs, key forward-looking indicators, stayed under 50.0, suggesting continued softness in future demand. While the Prices Index decreased to 61.9, it's still considerably above 50.0, indicating persistent commodity and raw material inflation. A majority of ISM survey respondents cited significant challenges stemming from tariffs.
Manufacturing
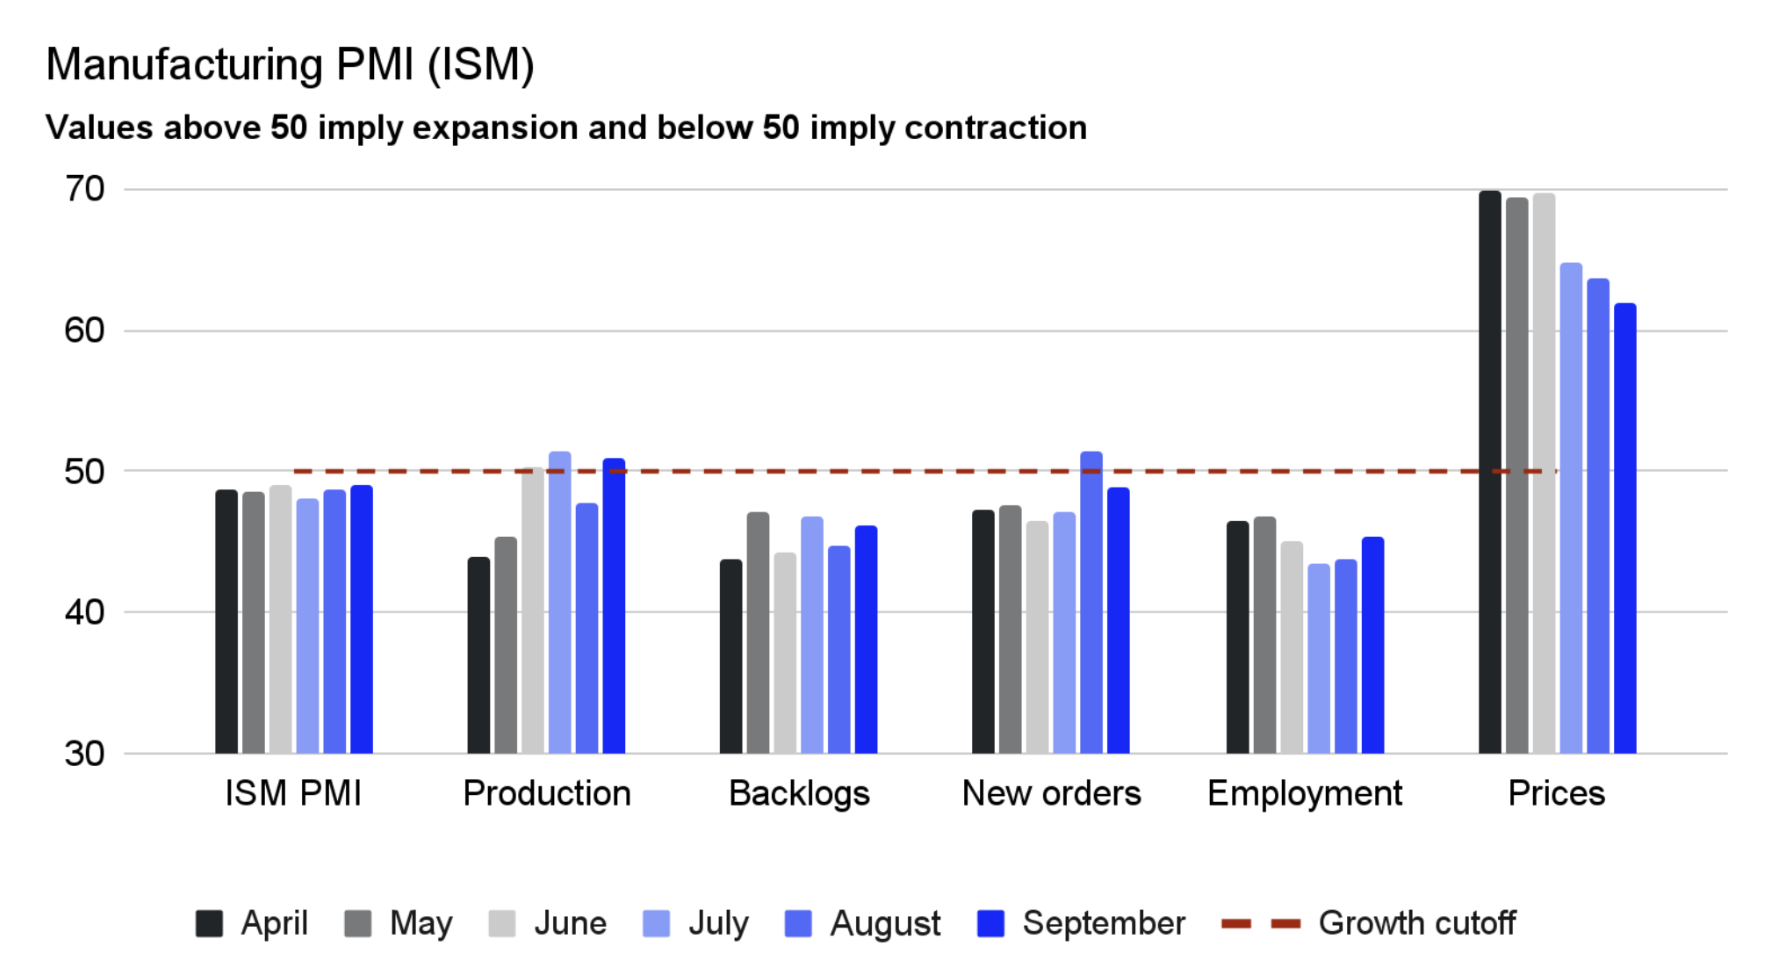
The ISM report also highlighted widespread concerns among manufacturers about declining demand and order levels. Respondents across various sectors expressed pessimism about the near-term outlook.
Manufacturing

2/2
Freight supply
Spot and
contract rates

Carrier
population

Supply and demand indices

Tractor orders

August saw steady truckload demand compared to July, yet it saw a 1.5% year-over-year increase. This rise can be attributed to ongoing consumer strength and increased wholesale stocking, which followed record import levels in July in anticipation of further tariff instability. We anticipate a slowdown in demand growth as the full impact of these tariffs unfolds in the coming months. Despite this, the gap between supply and demand continues to widen, with our supply index indicating a 0.3% year-over-year decrease.

Truckload supply and demand indices
A 25% tariff on new tractors could also contribute to the potential capacity tightening next year.
President Donald Trump announced plans to impose a 25% tariff on medium- and heavy-duty trucks starting next month. This action directly targets Mexico, which is a major manufacturing hub under the USMCA trade agreement. Mexico exported 159,466 heavy-duty trucks in 2024, with 95.5% going to the U.S. These trucks are currently permitted to cross the border tariff-free under the USMCA, provided they meet strict rules of origin requiring 64% of their value to originate regionally (a threshold set to increase to 70%). This announcement comes at a time when tractor orders are near their lowest levels in 5 years. Preliminary Class 8 orders totaled 20,800 units in September, down 44% y/y.
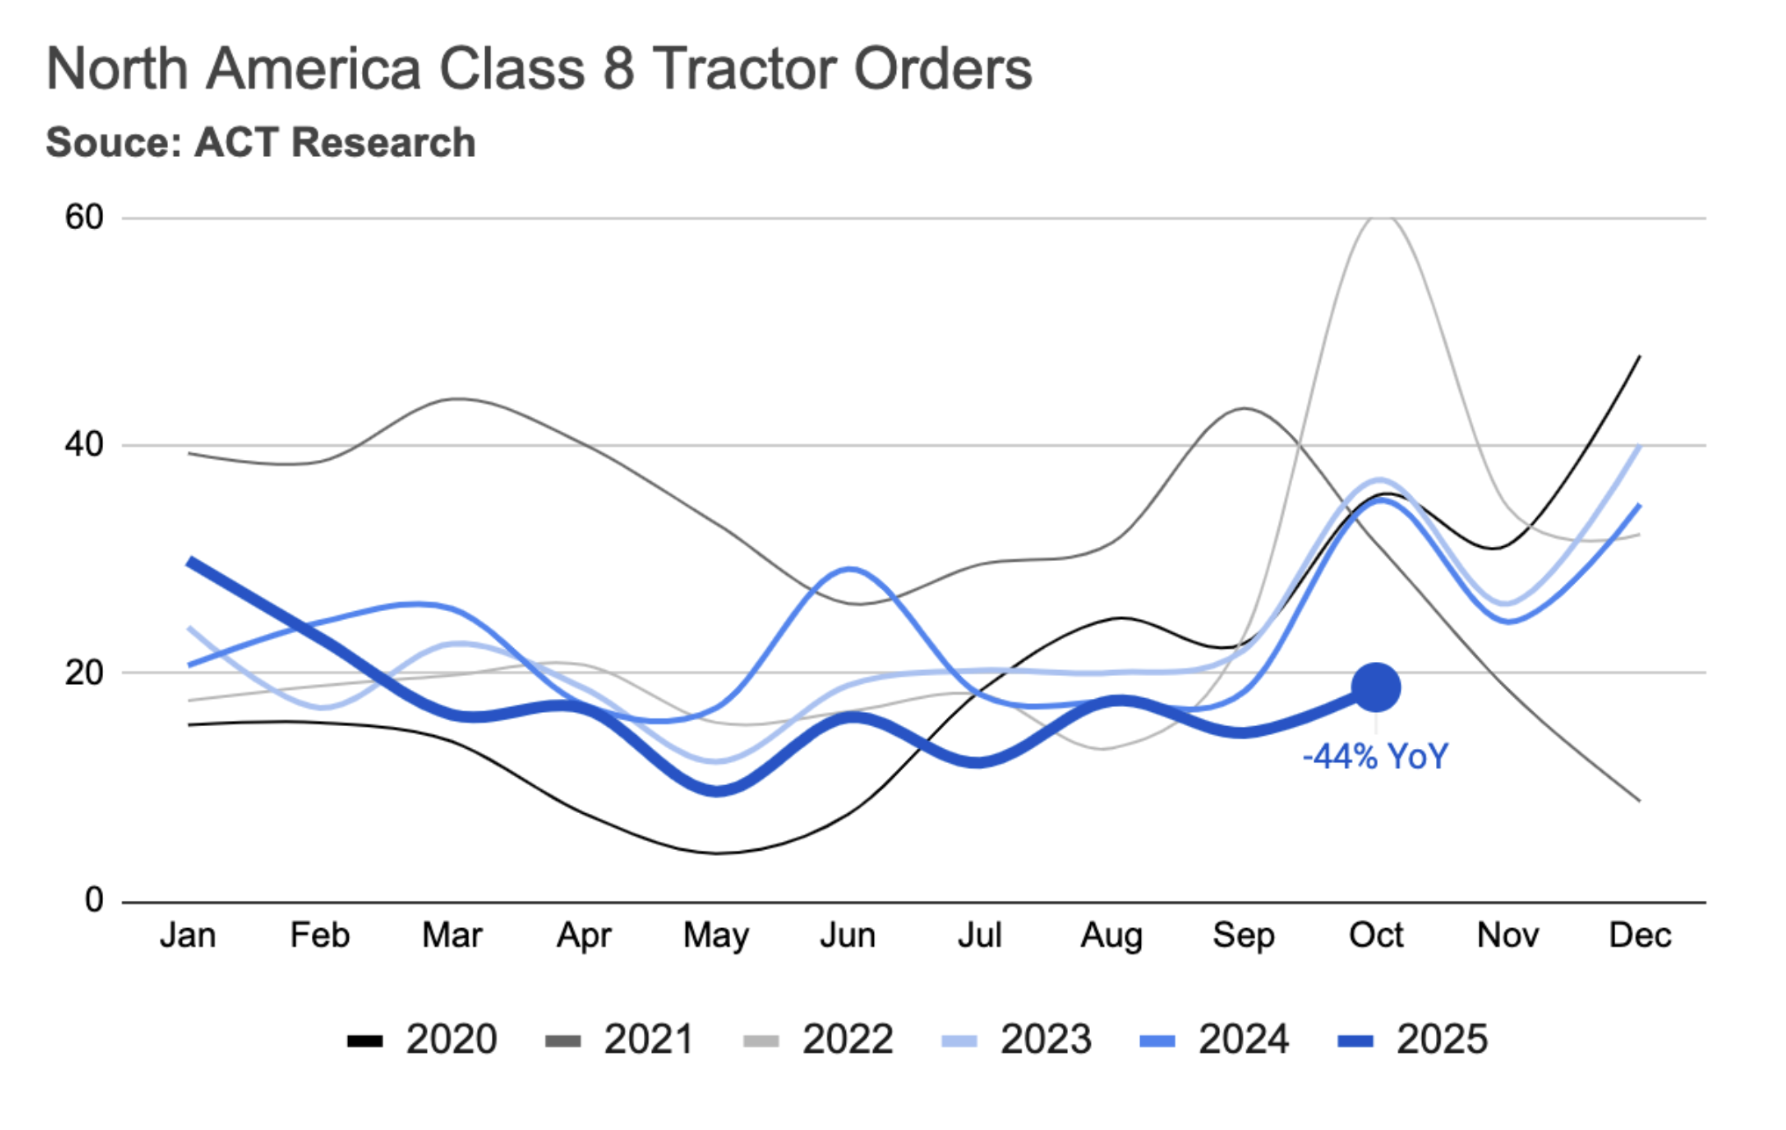
Tractor orders
Spot rates rose in September across all trucking modes.
Dry van spot rates saw a modest increase of 0.6% month-over-month (August to September), alongside a more significant 2.5% year-over-year rise (from September 2024). Reefer rates also increased by 1.5% month-over-month and showed a similar 1.5% year-over-year increase. Flatbed rates demonstrated stronger growth, rising 1.5% month-over-month and a notable 4.7% year-over-year.
On the contract side, Dry Van rates dipped slightly by 0.5% month-over-month but grew by 1.5% year-over-year. In contrast, Reefer and Flatbed rates showed minimal month-over-month changes, with Reefer up 0.4% and Flatbed holding steady at 0%. Both categories recorded slight annual increases: 0.4% for Reefer and 0.8% for Flatbed.
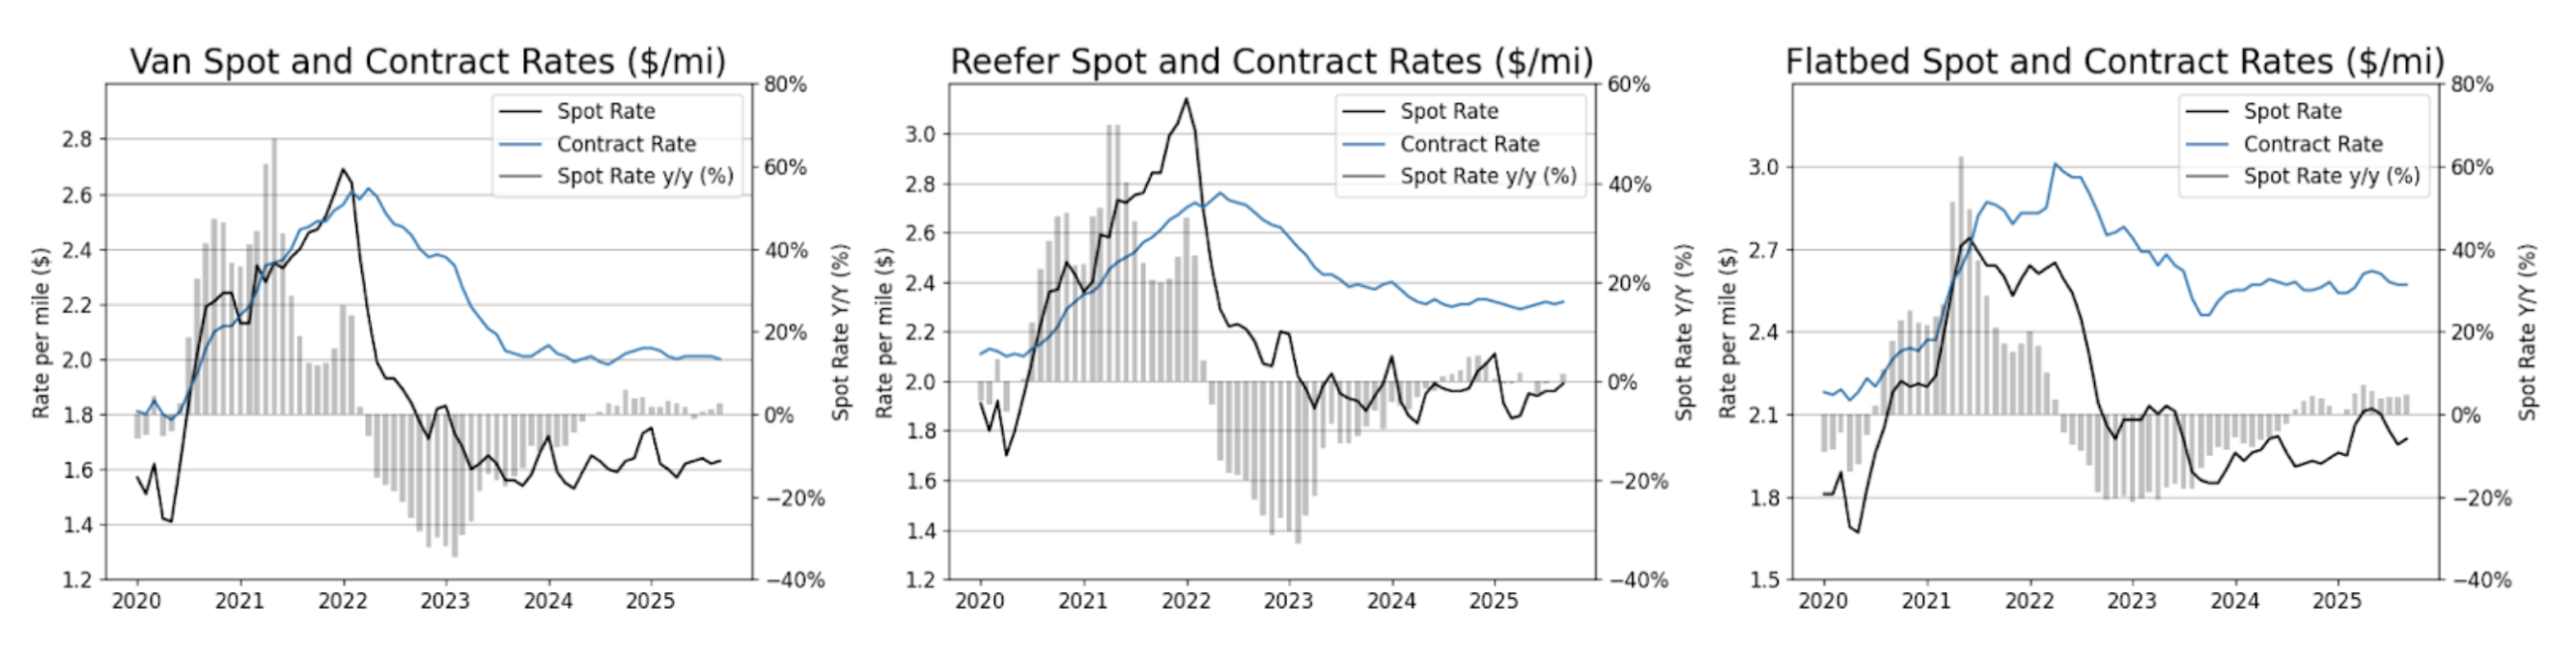
Spot and contract rates
Market conditions
Market
conditions
Spot rates across all trucking modes saw an increase in September, though they remain only slightly above last year's levels. The aforementioned regulations targeting freight supply, however, could increase upside risk in 2026, potentially leading to a significantly tighter market.
3/3
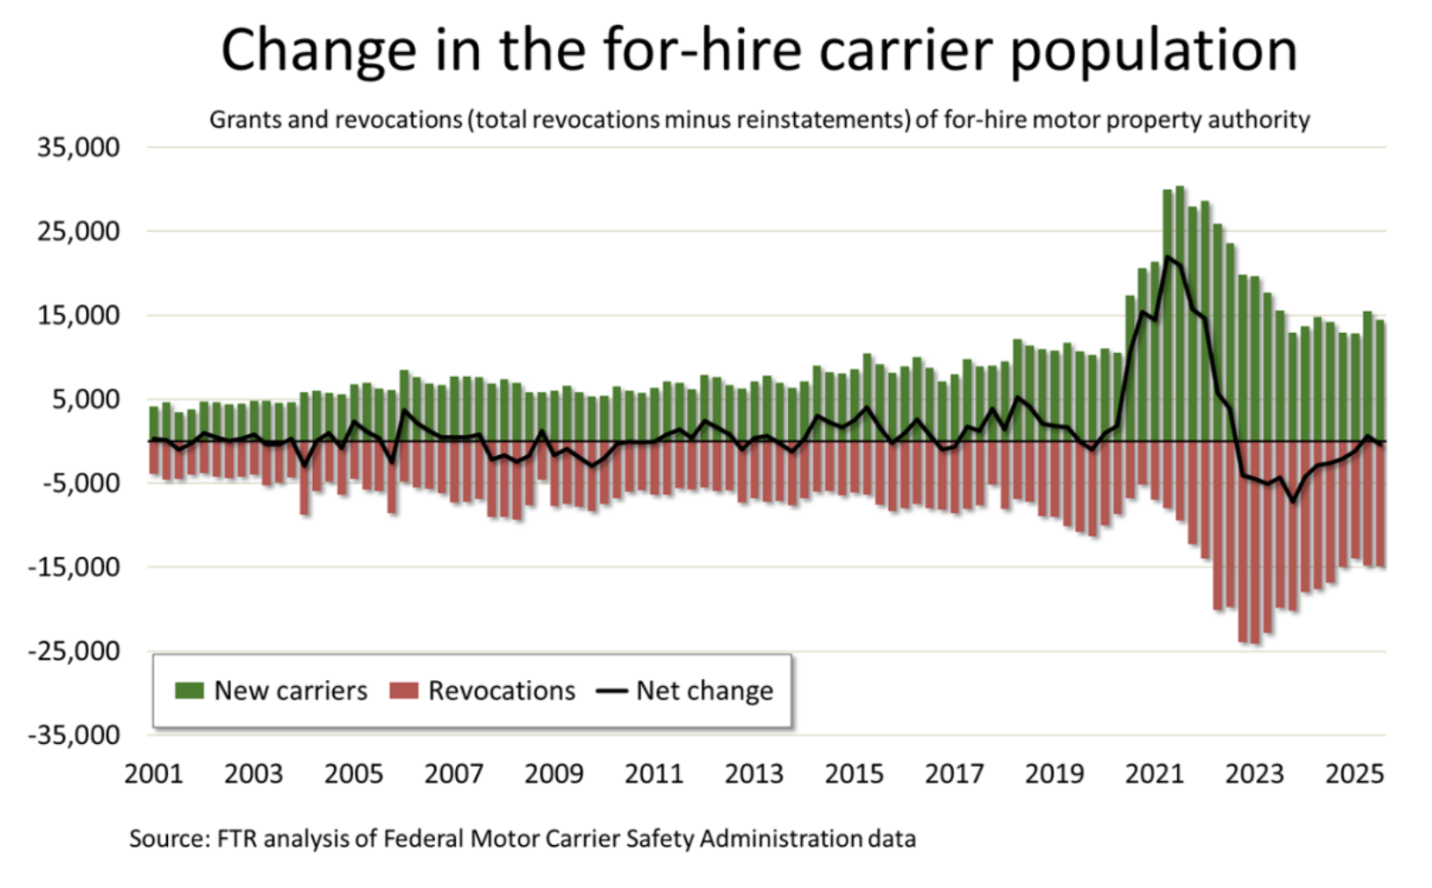
An emergency order targeting non-domiciled CDLs could drive a capacity crunch in 2026.
U.S. Transportation Secretary Sean P. Duffy issued an emergency order immediately halting states from issuing or renewing non-domiciled Commercial Driver’s Licenses (CDLs). This rule closes loopholes created by states that had been granting CDLs to foreign nationals who lacked required employment-based visas or whose licenses were improperly extended long past the expiration of their lawful presence. The Federal Motor Carrier Safety Administration (FMCSA) estimates that its interim final rule on non-domiciled CDLs will remove 194,000 drivers from the market over the next two years.
Additionally, the carrier population continues to shrink due to ongoing capacity reduction. FMCSA data indicates a net decrease of 385 carriers in Q3, following a modest increase of only 671 in Q2.

Carrier population
Consumer spending has shown remarkable resilience in the past two years, proving to be a key bright spot in the economy. In August, real consumer spending on goods increased by 0.7%, marking a 4.2% rise from the previous year. This indicates an increase in the volume of goods purchased, rather than just a reflection of higher prices, as it is an inflation-adjusted figure.
Both durable and non-durable goods saw strong performance. Spending on durables grew by 0.9% in August and was up 5.2% year-over-year. Non-durables also demonstrated strength, with a 0.5% increase in August and a 3.7% rise compared to the same period last year. Goods spending has outpaced services, where spending only saw a 2.1% increase year-over-year.
Click to jump to section
Looking ahead to 2026, potential regulatory changes could lead to a capacity crunch in the freight industry. The Federal Motor Carrier Safety Administration (FMCSA) estimates that an interim final rule on non-domiciled commercial driver's licenses (CDLs) could remove 194,000 drivers from the market over the next two years. Additionally, a planned 25% tariff on medium- and heavy-duty trucks, set to begin next month, comes at a time when tractor orders are near a five-year low.
2/3
Inflation has been creeping up since the announcement of tariffs.
Industrial production of machinery, primary metals, and fabricated metals has remained relatively flat or slightly declined over the past year. A recovery in these sectors seems unlikely in the near future, as orders and shipments of core capital goods—a key indicator of manufacturing activity—have also stagnated.
Orders for core capital goods, which are nondefense capital goods excluding aircraft, are considered an early indicator of manufacturing activity. Weak orders and shipments in this sector suggest that a broader economic recovery may be delayed.


Tariffs continue to take their toll on the freight market and the broader U.S. economy. Inflation has been on the rise since the introduction of tariffs, while the labor market shows signs of softening. In the absence of government data, the ADP National Employment Report indicated a decline of 32,000 private sector jobs in September. The manufacturing sector continues to contract, and imports are decreasing after a surge in July, signaling a slowdown in freight demand. However, strong consumer spending is keeping both freight demand and the broader economy afloat.
1/3
Industrial equipment and supplies
Automotive
Auto manufacturing has been one of the bright spots in the economy over the past year, driven by pent-up demand and a shortage of vehicles at dealerships. While production rose to meet demand, the market is starting to show signs of saturation, with inventories gradually normalizing and potential glut looming on the wholesale side.


Paper and plastics
Paper and plastics are highly used in the packaging industry, which has been affected by the recent slowdown in food spending after the economy re-opened. In addition, the demand for paper products was already on a downward trajectory due to factors such as digitalization, adoption of alternatives (plastics), and growth of e-commerce. The pandemic further accelerated this decline. Moreover, a surge in downstream inventories led to a slowdown in manufacturers’ demand.


Nondurable consumer goods
Demand for food consumed at home fell from its pandemic highs as the economy re-opened, normalizing back to its pre-pandemic levels. Demand for other consumer goods (such as apparel) continues to be pressured by external competition, slowing consumer demand, and high downstream inventories.


Durable consumer goods
Durable consumer goods such as appliances, furniture, and wood products are affected by the ongoing housing recession. New home sales remain below the 2019 levels, and about 30% below the pandemic peak. Similarly, housing starts are at their lowest level since the beginning of the housing recession, 32% below the 2022 peak.


Effective tariff rates have hit 16.7% in September, a level not seen since 1936.
The U.S. housing market saw volatility amidst shifting mortgage rates.
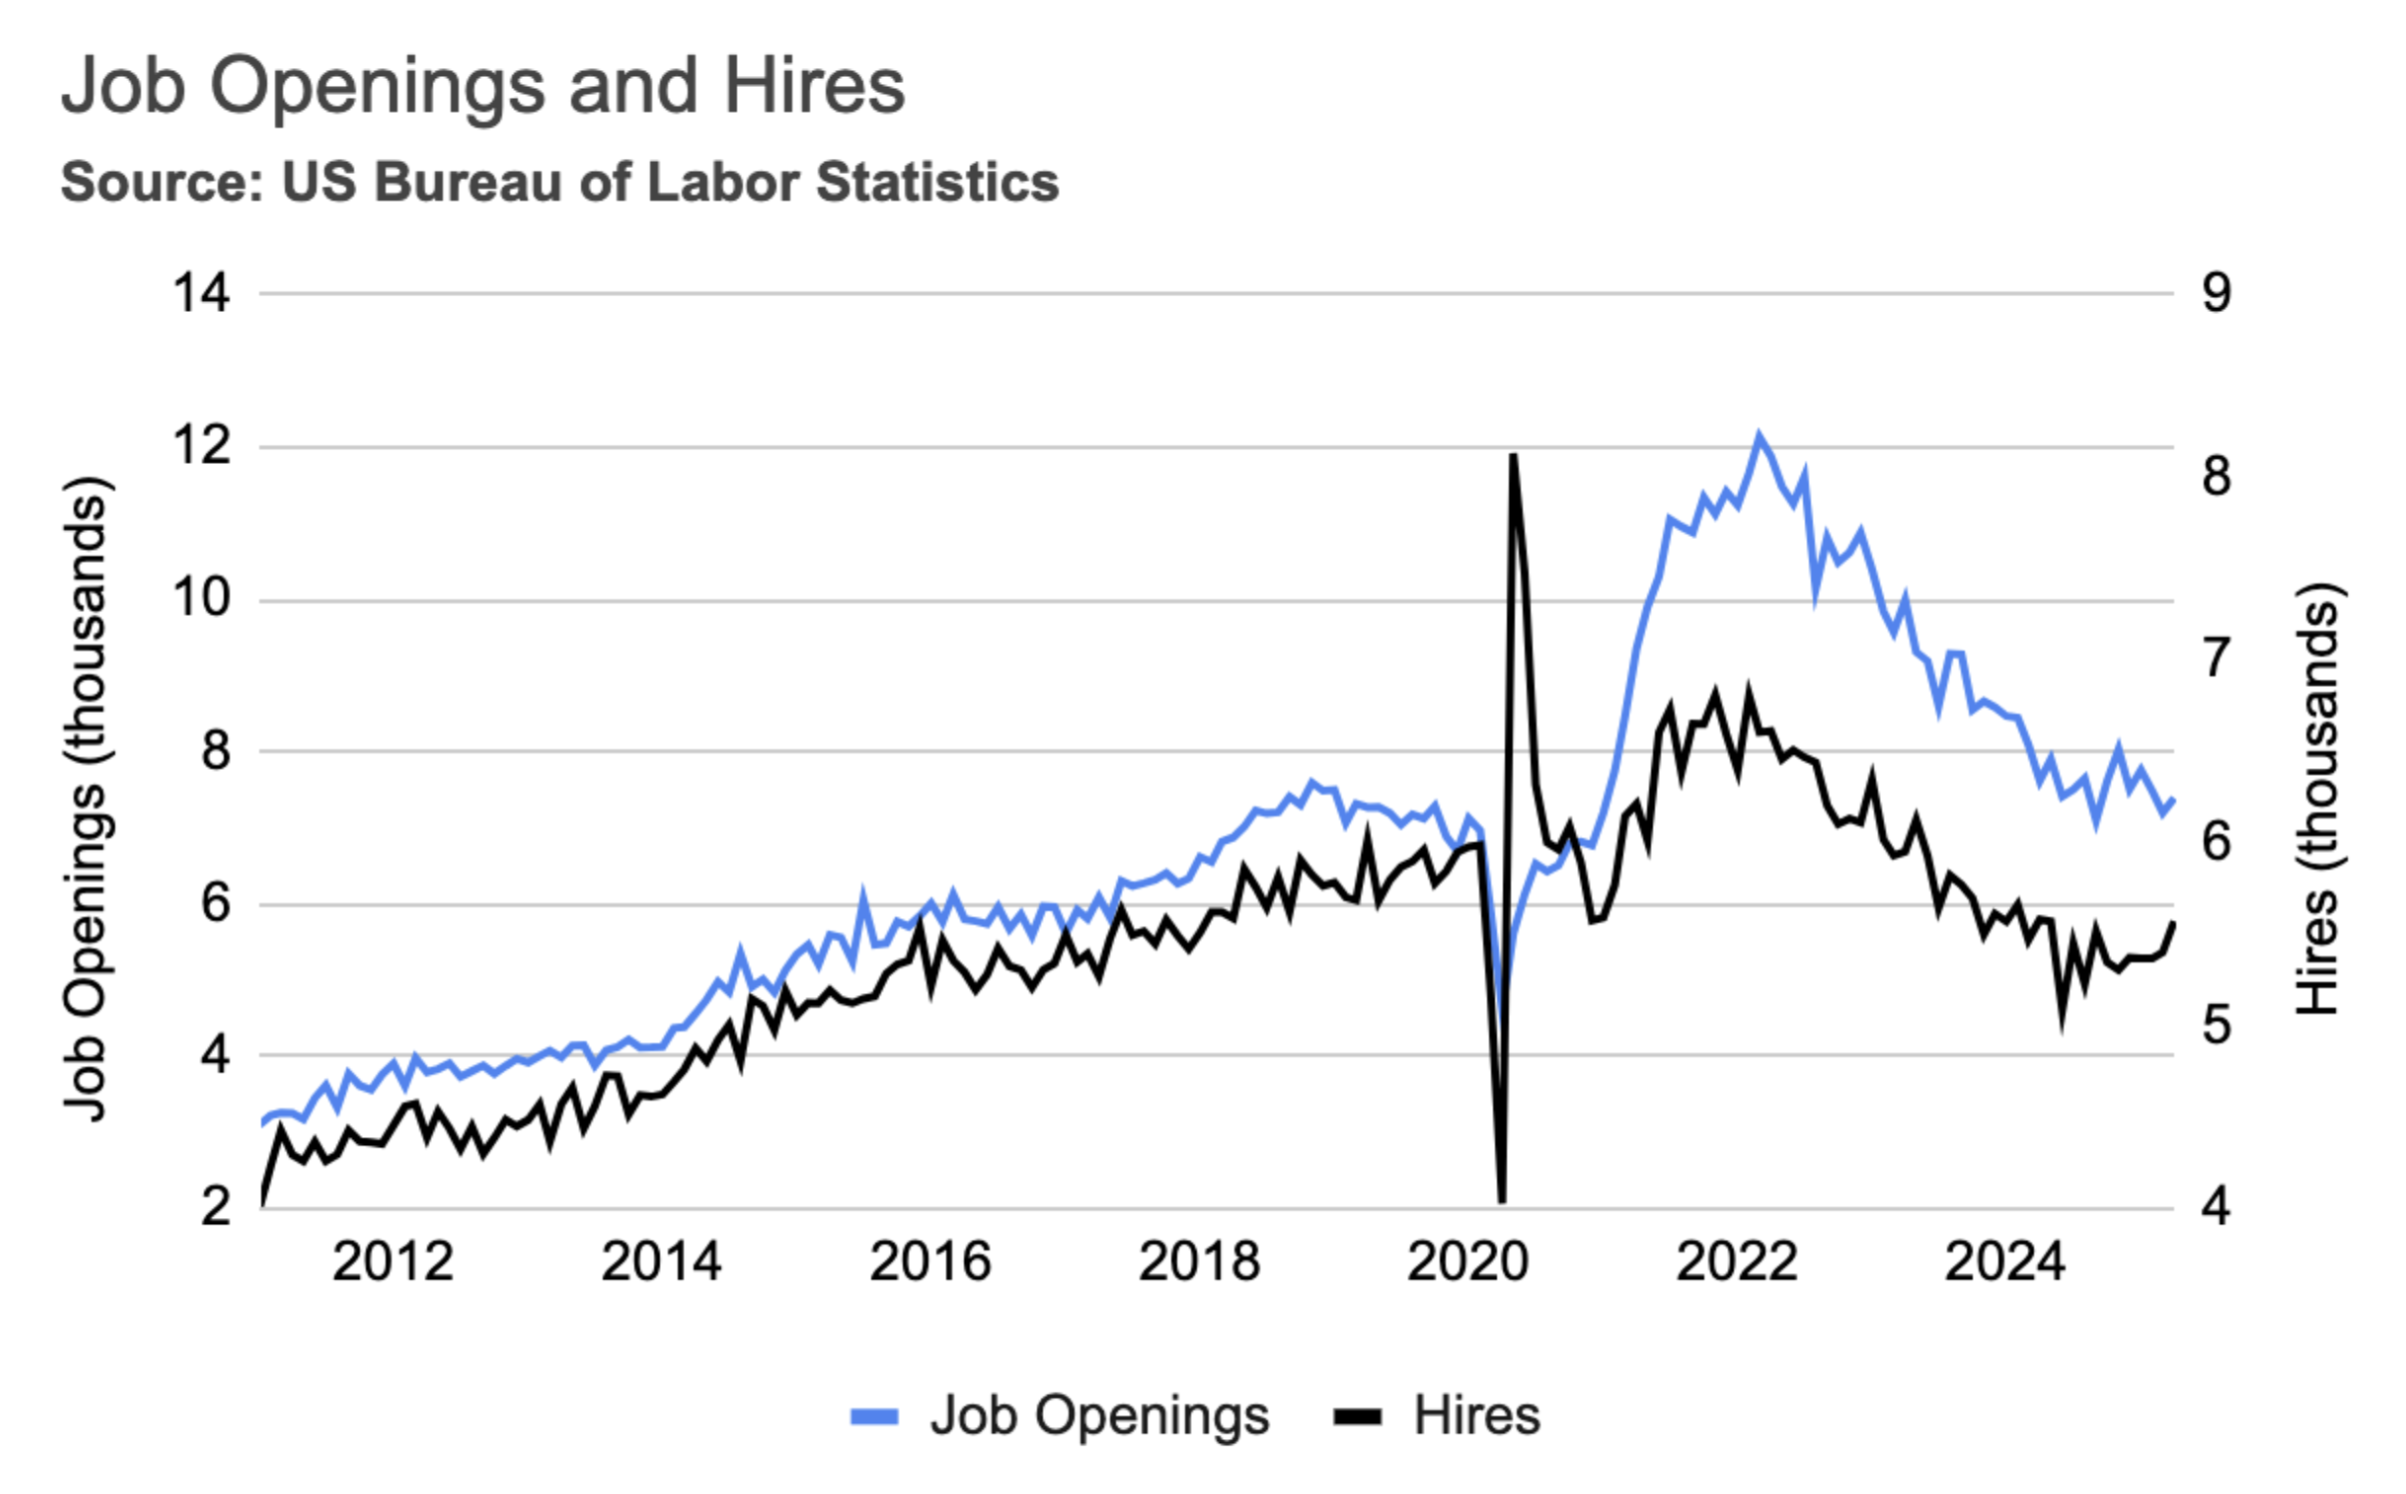
Despite rising inflation, the labor market continued to show signs of softening.
The government shutdown has created a data blackout, delaying official economic reports vital for our analysis and forecasting. In the absence of federal data, the ADP National Employment Report stood out, showing that private sector employment fell by 32,000 in September, signaling continued weakness in the U.S. labor market. Adding to the concerns about labor market softness, in August, Job Hires fell 2.2% m/m and were down 2.0% y/y, to their second lowest level since April 2020.

Labor market


While high mortgage rates are undoubtedly delaying new home purchases, and tariffs may be impacting other large-ticket items, weak demand likely indicates consumers are strategically delaying these purchases, waiting for mortgage rates to fall and the tariff dust to settle. And despite consumer borrowing reaching an all-time high, consumers remain capable of managing their debts. This is evidenced by historically low delinquency rates and the ratio of debt service payments to income, which is also at historically low levels.

Class 8 tractor orders
in September saw a
44% year-over-year decrease.
This trend is also apparent in the manufacturing sector. The Fed's manufacturing output index increased by 0.9% year-over-year, nearly reaching its 2022 cycle peak. However, while output grew in non-freight generating sectors like Computer and Electronic Products (+6.7% y/y, including semi-conductors) and Pharmaceuticals and Medicine (+6% y/y), it stagnated or declined in key freight-generating sectors such as Food and Beverage (+0.2% y/y), Paper (-0.8% y/y), Plastics and Rubber Products (-3.9% y/y), Furniture (-1.6% y/y), and Electrical Equipment and Appliances (-5.7% y/y).
Short-term Outlook
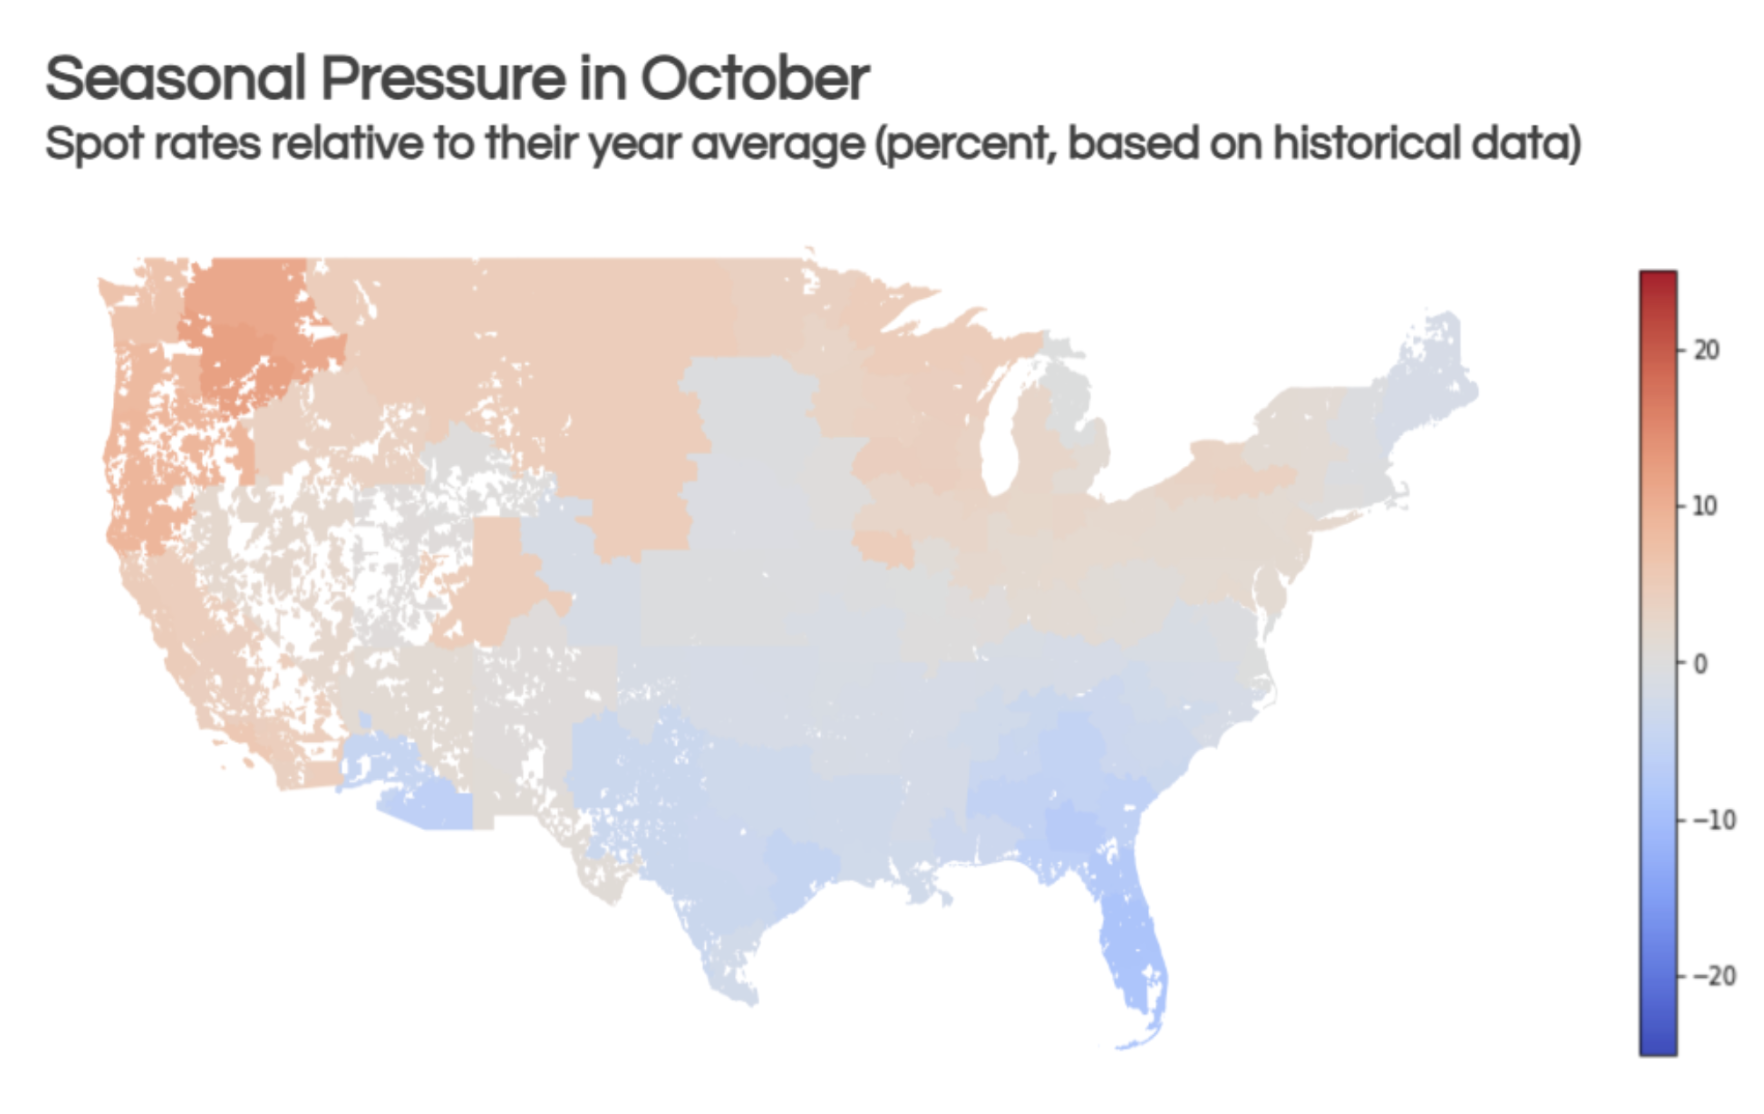
In October, as produce volumes fall in Southern markets, activity rises in Northern markets due to prestocking ahead of peak season. This divergence means that while markets in the West and Pacific Northwest are tightening, those in the Southeast and South regions are softening. The Pacific Northwest usually sees increased activity due to imports and Christmas tree shipments.
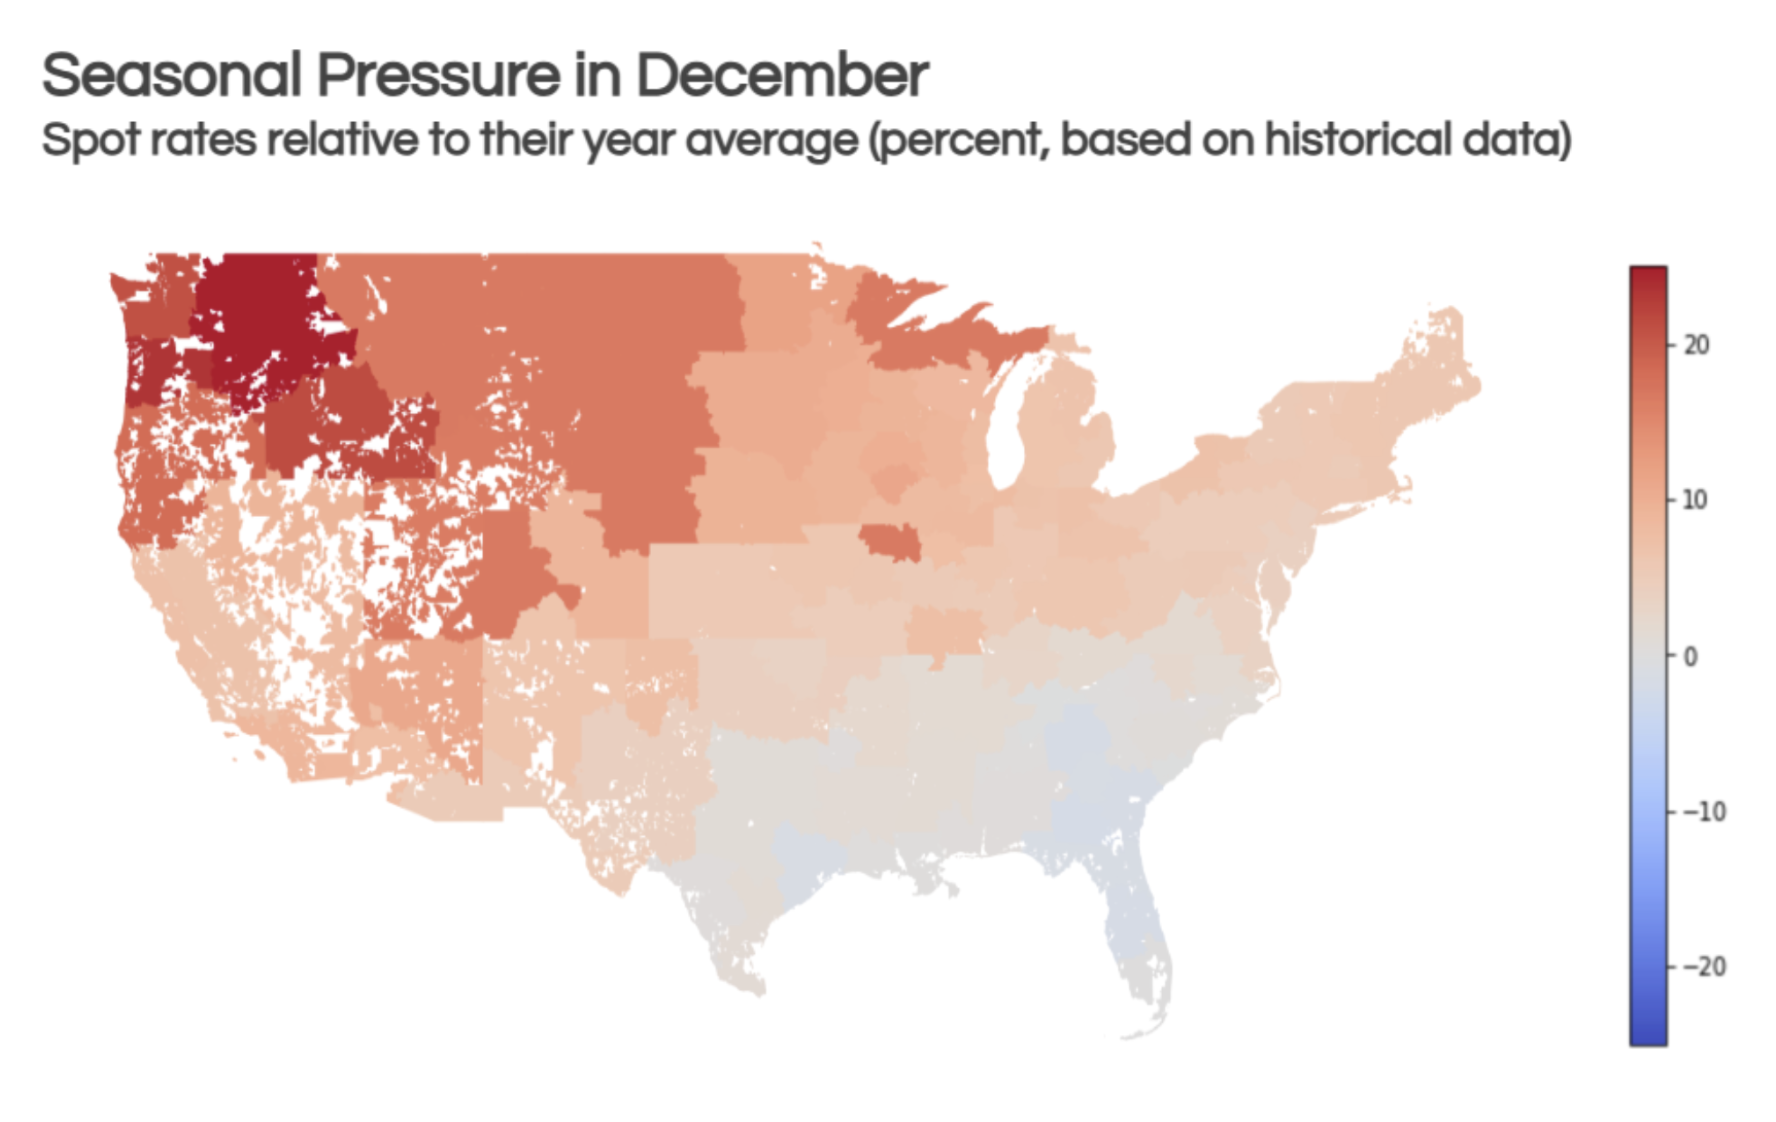
By December, the market tightens significantly across most regions, with the exception of the Southeast. Typically, spot rates in December are 5% higher than their yearly average. The Pacific Northwest is expected to experience the most severe tightness, with some markets seeing increases exceeding 20%.
Shipper and carrier insights
The Freight Recession: Why consumer strength is not to blame
Consumer spending has shown remarkable resilience in the past two years, proving to be a key bright spot in the economy. In August, real consumer spending on goods increased by 0.7%, marking a 4.2% rise from the previous year. This indicates an increase in the volume of goods purchased, rather than just a reflection of higher prices, as it is an inflation-adjusted figure.
Both durable and non-durable goods saw strong performance. Spending on durables grew by 0.9% in August and was up 5.2% year-over-year. Non-durables also demonstrated strength, with a 0.5% increase in August and a 3.7% rise compared to the same period last year. Goods spending has outpaced services, where spending only saw a 2.1% increase year-over-year.
While high mortgage rates are undoubtedly delaying new home purchases, and tariffs may be impacting other large-ticket items, weak demand likely indicates consumers are strategically delaying these purchases, waiting for mortgage rates to fall and the tariff dust to settle. And despite consumer borrowing reaching an all-time high, consumers remain capable of managing their debts. This is evidenced by historically low delinquency rates and the ratio of debt service payments to income, which is also at historically low levels.

Consumer spending remains strong, yet freight demand is weak. This is due to a shift in consumer priorities towards high-cost, low-volume goods like electronics and pharmaceuticals, rather than freight-intensive items such as food and beverages, motor vehicles, and home furnishings. Specifically, real spending on food and beverages has not returned to 2022 pre-pandemic levels. High interest rates have also curbed purchases of large items like vehicles, furniture, and appliances, which typically correlate with new home sales, also impacted by elevated mortgage rates.
This trend is also apparent in the manufacturing sector. The Fed's manufacturing output index increased by 0.9% year-over-year, nearly reaching its 2022 cycle peak. However, while output grew in non-freight generating sectors like Computer and Electronic Products (+6.7% y/y, including semi-conductors) and Pharmaceuticals and Medicine (+6% y/y), it stagnated or declined in key freight-generating sectors such as Food and Beverage (+0.2% y/y), Paper (-0.8% y/y), Plastics and Rubber Products (-3.9% y/y), Furniture (-1.6% y/y), and Electrical Equipment and Appliances (-5.7% y/y).
Short-term Outlook
In October, as produce volumes fall in Southern markets, activity rises in Northern markets due to prestocking ahead of peak season. This divergence means that while markets in the West and Pacific Northwest are tightening, those in the Southeast and South regions are softening. The Pacific Northwest usually sees increased activity due to imports and Christmas tree shipments.
By December, the market tightens significantly across most regions, with the exception of the Southeast. Typically, spot rates in December are 5% higher than their yearly average. The Pacific Northwest is expected to experience the most severe tightness, with some markets seeing increases exceeding 20%.
Consumer spending remains strong, yet freight demand is weak. This is due to a shift in consumer priorities towards high-cost, low-volume goods like electronics and pharmaceuticals, rather than freight-intensive items such as food and beverages, motor vehicles, and home furnishings. Specifically, real spending on food and beverages has not returned to 2022 pre-pandemic levels. High interest rates have also curbed purchases of large items like vehicles, furniture, and appliances, which typically correlate with new home sales, also impacted by elevated mortgage rates.
Effective tariff rates have hit 16.7% in September, a level not seen since 1936.