


Share this article


Caption 03:
Lorem tore v
eri tatis et quasi archi te cto be.

Caption 02:
Lorem tore v
eri tatis et quasi archi te cto be.
Employees who perceive value in the benefits offered to them are more likely to be engaged and report higher satisfaction with their benefits and employer.


EMPLOYEEs Focus on Perceived Value
Plans Offered by Type
Total Employee Costs
EMPLOYERS FOCUS ON COSTS
Employers who understand how their benefits compare to organizations like theirs can make strategic decisions that cut costs — without sacrificing plan richness or increasing employee contributions.
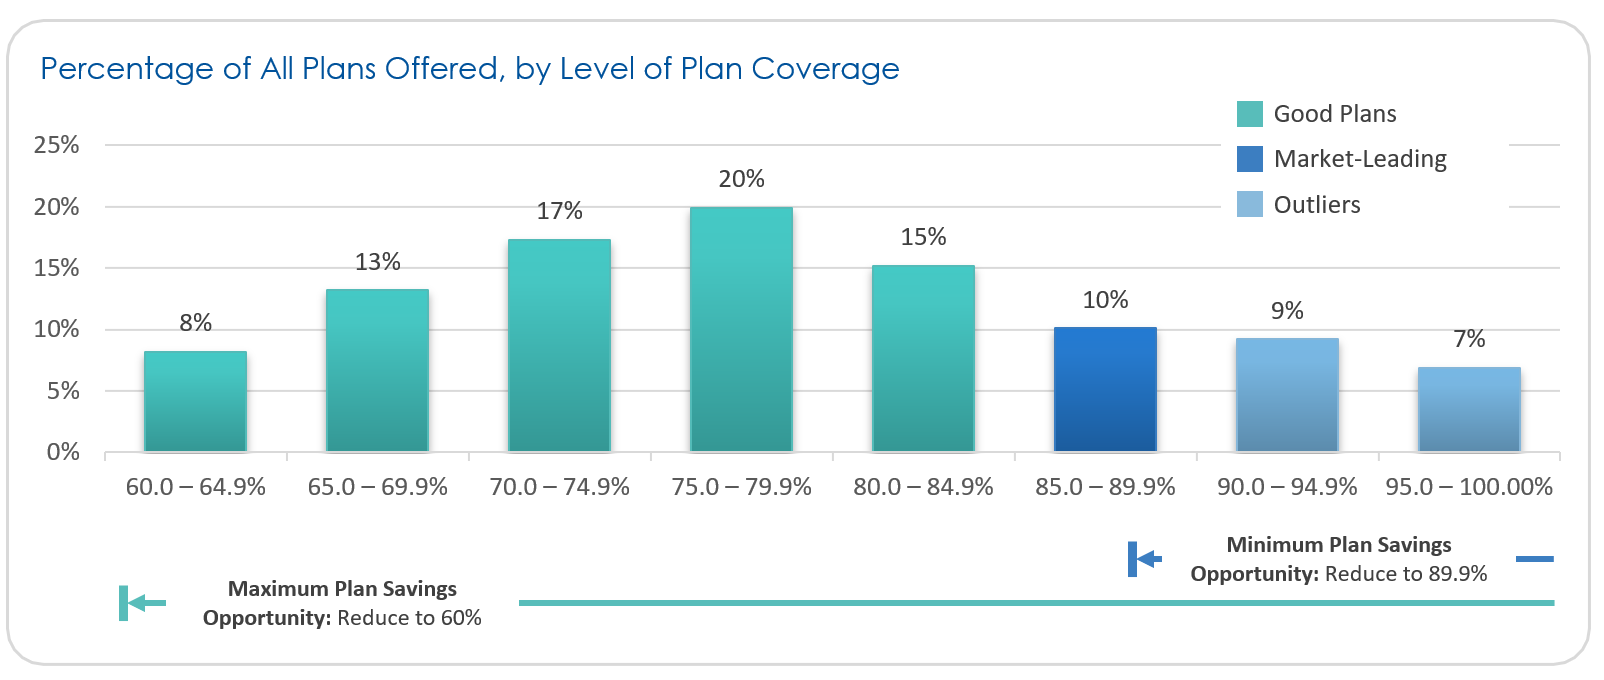
Market-Leading Plans
Many employers want to offer market-leading plans without being an outlier — only 10% of plans offered fall within the market-leading range, with an actuarial value (AV) between 85% and 90%.
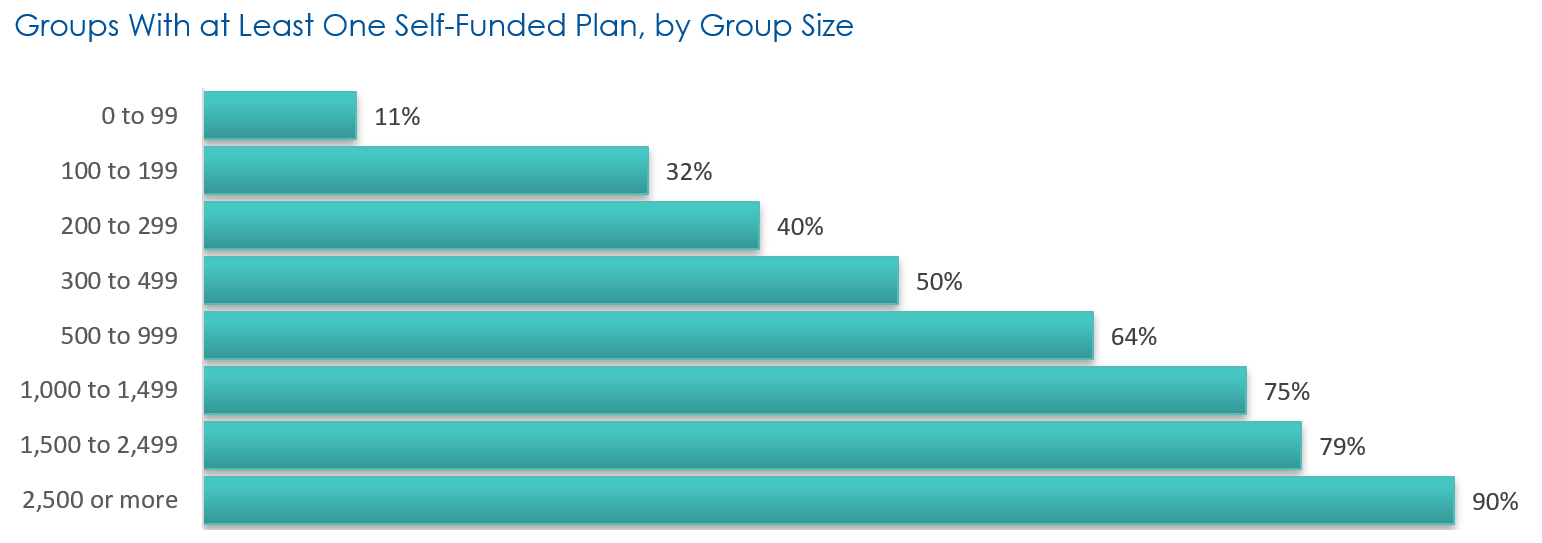
While the majority of employers in the 500 to 2,500+ employee group range offer at least one self-funded plan, smaller organizations have also found success self-funding their plans.
Funding Strategies
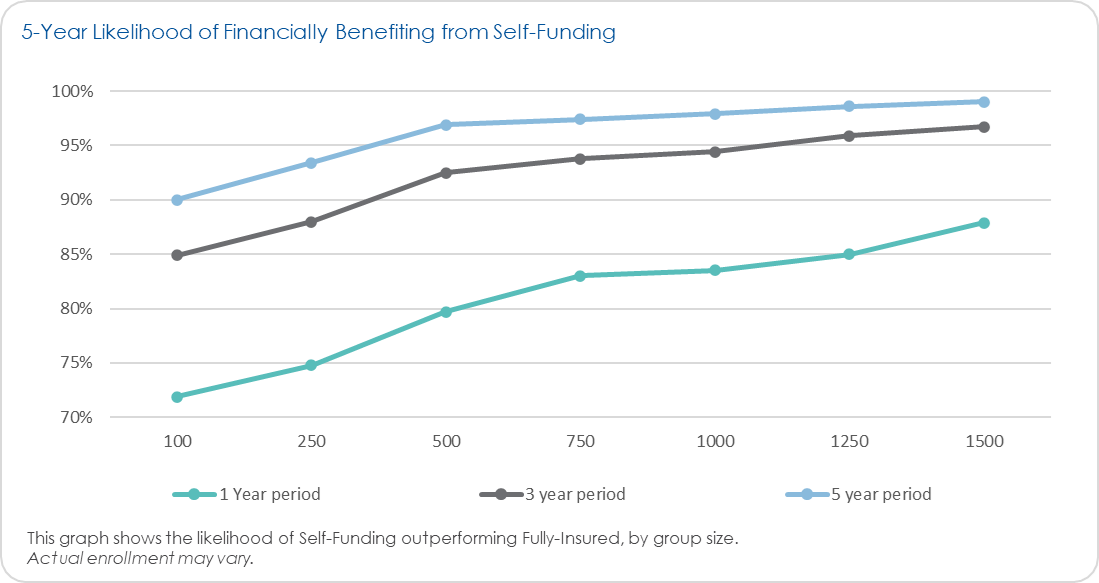
Self-Funding Savings
Funding Strategies
Likelihood of Savings�with Self-Funding
Small changes could drive significant savings! Here are five recommended action steps to optimize your plan design:


Help employees choose the plan with the best overall value by:��
Offering a range of plan options
Adjusting plan richness
Adjusting employee contributions
Balance Plan Engagement


Increase or decrease plan richness to offer plans that are market-leading, but not outliers on coverage and cost.
2. Offer Market-Leading Plans
Level-funded and partially self-funded plans can provide employer savings without changing the plan’s perceived value.
3. Consider Alternative Funding
Consider expanding family leave and offering financial wellness or population health resources to help increase your competitive edge.
4. Offer More Benefits
Explore solutions designed to better manage pharmacy benefits and reduce the impact of cost drivers.
5. Optimize Pharmacy Spending
Interested in learning more about what's trending in your industry?
While payroll contributions can heavily influence employees’ perceptions of the value of your plan offerings, adding in point-of-service costs — such as copays and medical claims — provides a more complete picture. Traditional plans cover more, but total costs are only marginally higher than QHDHP plans that cover less.
Regional/�Performance
QHDHP
88%
Traditional�PPO
“USI’s benchmarking data showed that we were providing health benefits that were richer than other employers in our local area. We made changes to align our benefits with other organizations and were able to lower our annual costs.”
— USI employee benefits client
lorem ipsum dolor sit amet, consectetur adipiscing elit, sed do eiusmod tempor incididunt ut labore et dolore magna aliqua. Ut enim ad minim.
Lorem ipsum dolor sit amet sed do
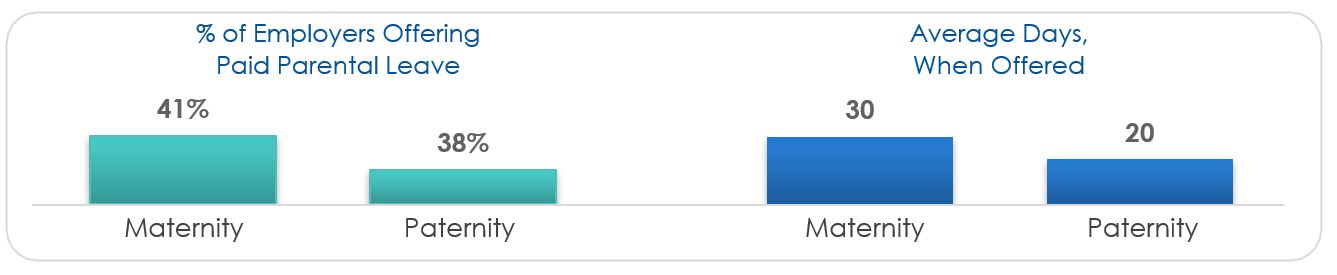
Family
Leave
CLOSE
CLOSE
CLOSE
lorem ipsum dolor sit amet, consectetur adipiscing elit, sed do eiusmod tempor incididunt ut labore et dolore magna aliqua. Ut enim ad minim.
Lorem ipsum dolor sit amet sed do
Financial�Well-Being
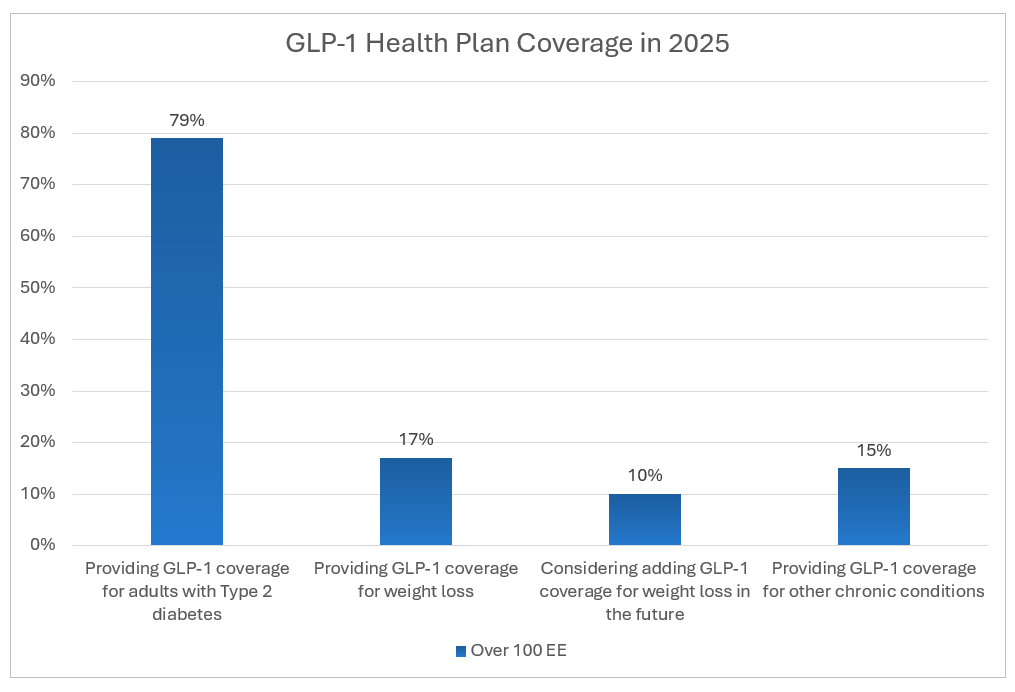
GLP-1�Coverage
Trend Charts
Click the tiles below to explore the latest trends in these key benefit areas.


of groups offer�this type of plan
of groups offer�this type of plan
61%
of groups offer�this type of plan
19%

Increased demand for GLP-1 medications to treat Type 2 diabetes and promote weight loss will continue to drive up pharmacy costs for employers. Employers should explore strategies such as prior authorization and higher cost-sharing to better manage these expenses.
With more states mandating maternity leave benefits, the number of employers offering this benefit nationally is likely to grow. Offering parental leave benefits, especially in states that don't mandate maternity leave, can be a way to add value for growing families.
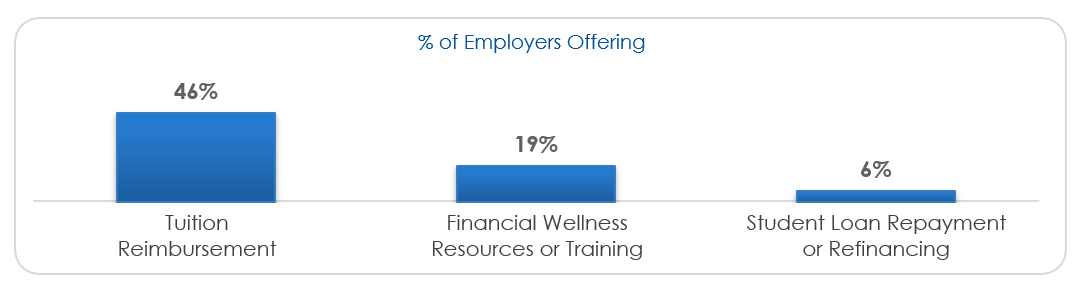
Many employers recognize the value of providing financial wellness benefits, such as resources and training, tuition reimbursement, and student loan repayment.
With 48% of employees citing financial concerns as the cause of lower mental health, and 23% stating that financial stress impacts their ability to focus and be productive at work, providing resources in these areas can help improve health outcomes while reducing absenteeism.
RECOMMENDED ACTION STEPS
While the majority of employers in the 500 to 2,500+ employee group range offer at least one self-funded plan, smaller organizations have also found success self-funding their plans.
Funding Strategies
Self-Funding Savings
QHDHP
$583
$723
$1,306 Total Cost
Traditional
$819
$520
Monthly employee contribution rate
Avg monthly employee cost of healthcare
$1,339 Total Cost
Regional/�Performance
$626
$425
$1,051 Total Cost
Monthly employee contribution rate
Monthly point-of-service cost
QHDHP
$108
$252
$360 Total Cost
Traditional
$167
$190
$357 Total Cost
Monthly employee contribution rate
Avg monthly employee cost of healthcare
Regional/�Performance
$147
$89
$236 Total Cost
Monthly employee contribution rate
Avg monthly employee cost of healthcare
Monthly employee contribution rate
Monthly point-of-service cost
Family Coverage
Individual Coverage
USI's 2025 Benefits Benchmarking Study

Employers want to know if the benefit plans they offer are worth the investment. USI’s Benefits Benchmarking Study helps employers evaluate plan design and optimize spending with actionable recommendations — based on the experience of thousands of organizations like yours.

Access national benefits�benchmarking trends.
Family Leave
Financial Well-Being
GLP-1 Coverage
Hover over the circles to see how many employers offer these types of plans.
�
Download Report
The most common plan types offered are traditional PPO plans and qualified high-deductible health plans (QHDHP). Giving employees a range of options can help increase their satisfaction with the benefits offered to them.


Immersive Tech: How AR and VR are redefining engagement


Immersive Tech: How AR and VR are redefining engagement


Healthcare

Construction
Manufacturing
Unlock Insights
Unlock Insights
Unlock Insights
Unlock Insights
Unlock Insights
Education
Real Estate
Unlock Insights
Transportation
Access national benefits benchmarking trends
Download Report
