How to use VTS to power your prospecting and leasing process
The 15 min Demo

start

VIEW FULLSCREEN

1
3
4
2
1
% of requirements <10k sf nationwide


66%
68%
70%
71%
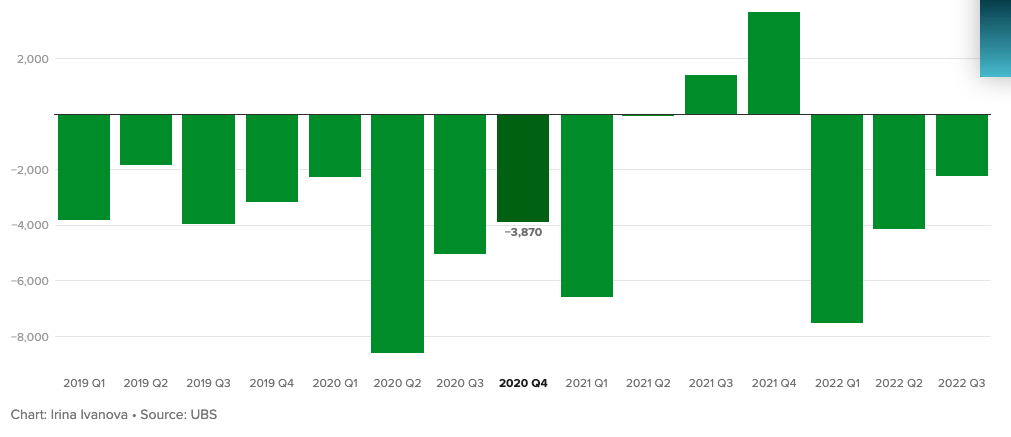
Year-over-year change in the number of retail stores nationwide
4,000
2,000
-2,000
-4,000
-6,000
-8,000
2019
Q1
Q2
Q3
Q4
Q1
Q2
Q3
Q4
Q1
Q2
Q3
Q1
Q2
Q3
Q4
2020
2021
2022
Chart: Irina Ivanova Source: UBS
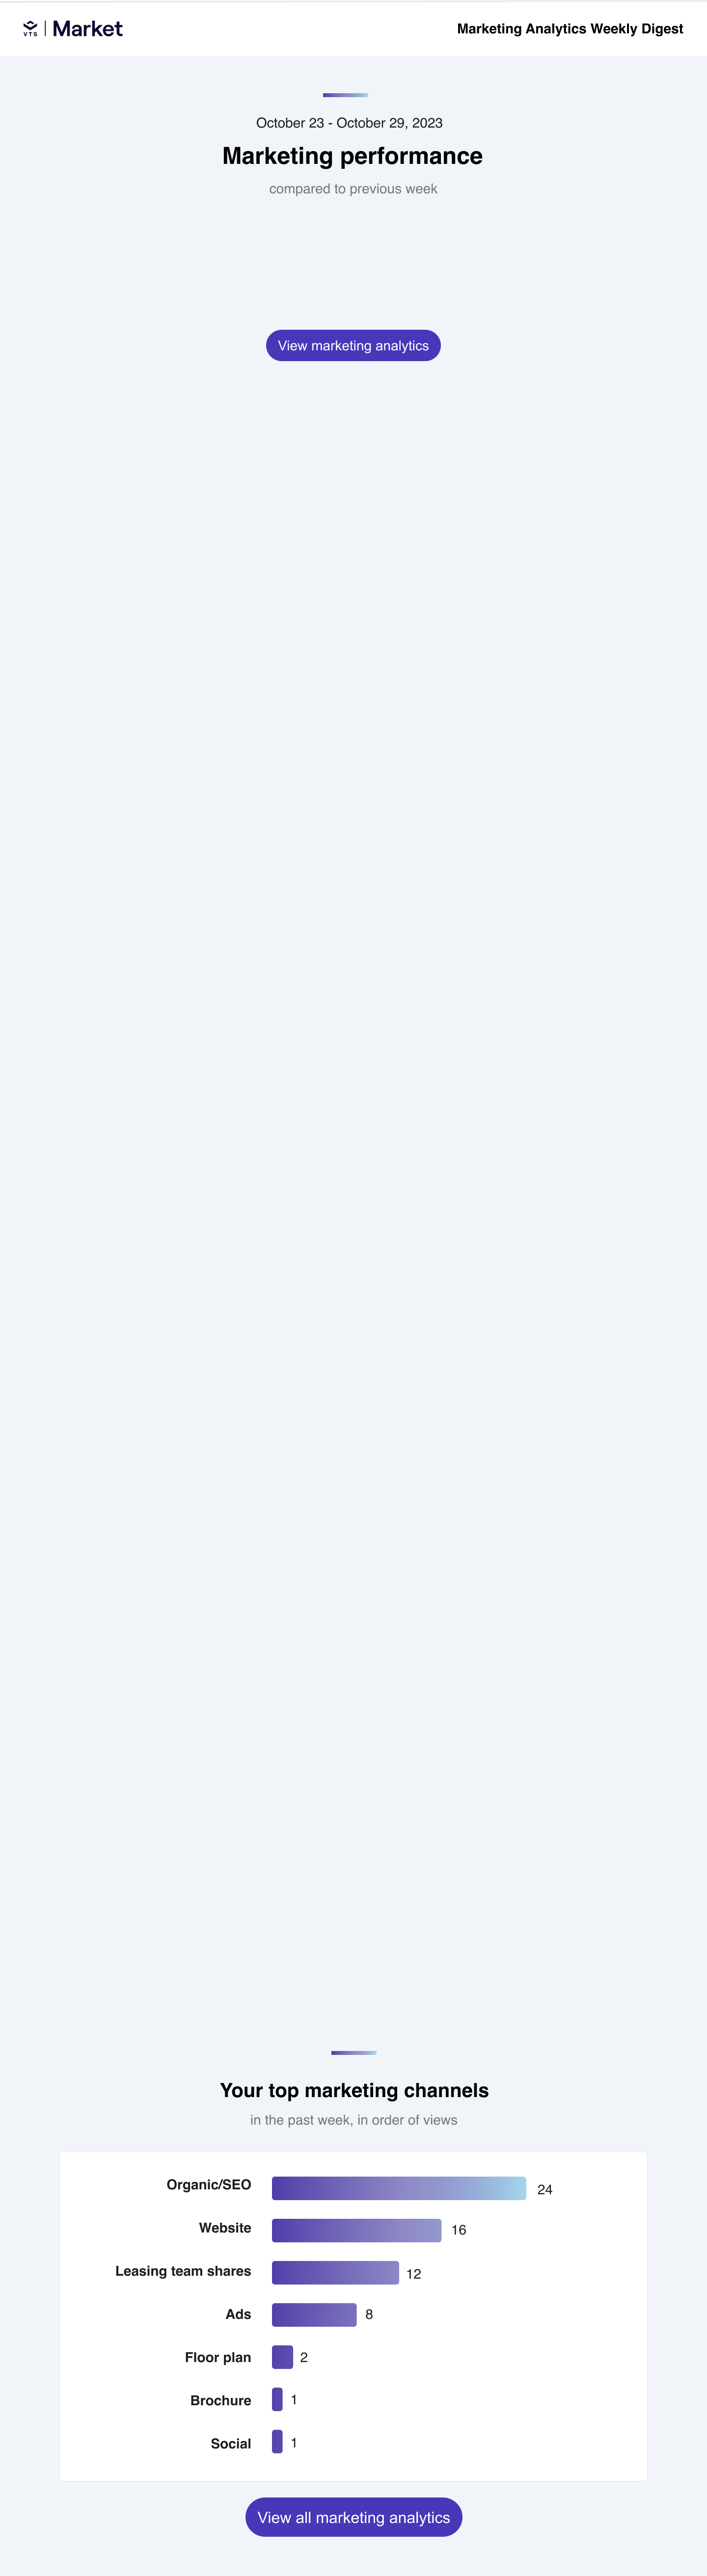
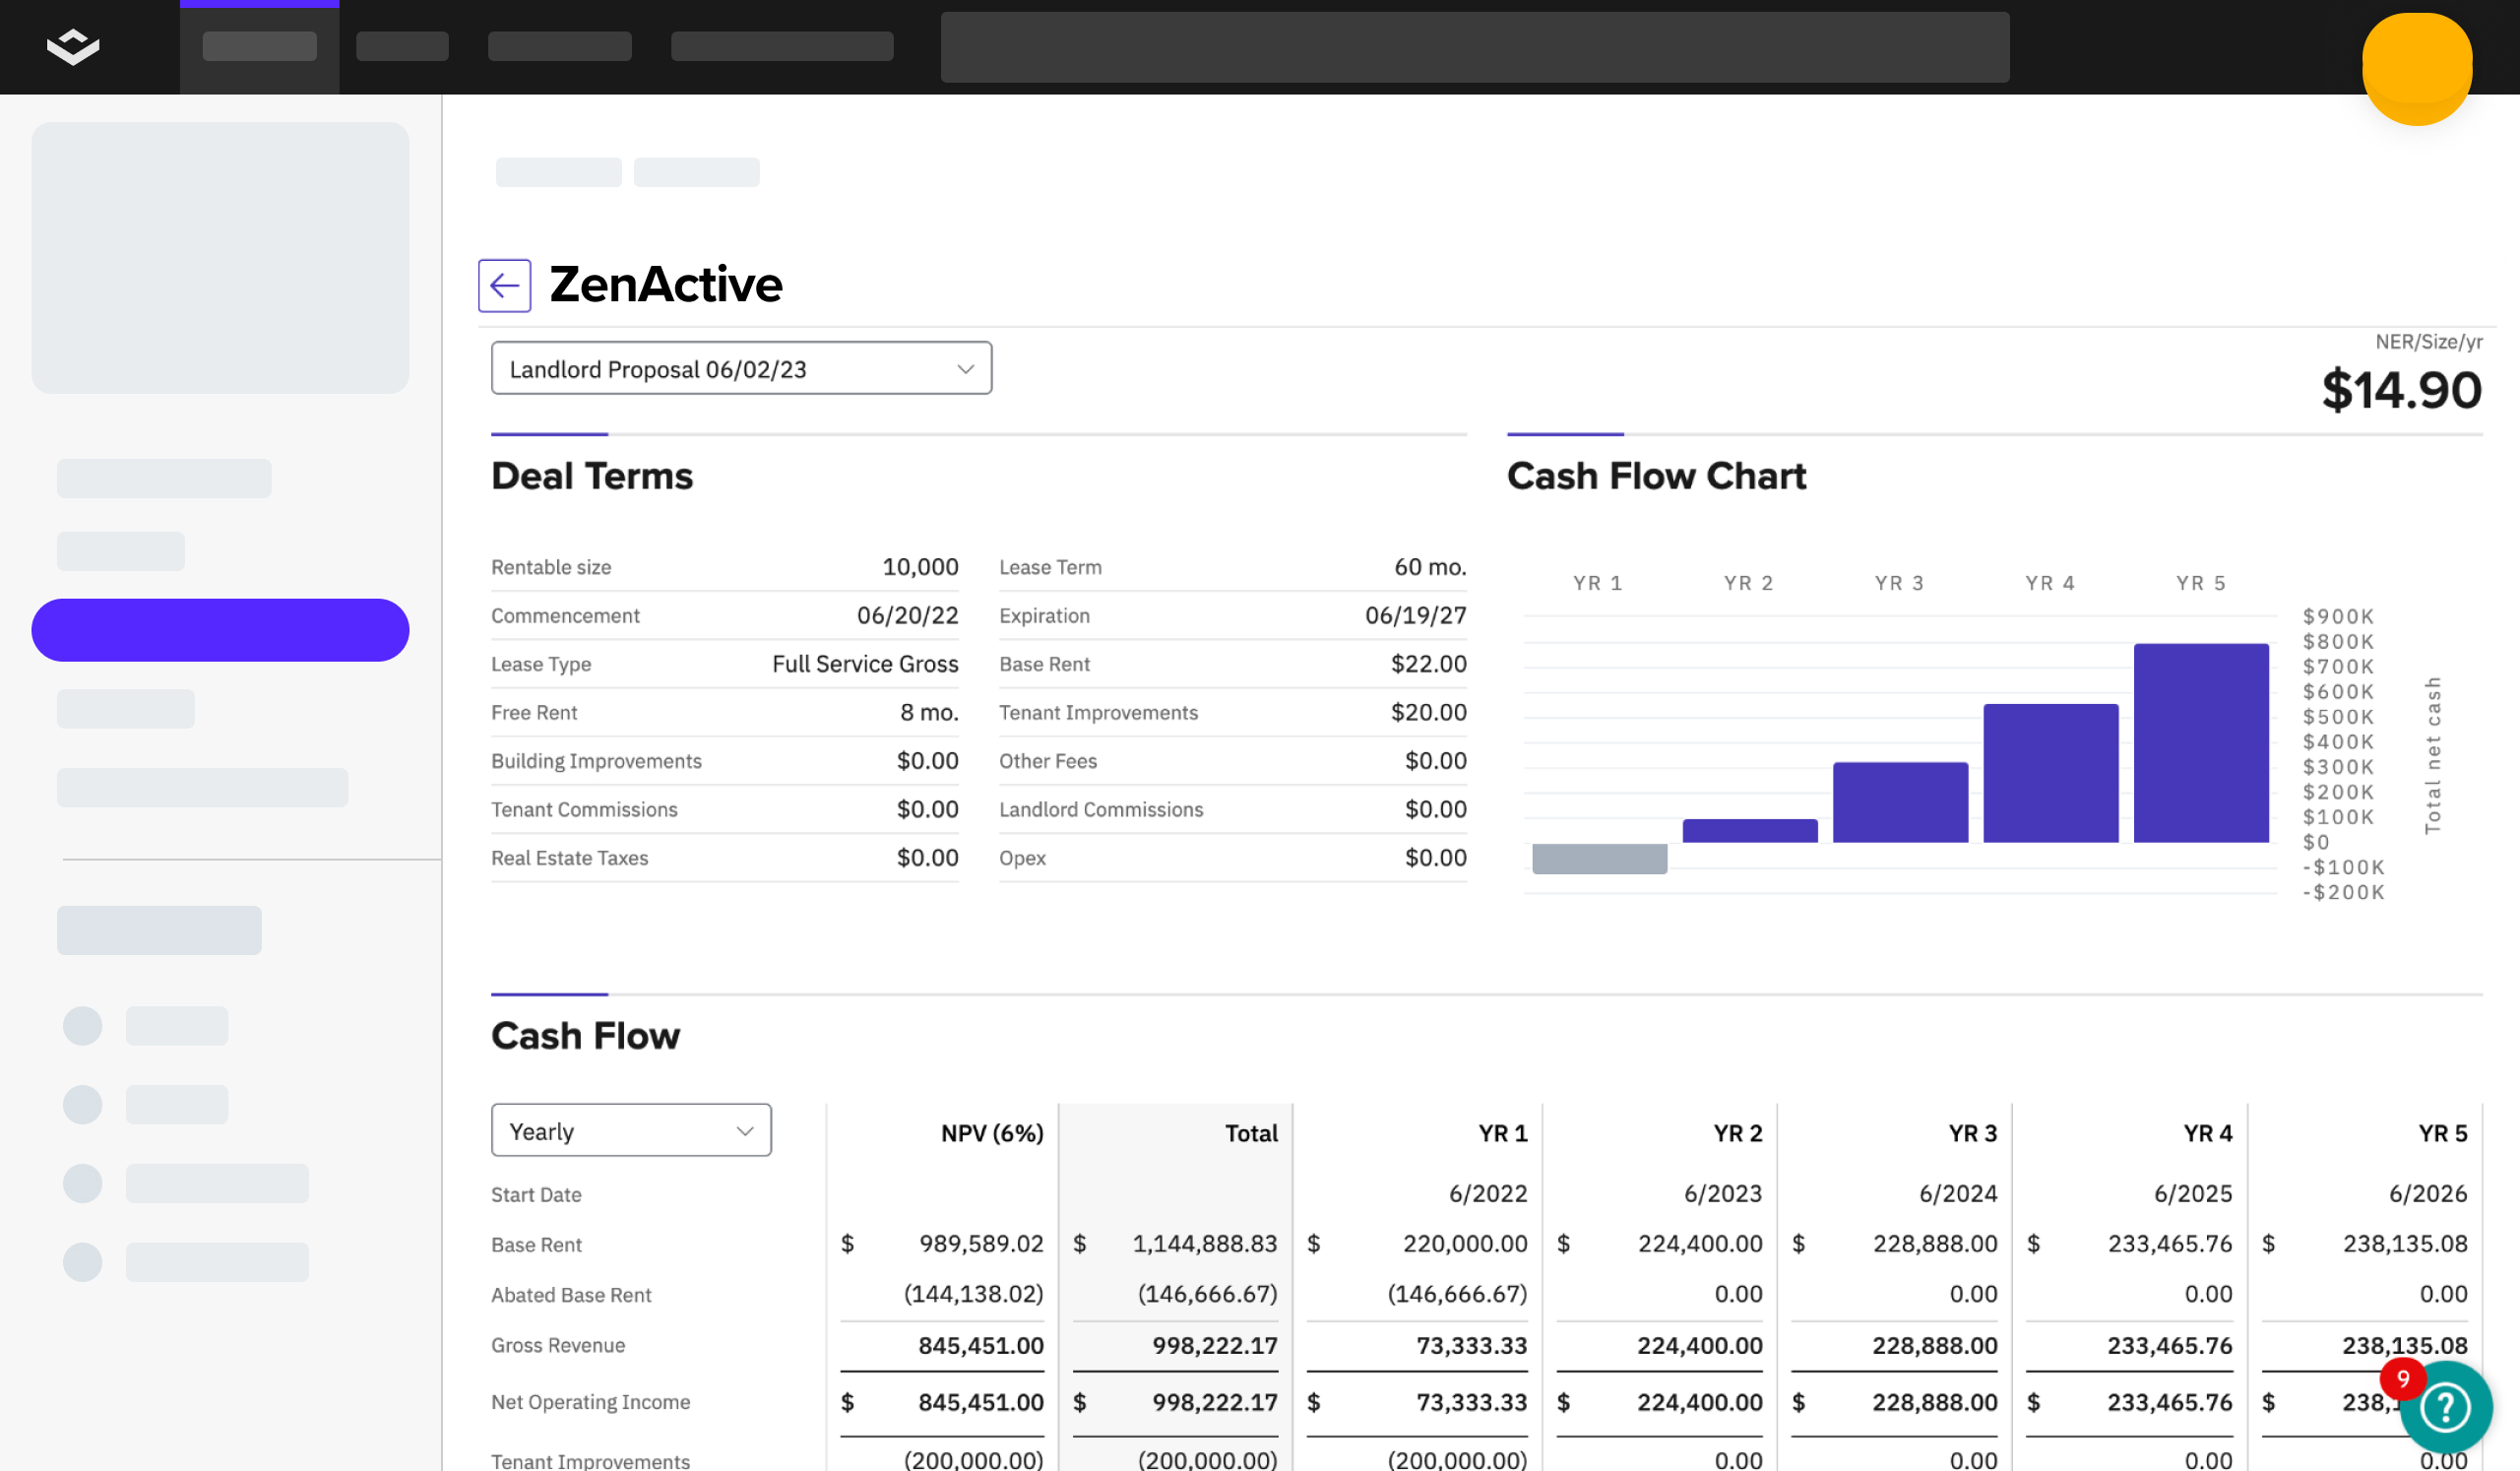
The retail market has continued to rebound, with average asking rents up 3.6% nationwide in the last 12 months.
State of the Market—Retail Tenant Behavior

NEXT

2


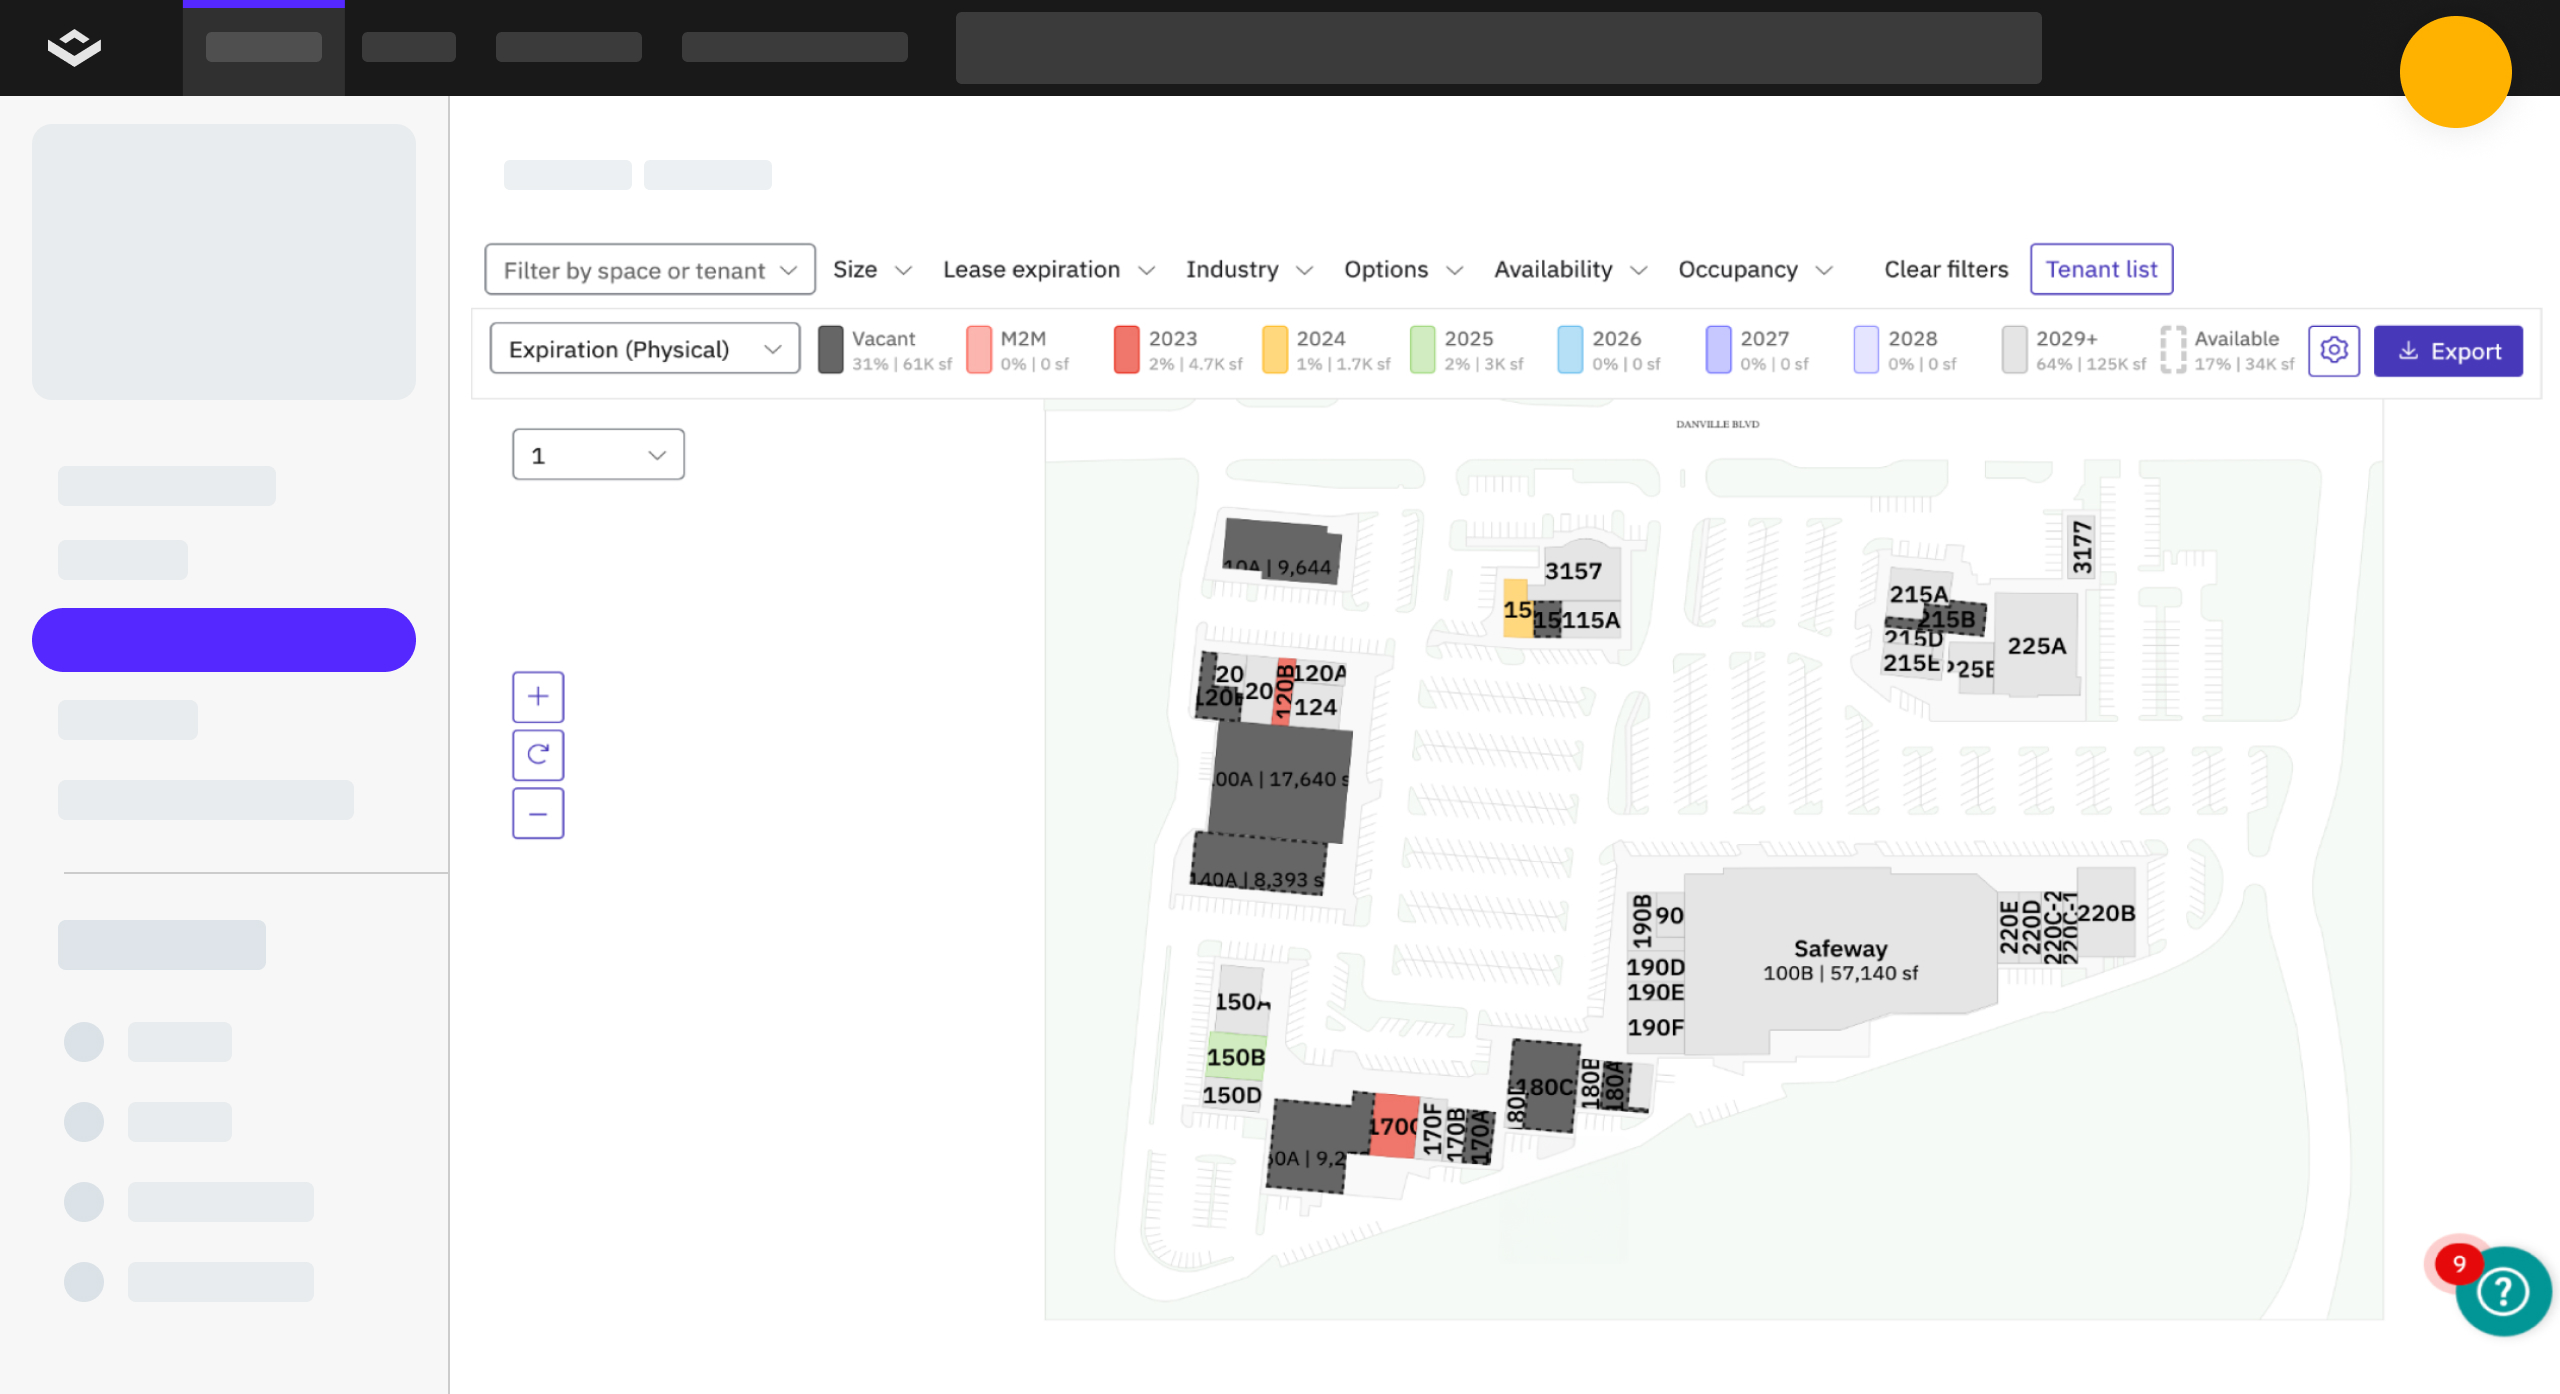
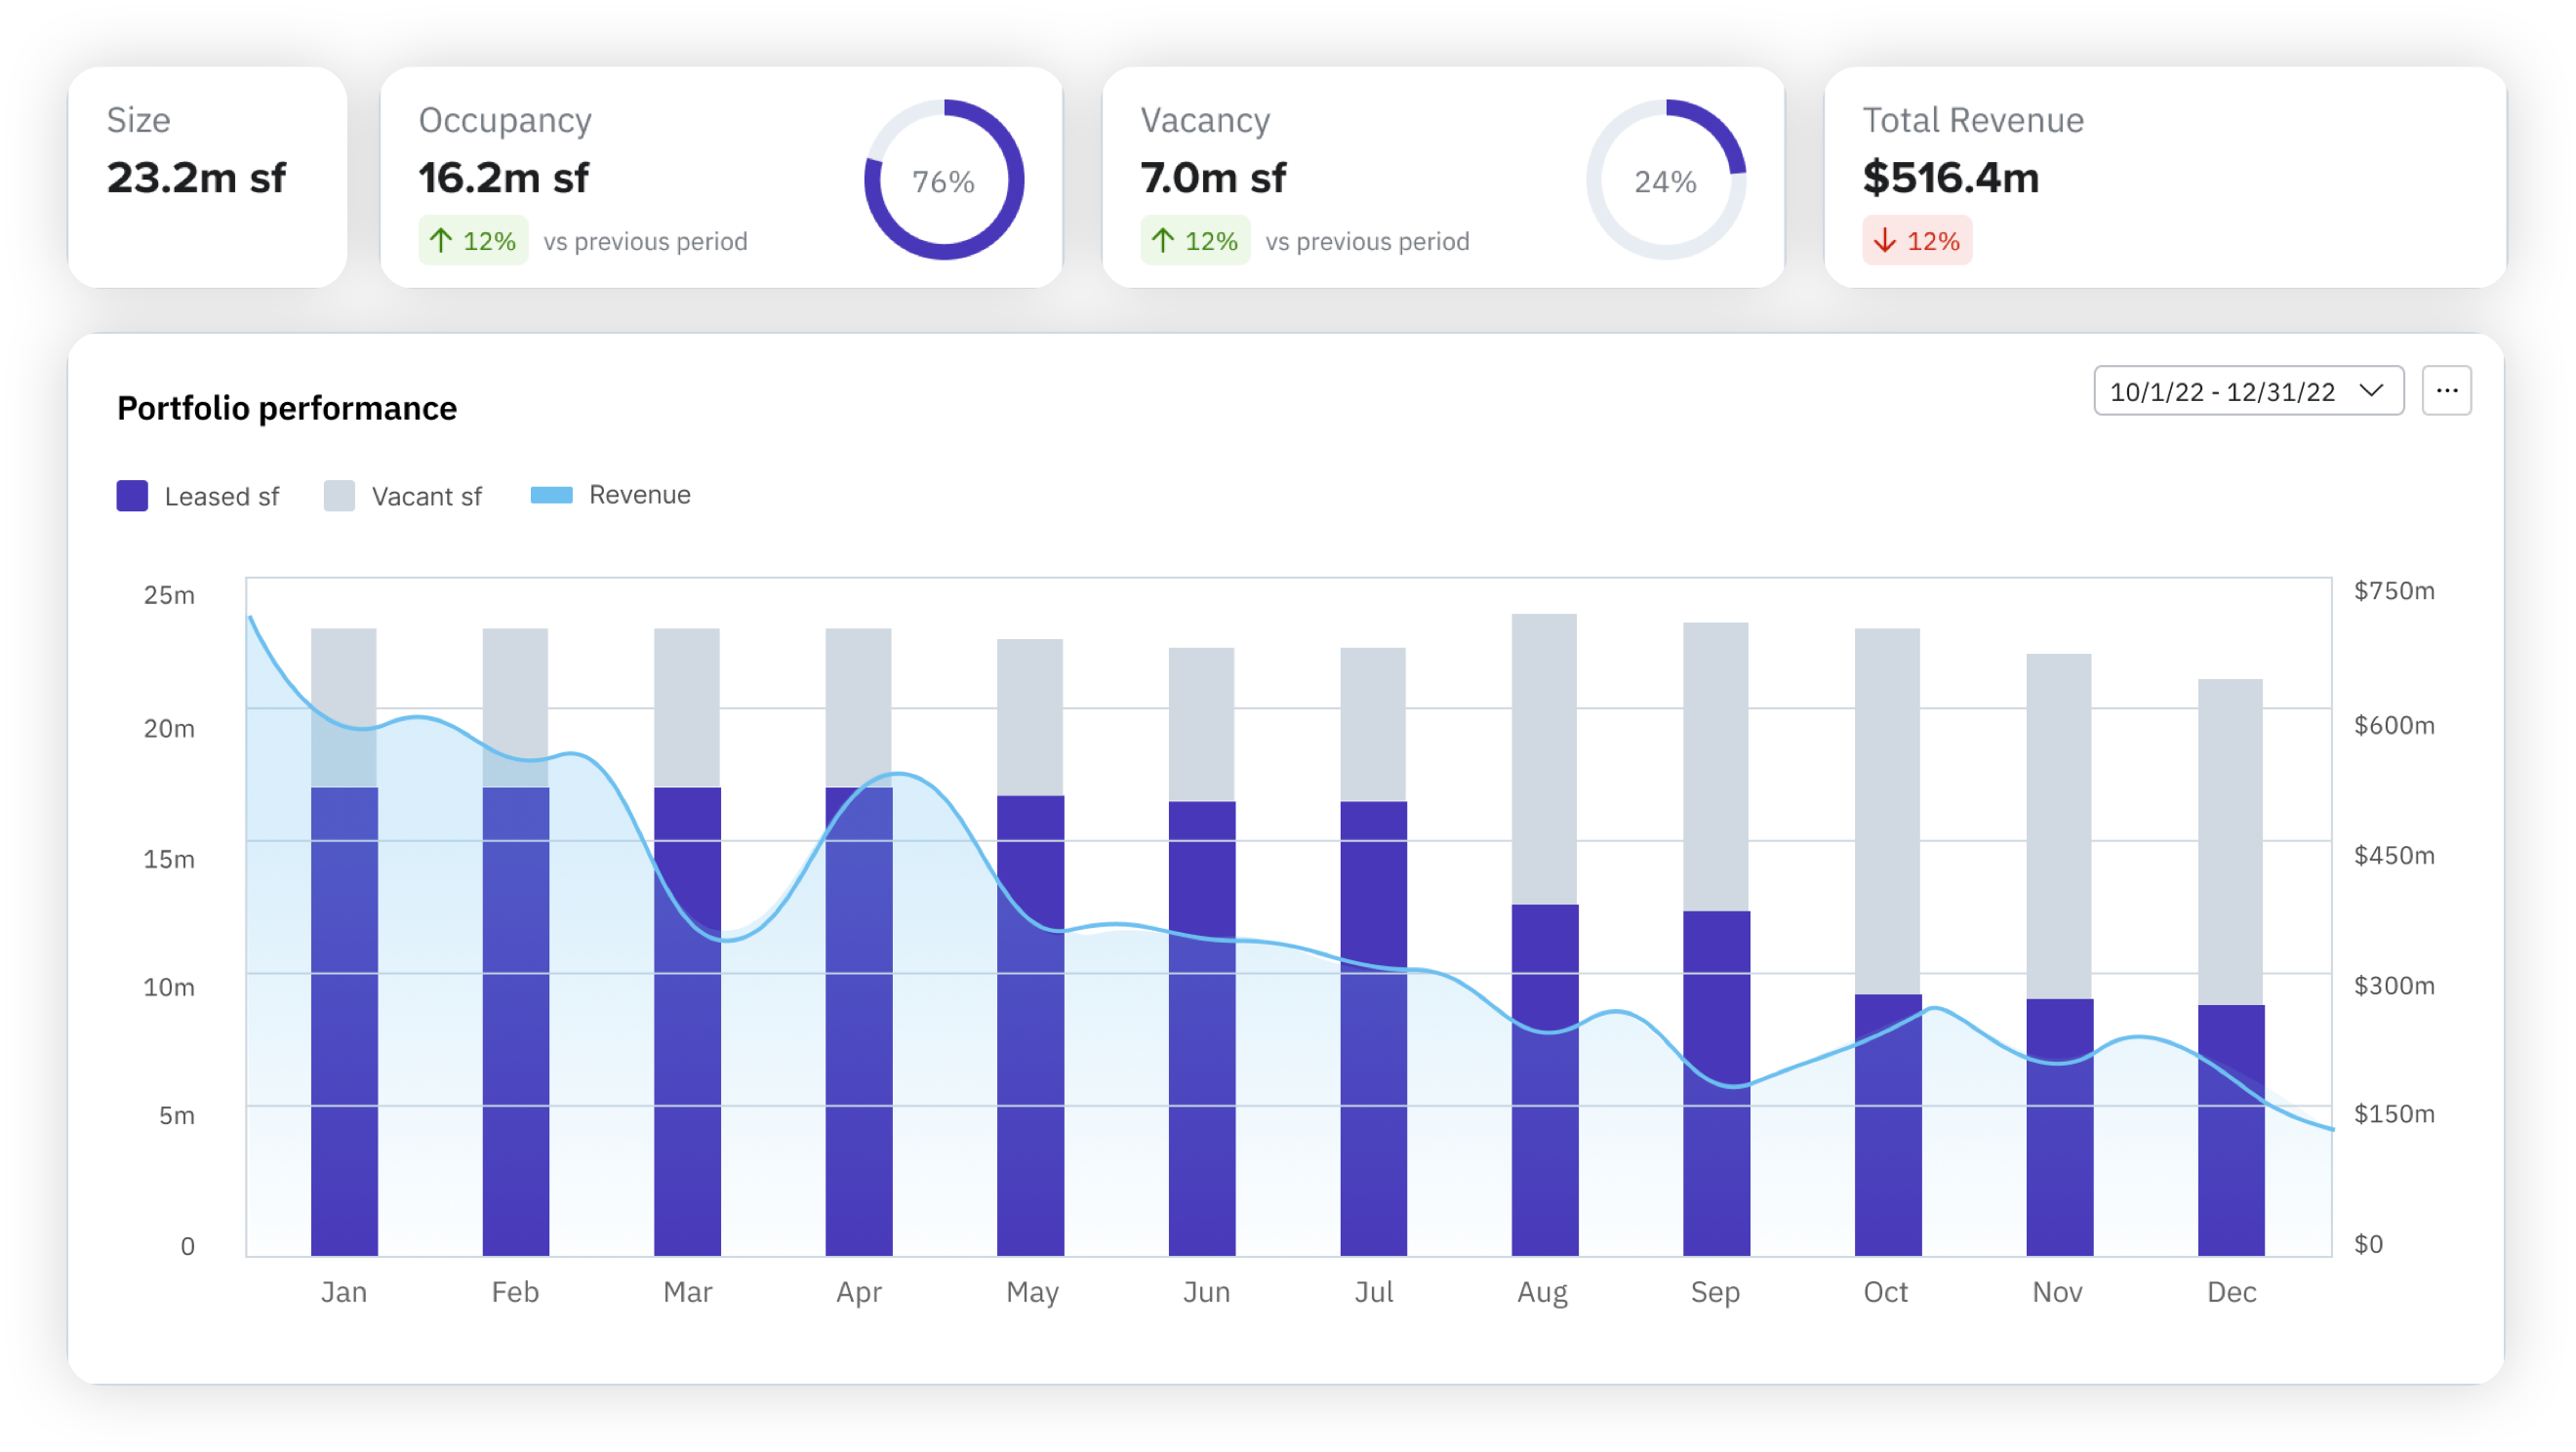
Across the country, there is a positive net absorption rate
of 66.6M sq ft.

NEXT
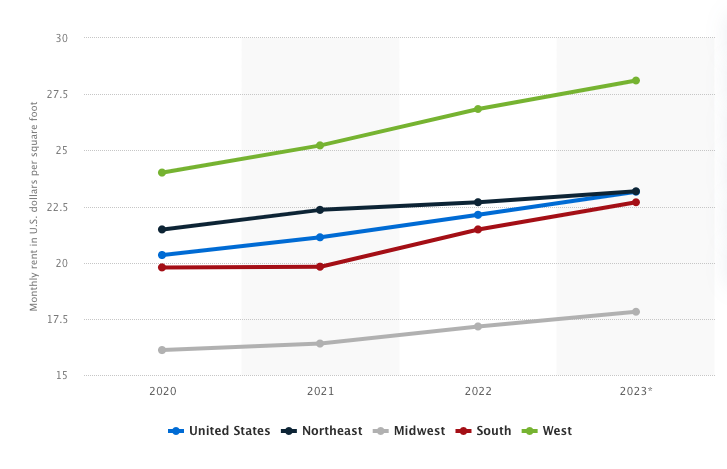
% Average monthly asking rent of shopping center real estate in United States from 2020 to 2023,
by region requirements
30
27.5
25
22.5
20
17.5
Monthly rent in U.S. dollars per square foot
15
2020
2021
2022
2023*
United States
Northeast
Midwest
South
West
Source: Statista
3


40%
of all tours are undisclosed tenants


60%
of people prefer shopping in person
Strip mall traffic has increased 18% compared to
pre-pandemic levels.

NEXT
4


Demand for the best spaces is fierce with many retailers becoming more selective about location, flexibility, size, etc.
State of the Market—Tenant Behavior

Searching online

Working with a tenant rep

Ready for an in-person tour

Debriefing after the tour

Evaluating deal terms


01
times
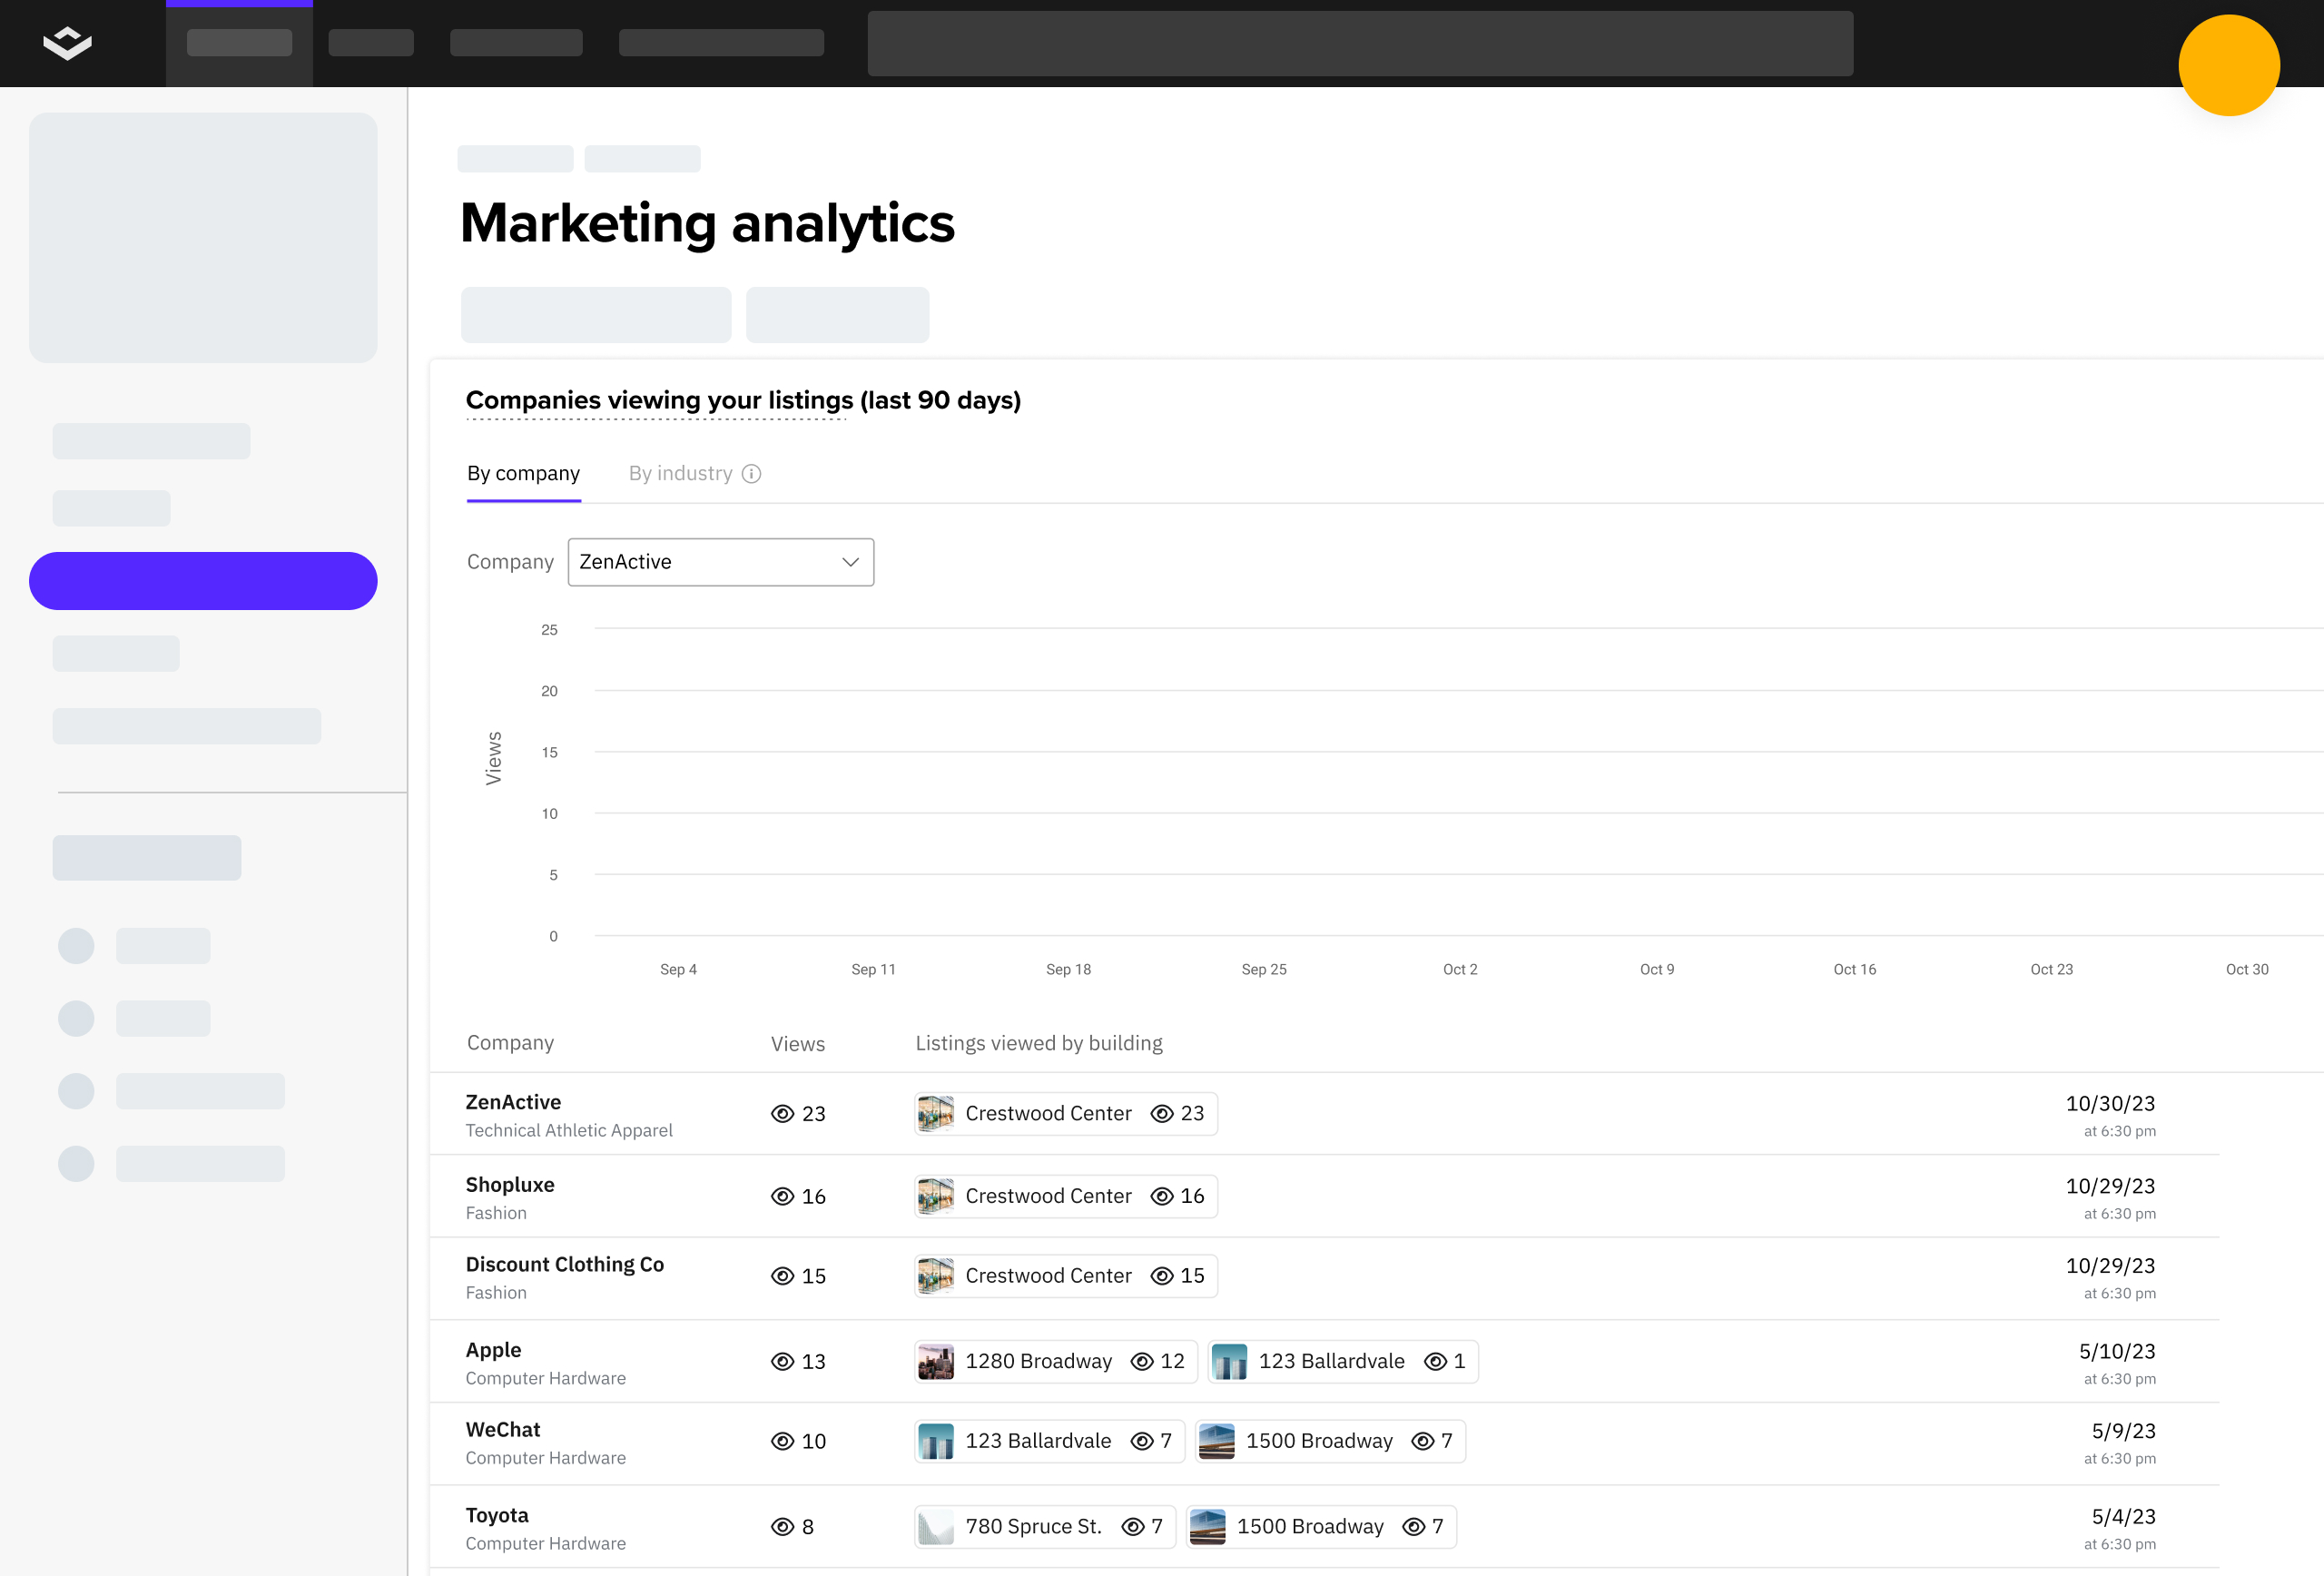
Nexio viewed Suite 1201
Nexio viewed Suite 1201

Nexio viewed VTS Tower's Building Page
Nexio viewed VTS Tower's Building Page
Nexio viewed Virtual Tourbook 8 times

Gensler, initiated by Nexio, viewed the space


NEXT
National Association of Realtors
National Association of Realtors
State of the Market—Retail Tenant Behavior
State of the Market—Retail Tenant Behavior
Wall Street Journal


04
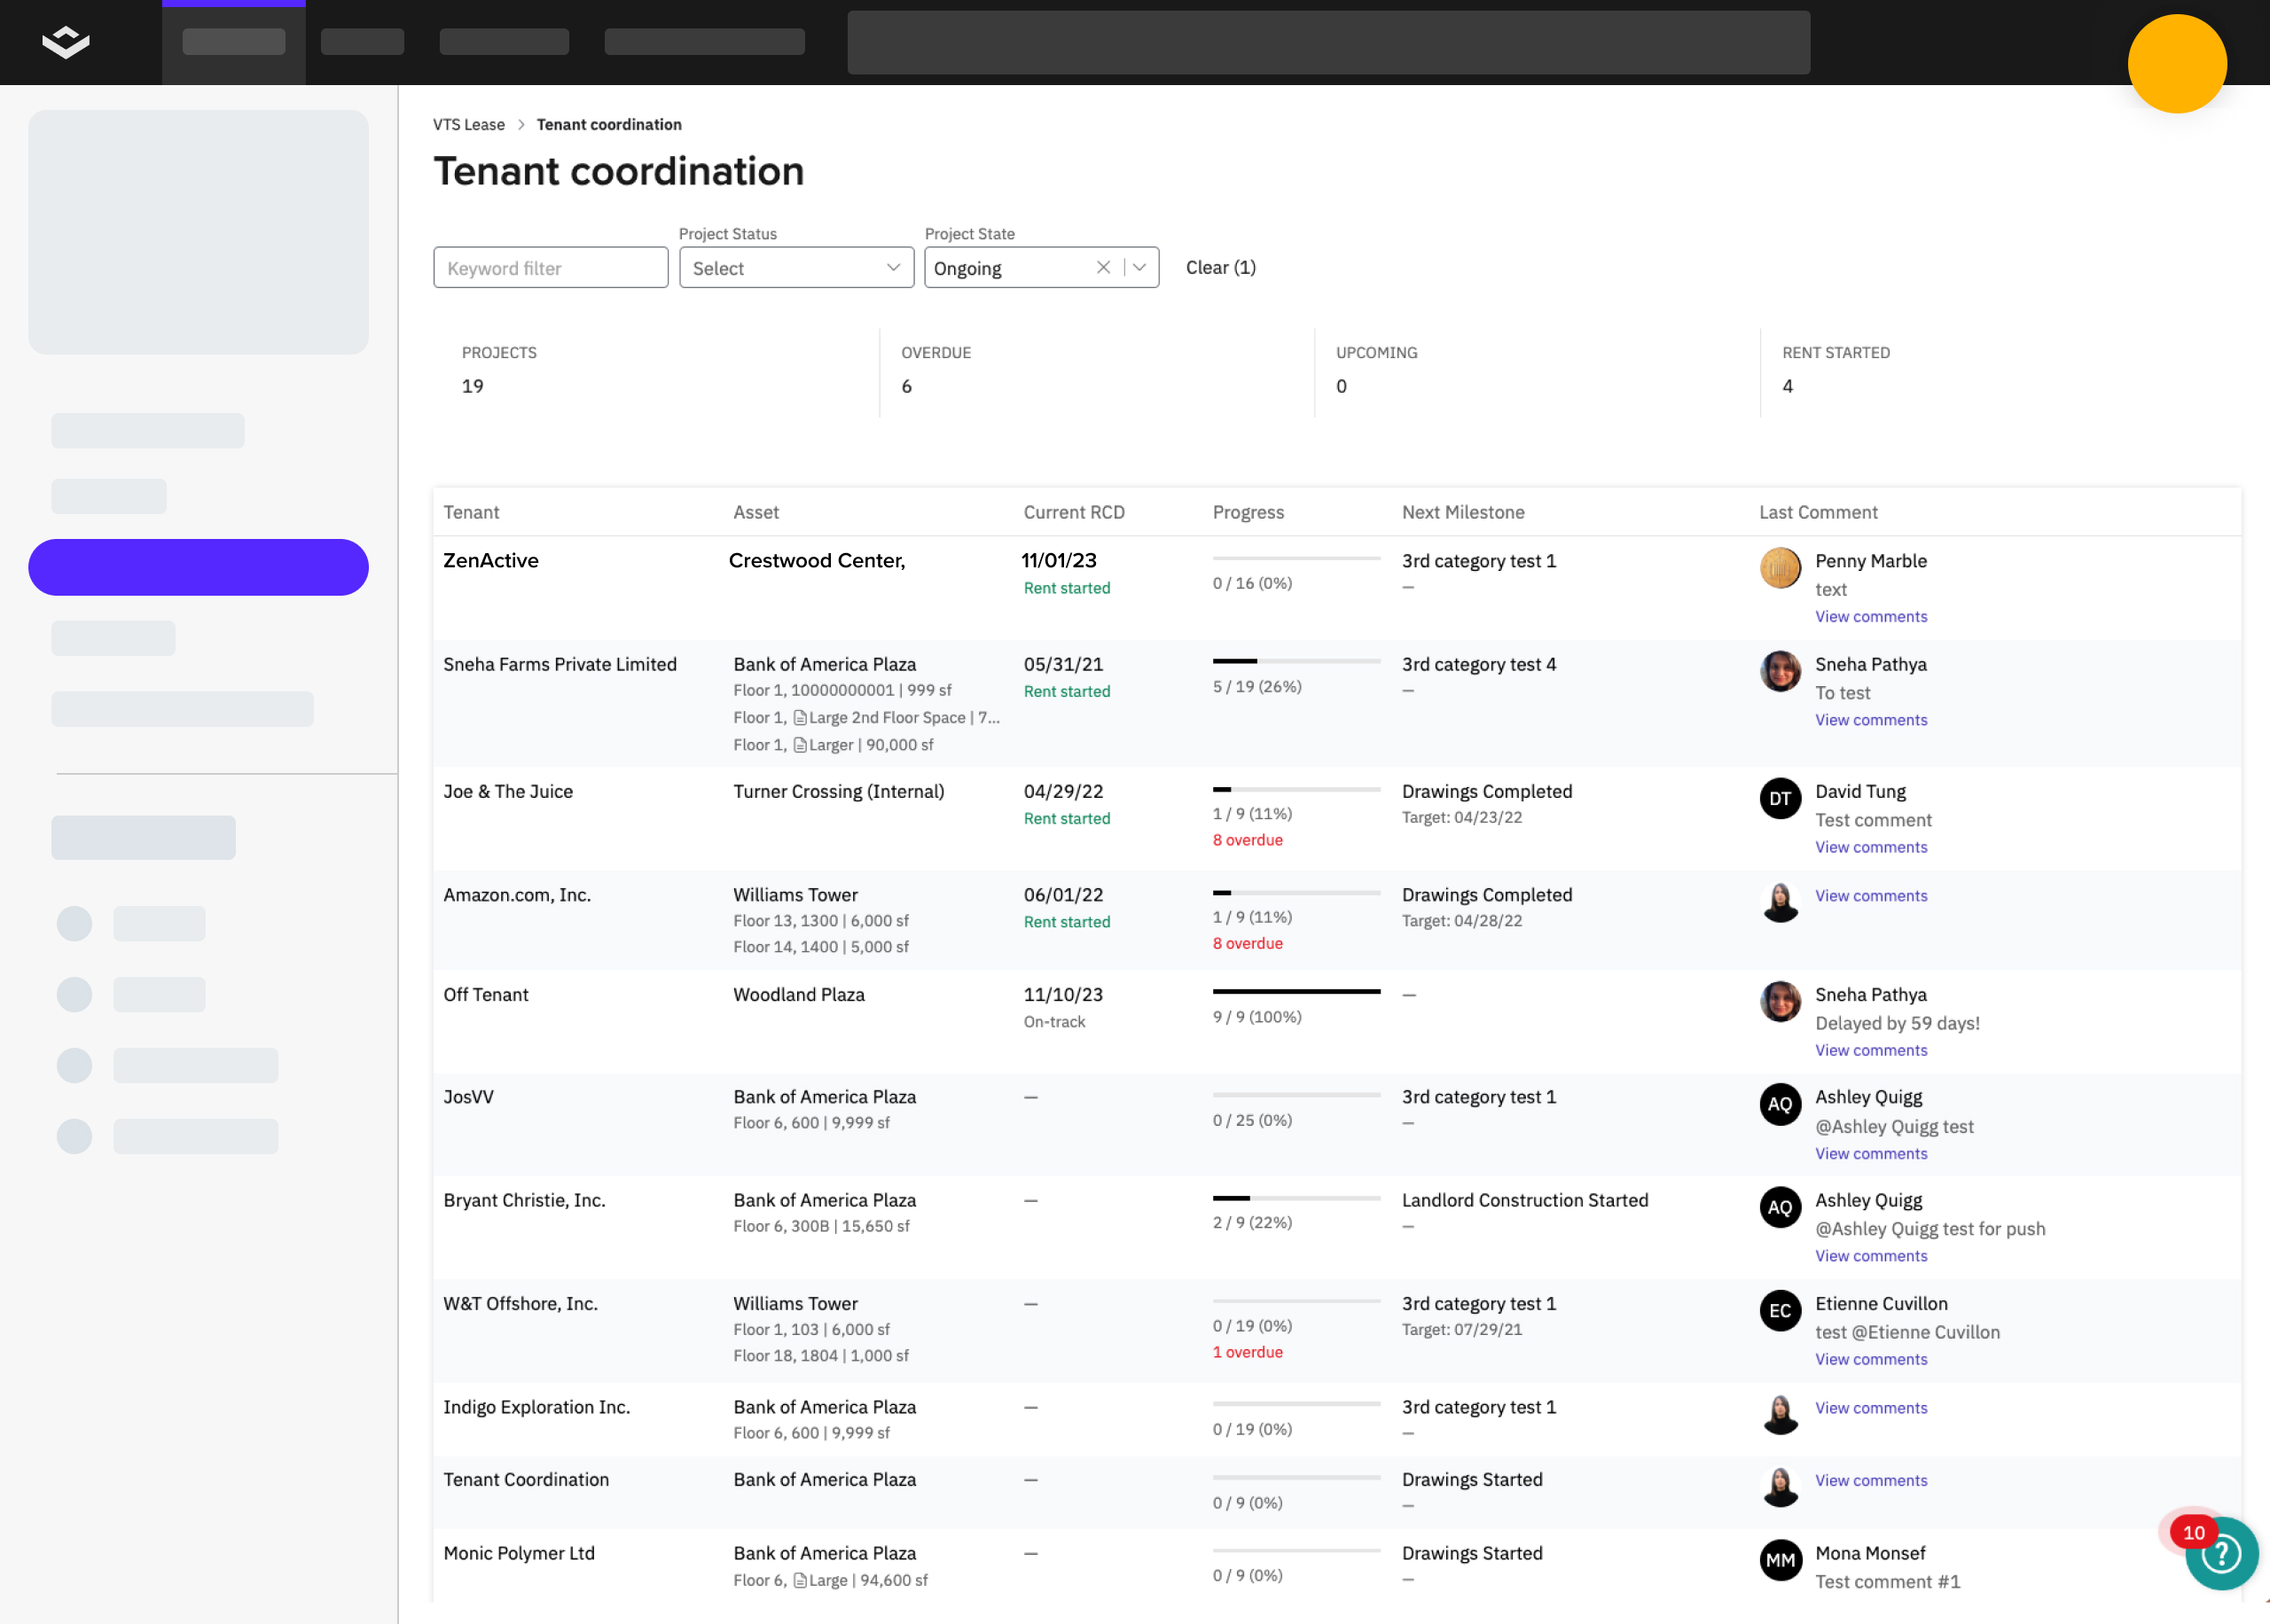
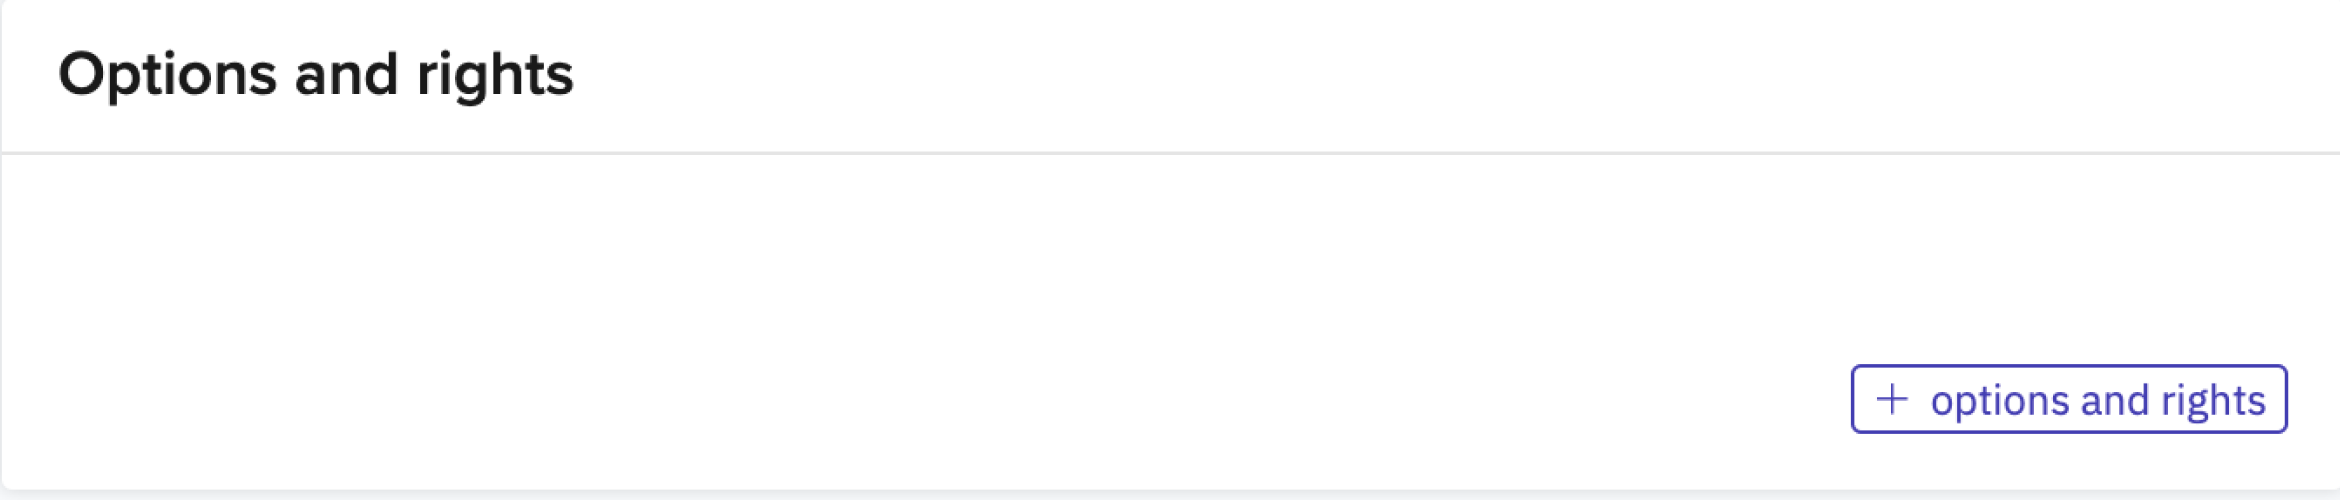
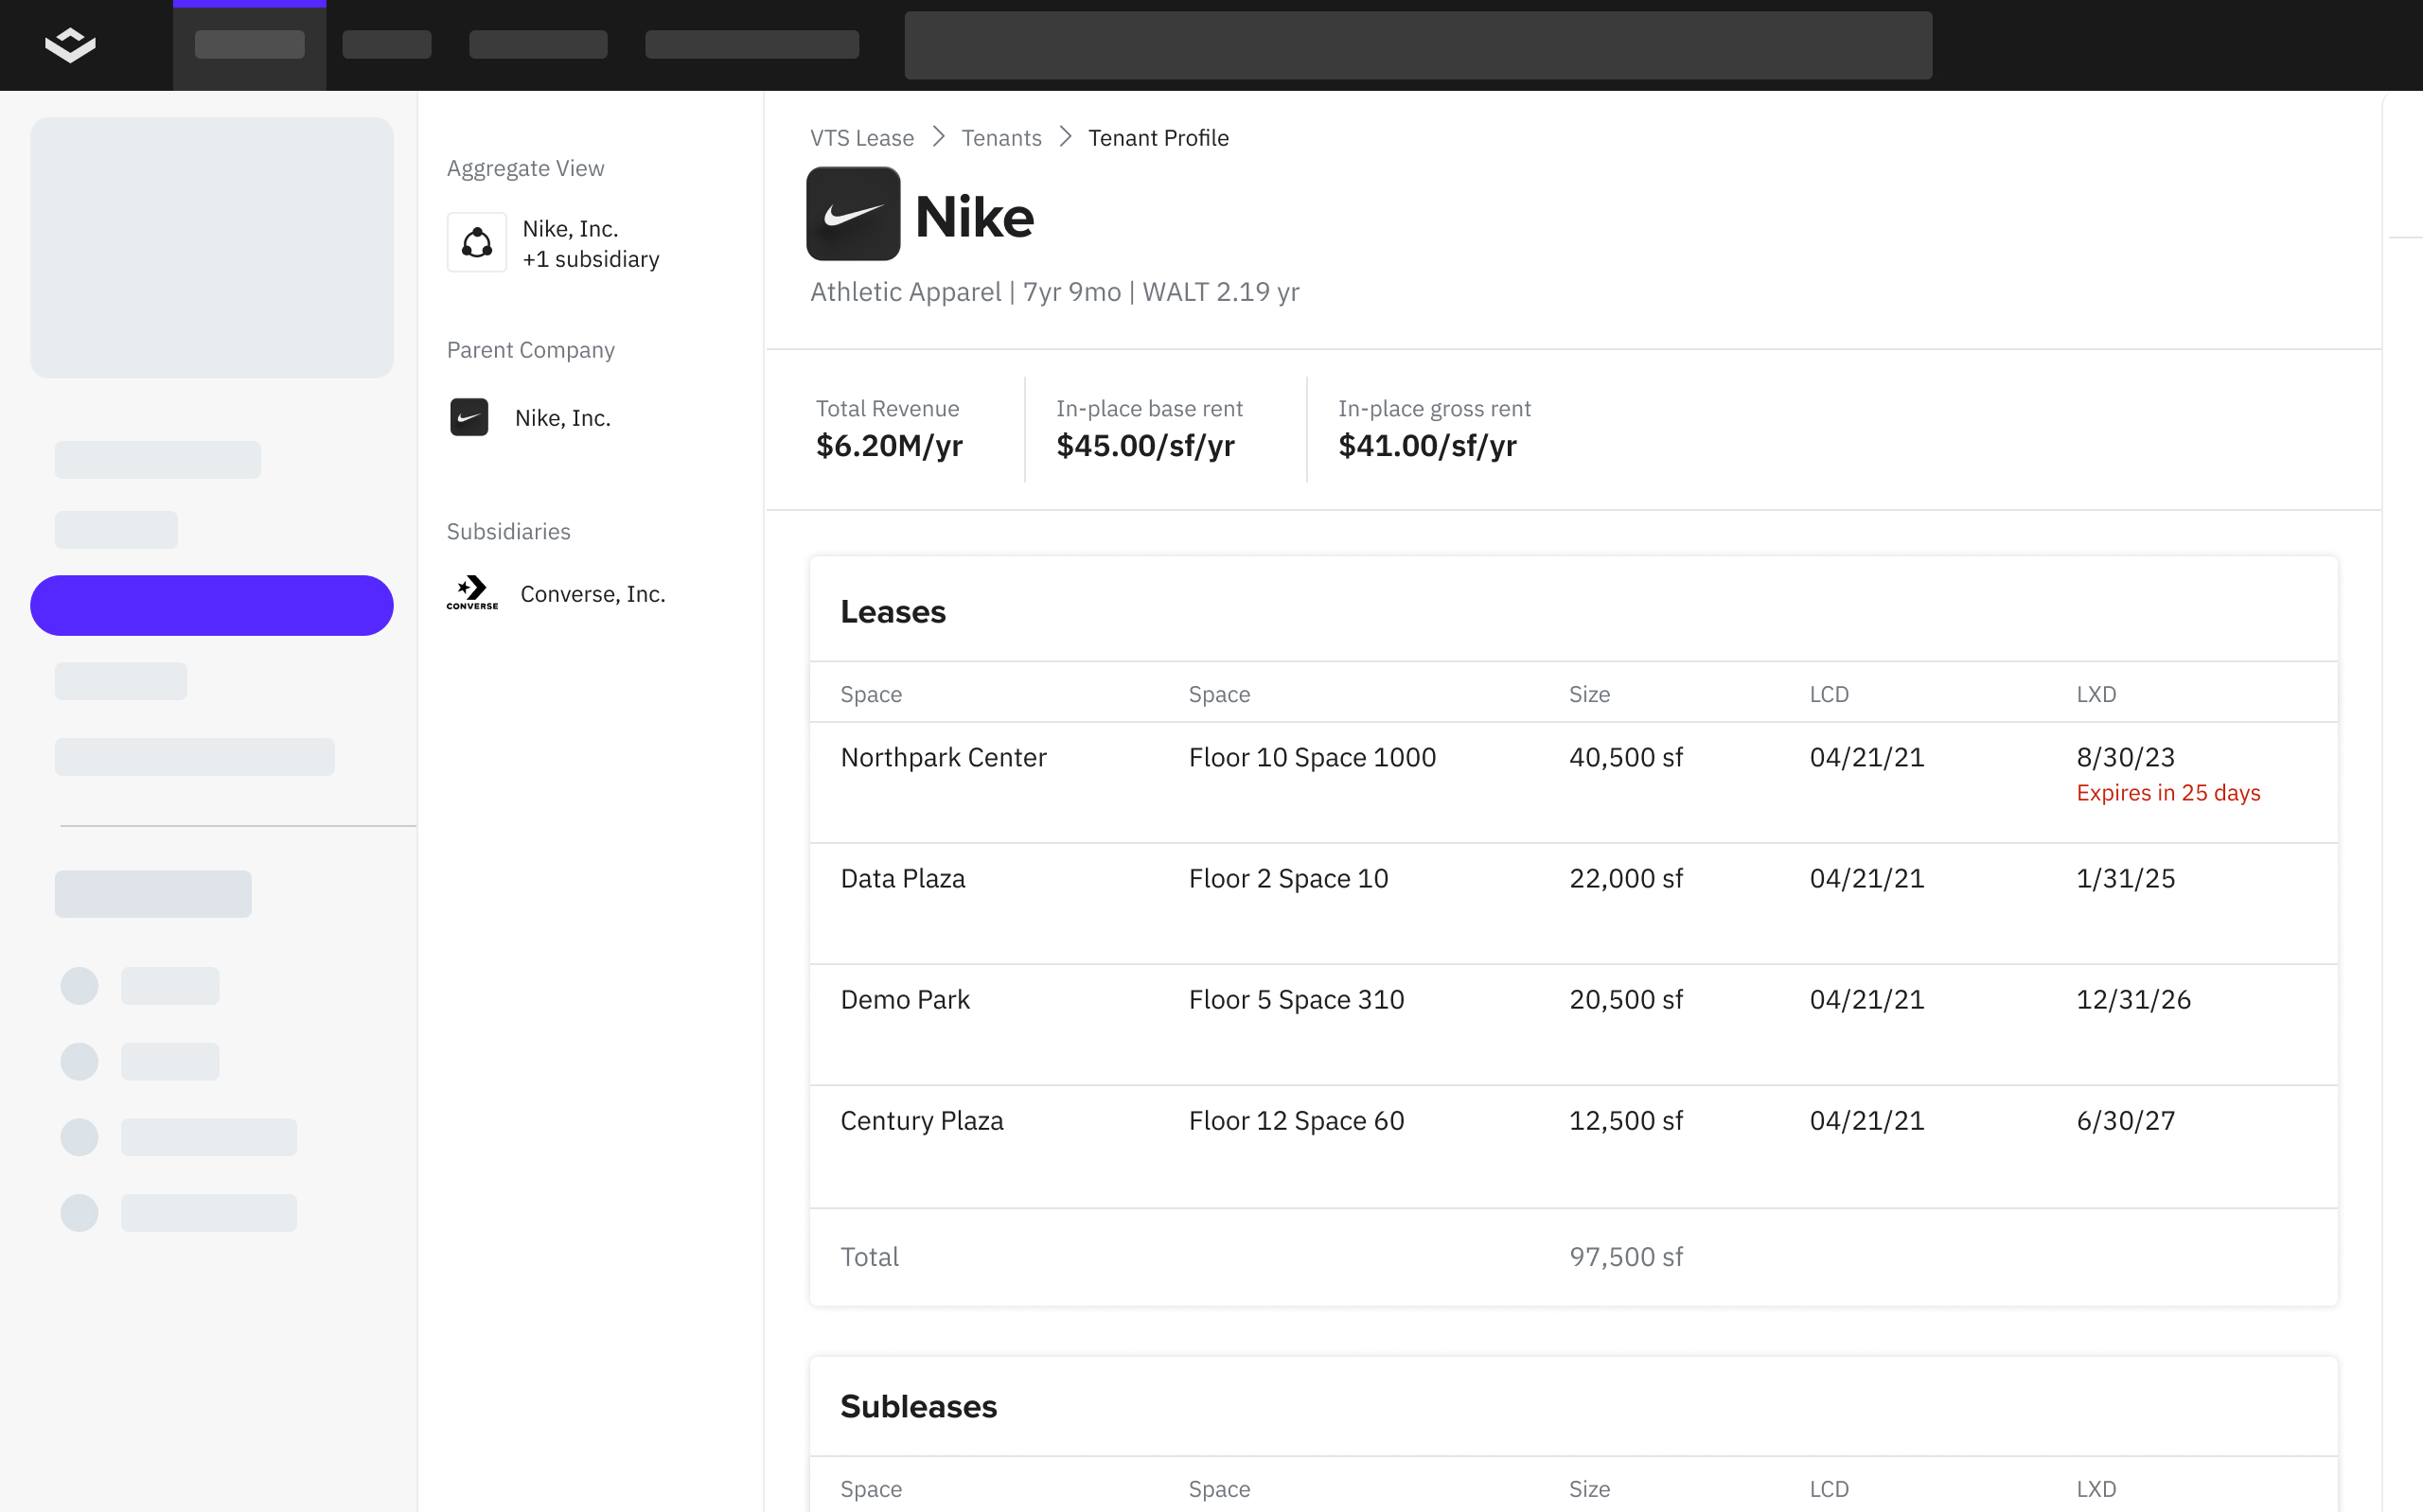
Ensure tenants move in on time
SEE IT IN ACTION


Create transparency among stakeholders and ensure tenants are moving in on time with tenant coordination workflows.